


10 Simple Tips for Financial Well-Being
07/01/2026
After a nasty finish to 2018, stocks have had a remarkable rally with hardly a pause in the advance the first three months of 2019. The major averages are near their highest point in six months. The best types of advances that I have experienced over my 37-year career are ones where there only small pullbacks, forcing investors who are on the sidelines to purchase stocks as the overall market is rising. This is exactly what appears to be happening as evidenced by consecutive days of advances in the major averages and many stocks.
What will stall the advance remains unknown. Therefore, having a plan in place to follow that manages your risk is important. Time will tell what the catalyst could be going forward to cause a potential trend change. Whether it’s the upcoming earnings season, further delay in the U.S. trade deal, or a slowdown of global economic growth that will disappoint investors. For now, most chart patterns remain constructive. Our main U.S. equity timing model remains on a buy suggesting that risk is likely to be contained. Daily tape action remains encouraging and continues to show signs the rally has more room on the upside, and not at a market peak.
Bullish Tape Action
Where do we go from here?
Watch the Russell 2000 Index ETF (IWM)
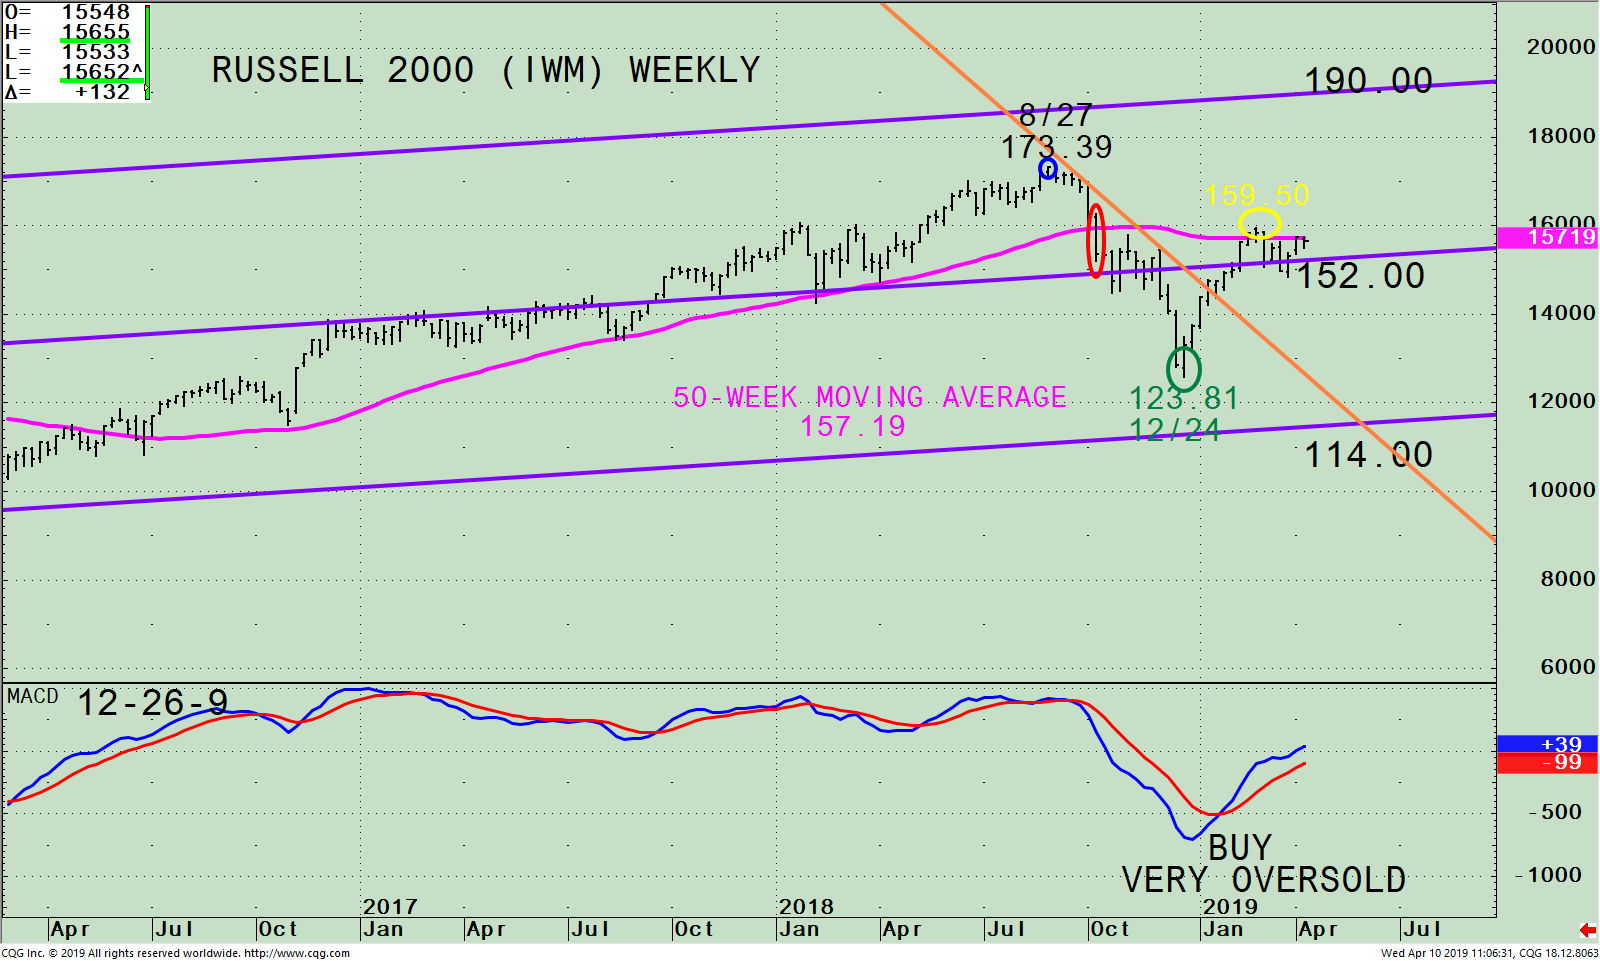
Figure: Weekly Russell 2000 (IWM) Price (Top) and 12-26-9 MACD (Bottom)
The top portion of the chart shows the weekly (intermediate-term) Russell 2000 (IWM)*** and its active price channel (purple line). In addition, there is the 50-week moving average (pink line) that traders watch to define the trend.
After a steady uptrend, selling started in the IWM during October 2018 after falling below the 50-week Moving Average at 159.00 (red circle). Selling accelerated further after breaking below the middle channel to a low of 123.81 on 12/24.
The IWM took off in a powerful rally from its December low, breaking the downtrend (orange line) in January 2019, without any notable pullback to date. The IWM slightly penetrated the 50-week moving average on 2/25 at 159.50, stalled and turned down into March but no heavy selling pressure occurred. Since the beginning of April, the IWM has started to show indications of strength implying more room to the upside is possible. If the IWM has a weekly close above 157.19, (the 50-week MA) this could be the first sign the February high of 159.50 (yellow circle) will be taken out toward the old August high (dark blue circle) of 173.39. Also monitor if the IWM begins outperforming the S&P 500, showing favorable relative strength. If both the February high of 159.50 is penetrated, and the IWM takes over relative strength leadership, the advance is likely to continue. A close below 148.00 would violate my bullish optimism.
The lower portion of the chart is MACD, a technical indicator that measures momentum. MACD is on a buy, rising and above 0 with no signs suggesting the rally is over. If MACD turns down and generates a sell, (I’m not expecting that now) then this would be a warning a decline is likely, more caution is needed and it’s time to reduce risk.
Summing Up:
The Russell 2000 has risen almost 30% since the December low. However, the gains have slowed in recent weeks and have stalled near the 50-week moving average. A weekly close above 157.19 could be the first sign that a further rally toward the old August high of 173.39 will occur. Monitor if the IWM begins to outperform the S&P 500. If both the February high of 159.50 is penetrated and the IWM outperforms the S&P 500 then the advance could begin to accelerate. If the IWM falls below 148.00 this would suggest the short term could be vulnerable.
I would love to hear from you. Please call me at 516-829-6444 or email at bgortler@signalert.com to share your thoughts or ask me any questions you might have.
**The iShares Russell 2000 Index ETF (IWM) is made up of companies with a market capitalization of between $300 million and $2 billion. The portfolio top 5 sector holdings as of 4/10/19 are Financials 24.40%, Industrials 14.85%, Health Care 14.35%, Consumer Cyclicals 14.24%, and Technology 13.69% (Source: http://www.etf.com/IWM).
Sign up for a FREE 3 issue trial of
SYSTEMS AND FORECASTS Click here
******Article published in Systems and Forecasts by Bonnie Gortler April 10, 2019
Disclaimer: Although the information is made with a sincere effort for accuracy, it is not guaranteed that the information provided is a statement of fact. Nor can we guarantee the results of following any of the recommendations made herein. Readers are encouraged to meet with their own advisors to consider the suitability of investments for their own particular situations and for determination of their own risk levels. Past performance does not guarantee any future results.
If you like this article you would love the free excerpt chapter of my book Journey to Wealth.
Get instant access here


Create more wealth in your life
with these simple strategies.
As an added bonus you will also
receive BG’s Updates and Ezine

Discover how to quickly create more well-being in your life with these simple strategies.
As an added bonus you will also
receive BG’s Updates and Ezine

As an added bonus you will receive BG’s Updates and Ezine

All work listed on BonnieGortler.com is licensed under a Creative Commons Attribution - Noncommercial - No Derivative Works 3.0 Unported License.


Free Report:
Grow and Sustain Your Wealth
Discover how to grow your money with these easy, simple steps.

