

10 Simple Tips for Financial Well-Being
07/01/2026
How many millionaires do you know who have become
wealthy by investing in savings accounts? I rest my case.
–Robert G. Allen
Early weakness in October created a short-term oversold condition in several technical indicators. Uncertainty about interest rates, recession risks, and a trade war were major concerns of investors. With investors expecting a decline, short-term sentiment fell to a high level of pessimism (As a contrary indicator), extreme levels of pessimism are bullish.) What looked like a threatened decline in October never materialized. The major averages held support and successfully tested the lows made in August.
A tradeable rally began in October when the short-term Nasdaq 100 (QQQ) cycle bottomed (see my article in our 10/2/19 newsletter). The Nasdaq rose over the last five weeks, and the S&P 500 had its fourth straight weekly gain. Transportation, financials, international, as well as small and mid-cap sectors (which lagged the major averages) joined the advance. This led to the Dow, S&P 500, and Nasdaq breaking out of their trading range to the upside, all making new all-time highs in November. Market breadth has improved. It’s bullish the NYSE A-D Decline line has confirmed the breakout, achieving a new all-time high.
Despite short-term indicators being extended and short-term sentiment no longer showing signs of pessimism, the rally continues in early November. The rise appears to be broadening. It’s positive that momentum indicators are still rising, implying there is more room to the upside. In my experience, the best moves in the market are the ones where there is little or no pull back, and the market goes straight up. Some base building may be needed, and gains may slow somewhat. However, for now, the bulls are clearly in control, and they will be helped by a normally historically favorable seasonal period in the coming months.
Where do we go from here? Keep an eye on the action in Small Caps
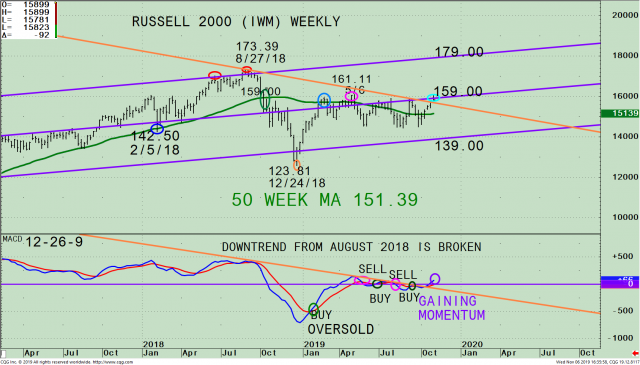
Figure 1: Weekly Russell 2000 (IWM) Price (Top) and 12-26-9 MACD (Bottom)
The top portion of the chart shows the weekly (intermediate-term) Russell 2000 (IWM)1 and its price channel (purple line) with a 50-week moving average (green line) that traders watch and use to define trends.
Since July 2018, IWM has lagged in terms of relative strength compared to the S&P 500. However, IWM has been gaining strength this year since 9/30 up more than 9%, a strong thrust to the upside, a positive sign. Even with its gains, IWM remains about 8.25% below its all-time high as of 11/5. IWM hit the upper channel for the second time (red right circle), before peaking on 8/27/18. IWM then weakened in October 2018, falling below the 50-Week Moving Average at 159.00 (green circle). Selling intensified quickly penetrating the lower channel, before finally making a low on 12/24/18 at 125.81.
In January and February 2019, IWM reversed sharply to the upside toward the mid-channel but weakened after making a secondary high on 5/6/19 (pink circle) at 161.11 stalling slightly above the 50 Week Moving Average. Notice how the slope of the 50-Week Moving Average (green line) was falling (weak momentum), in May compared to how sharply the slope was rising in April – August 2018 (positive momentum). Since May IWM has moved sideways unable to get through the down trend line (orange line) when IWM rose and began a pattern trading above and below the 50- Week Moving Average (green line). On 10/14 IWM, once again penetrated and closed above its 50-week MA of 151.39.
The intermediate trend has shifted to positive. It is bullish IWM has broken the downtrend (light blue circle), and the slope of the 50 Week MA is now rising. IWM closed at 158.23 on 11/6, slightly under the middle channel at 159.00. A weekly close above 159.00 would validate an upside objective to 179.00, the upper channel, another 13.1% higher. Resistance is 161.00, followed by 173.39 (the August high).
The lower portion of the chart above is MACD, a technical indicator that measures momentum. MACD remains on a buy after a few quick buys and sells (pink and green circles). The MACD pattern is now favorable, rising from below 0. It is bullish that MACD has broken its downtrend from August 2018 and is gaining momentum confirming, the recent rise in IWM.
Summing Up:
The stock market rally continues in early November and appears to be broadening to out of favor sectors that have not yet made new all-time highs. The weekly chart of the Russell 2000 (IWM) technical pattern is improving, gaining momentum, and has broken its downtrend from August 2018, implying there is more room to the upside. If you have spare cash and don’t mind greater risk than investing in the S&P 500, I recommend purchasing IWM when it closes above 159.00 for two days. A close below 151.00 would negate my positive outlook and should be used as a stop.
I would love to hear from you. Please call me at 516-829-6444 or email at bgortler@signalert.com to share your thoughts or ask me any questions you might have.
1 The iShares Russell 2000 Index ETF (IWM) is made up of companies with a market capitalization of between $300 million and $2 billion. The portfolio top 5 sector holdings as of 8/20/19 are Financials 26.53%, Health Care 15.49%, Industrials 15.28%, Technology 12.93%, and Consumer Cyclicals 12.89% totaling 83.12% (Source: http://www.etf.com/IWM).
Sign up for a FREE 3 issue trial of SYSTEMS AND FORECASTS Click here

If you like this article you will love my
Free EBook Grow Your Wealth and Well-Being
.
******Article first published in Systems and Forecasts on November 8, 2019
Disclaimer: Although the information is made with a sincere effort for accuracy, it is not guaranteed that the information provided is a statement of fact. Nor can we guarantee the results of following any of the recommendations made herein. Readers are encouraged to meet with their own advisors to consider the suitability of investments for their own particular situations and for determination of their own risk levels. Past performance does not guarantee any future results.


Create more wealth in your life
with these simple strategies.
As an added bonus you will also
receive BG’s Updates and Ezine

Discover how to quickly create more well-being in your life with these simple strategies.
As an added bonus you will also
receive BG’s Updates and Ezine

As an added bonus you will receive BG’s Updates and Ezine

All work listed on BonnieGortler.com is licensed under a Creative Commons Attribution - Noncommercial - No Derivative Works 3.0 Unported License.


Free Report:
Grow and Sustain Your Wealth
Discover how to grow your money with these easy, simple steps.

