

10 Simple Tips for Financial Well-Being
07/01/2026
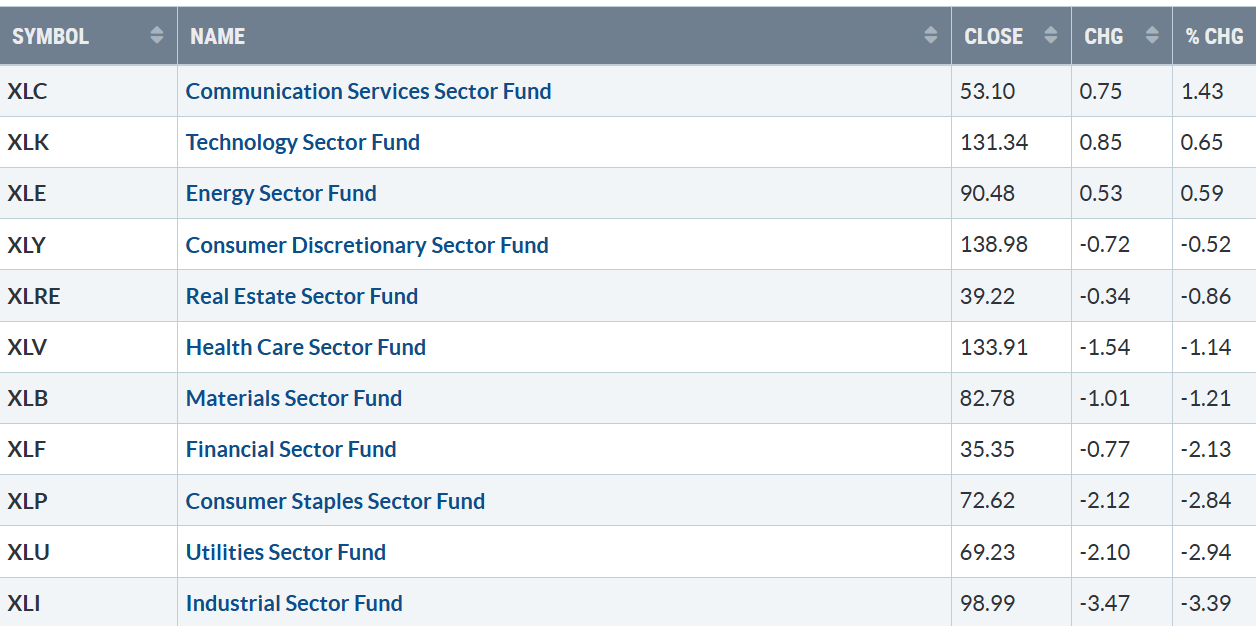
The week closed strong. However, only three of the eleven S&P SPDR sectors were higher. Communication Services (XLC), Technology (XLK), and Energy were the leading sectors, while Utilities (XLU), and Industrials (XLI), were the weakest, with the SPDR S&P 500 ETF Trust (SPY) down -0.66%.
S&P SPDR Sector ETFs Performance Summary 1/13/23 – 1/20/23
012023 SPDR Sectors
Source: Stockcharts.com
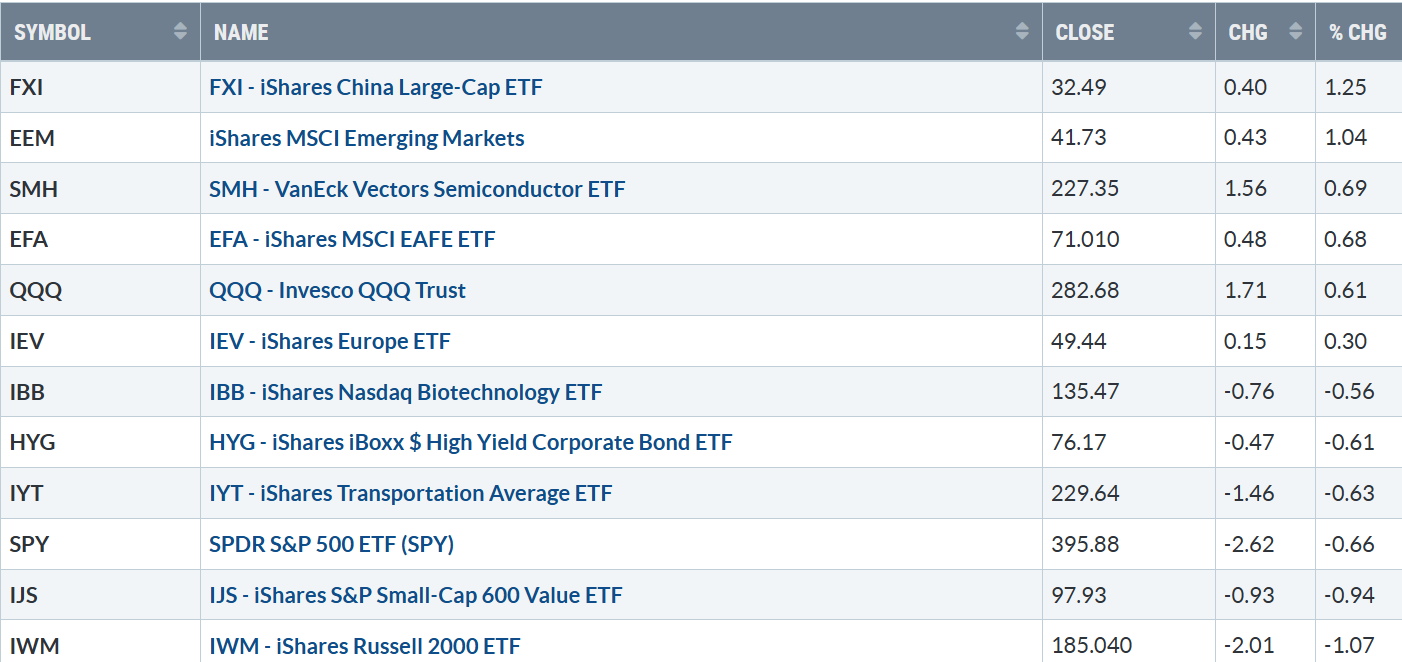
Figure 2: Bonnie’s ETFs Watch List Performance 1/13/23 – 1/20/23
012023 Week ETFs
Source: Stockcharts.com
International markets were higher, continuing their best rally in over a decade. Semiconductors and Technology led, while Small Cap Growth and Value lagged.
Figure 3: 30-Year Fixed Rate Mortgage Average in the US

012023 UST 30 Yr Fixed Rate Morgage Average in the US Daily
Source: Stockcharts.com
With inflation falling, mortgage rates have declined to their lowest level since September 2022, breaking the 2022 uptrend. Support is 5.00%. If rates were to close above 6.50, this would negate my objective.
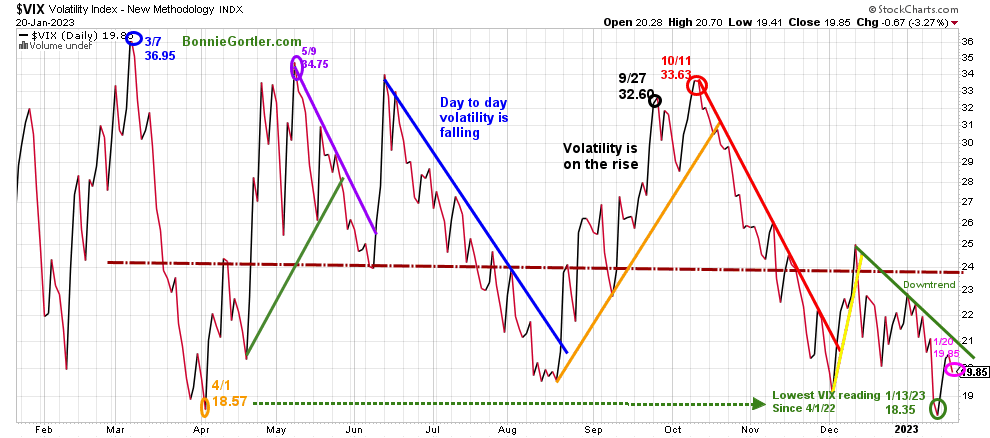
Figure 4: CBOE Volatility Index VIX
012023 VIX Daily
Source: Stockcharts.com
The CBOE Volatility Index (VIX), a measure of fear, traded above 20.00 for most of 2022. In late January 2022, VIX made a high at 36.95 on 3/7 (blue circle) and a low on 4/1/22 at 18.57. A new VIX low didn’t occur until 1/13/23 at 18.35.
Last week, VIX rose to 19.85 (pink circle). Look for intra-day-day volatility to be contained if VIX remains in the downtrend (green line) below 21.00 next week.
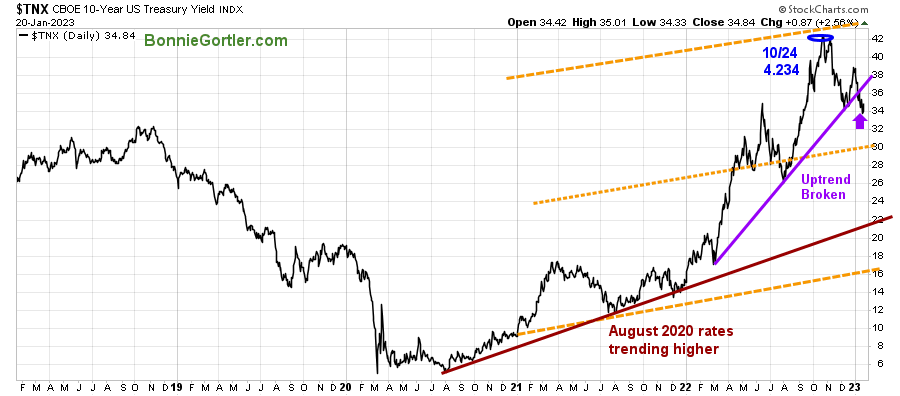
Figure 5: UST 10YR Bond Yields Daily
011423 UST 10 Yr Bond Yields Daily
Source: Stockcharts.com
The 10-Year U.S. Treasury yields fell and closed at 3.511%, remaining below the March uptrend (purple line) that it broke the previous week. Support is at 3.00%, and resistance is at 3.80%.
The major averages for the week were mixed, Dow was down -2.70%, S&P 500 was down -0.66%, and the Nasdaq was up +0.55%. The Russell 2000 Index fell -1.04%.
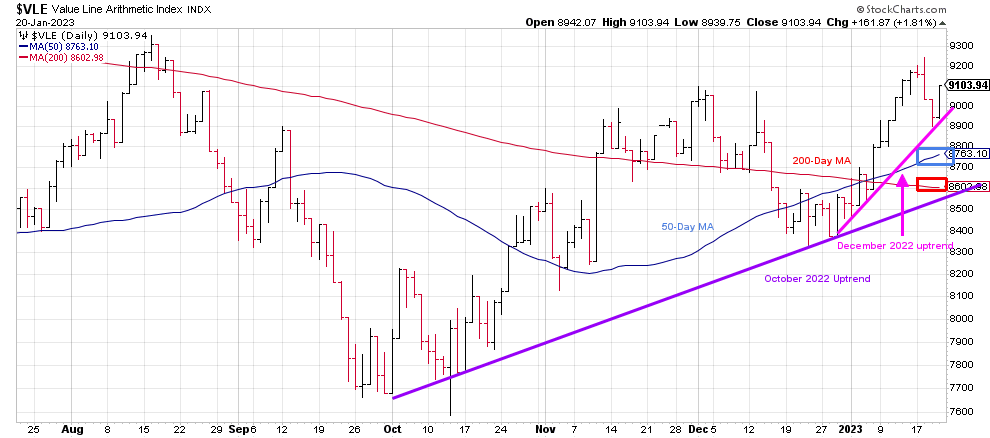
Figure 6: Valueline Arithmetic Index Daily
012023 Valueline Arithmetic Index Daily
Source: Stockcharts.com
The Value Line Arithmetic Index (a mix of approximately 1700 stocks) was lower by -0.72%. However, despite losing ground last week, the index remains above the 50 (blue rectangle) and 200-Day Moving Average (red rectangle).
Both uptrends from October and December remain intact. As long as they do so, the odds favor higher prices.
Weekly market breadth was positive on the New York Stock Exchange Index (NYSE) and slightly negative for Nasdaq. The NYSE had 1811 advances and 1478 declines, with 228 new highs and 28 new lows. There were 2522 advances and 2573 declines on the Nasdaq, with 323 new highs and 83 new lows.
Nasdaq and New York continued having more new highs than lows every day last week. Watch for New Highs’ expanding on the NYSE and Nasdaq for the rally to accelerate higher next week.
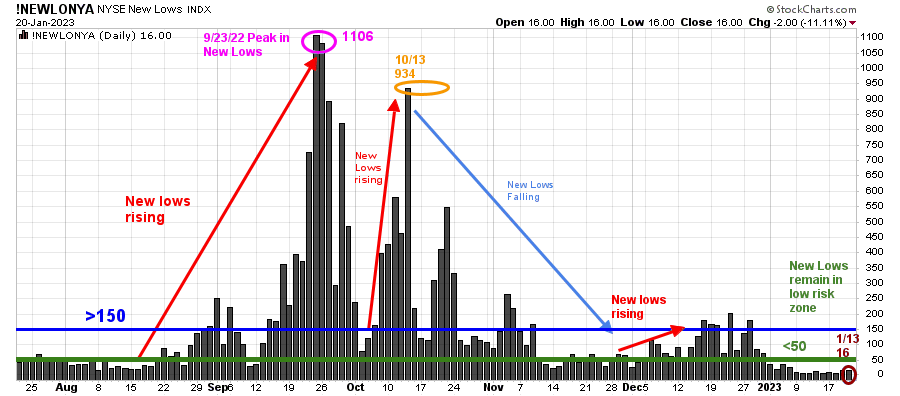
Figure 7: Daily New York Stock Exchange (NYSE) New Lows
012023 NYSE New Lows Daily
Source: Stockcharts.com
Watching New lows on the New York Stock Exchange is a simple technical tool that helps awareness of the immediate trend’s direction.
New lows warned of a potential sharp pullback, high volatility, and “panic selling” for most of 2022, closing above 150. The peak reading was 9/23/22 when New Lows made a new high of 11/6 (pink circle). New Lows closed at 16 (brown circle), below 25, remaining in the lowest risk zone, and is short-term positive for the market. On the other hand, a rise above 150 and an expansion of New Lows would be a warning of weakness forthcoming.  Learn more about the significance of New Lows in my book, Journey to Wealth, published on Amazon. If you would like a preview, get a free chapter here.
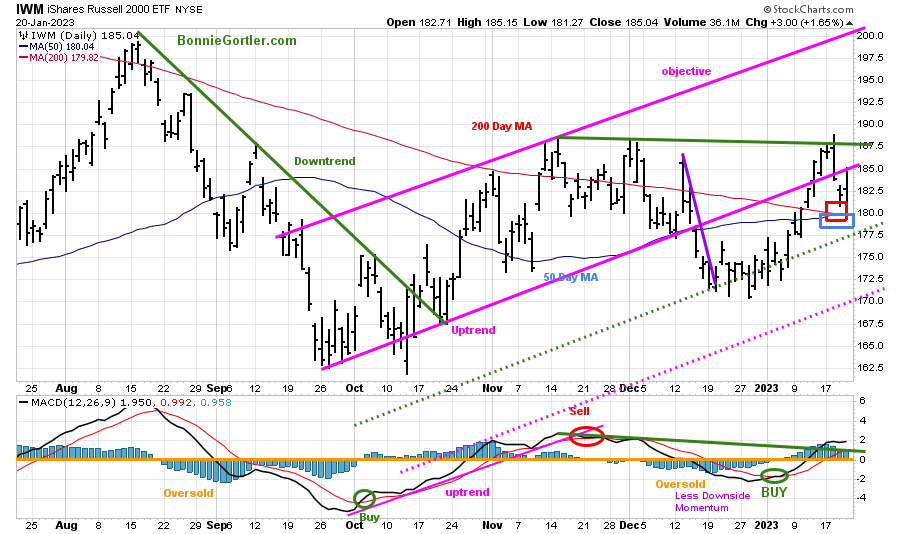
Figure 8: Daily iShares Russell 2000 (IWM) Price (Top) and 12-26-9 MACD (Bottom)
012023 IWM Daily
Source: Stockcharts.com
The top portion of the chart is the daily iShares Russell 2000 Index ETF (IWM), the benchmark for small-cap stocks, with a 50-Day Moving Average (MA) (blue line) and 200-Day Moving Average (MA) that traders watch and use to define trends.
IWM closed at 185.04, down -1.07%, closing above its 200-Day Moving Average (red rectangle) and 50-Day Moving Average (blue rectangle) but below the channel where it broke down (pink line) in December, which was acting as resistance.
IWM was weaker than the S&P 500 instead of leading, which is not what you want to see for a broad sustainable rally.
MACD (middle chart) remains on a buy, above 0 (orange line), flattening after breaking the downtrend from November 2022.
Short-term resistance is 185.00 and 187.50, with support at 180.00,177.50, and 170.00. The upside objective is 200.00.
It would be negative for the broad market in the short term if IWM closes below 177.50 and short-term positive above 187.50.
QQQ and Nasdaq have improved in 2023
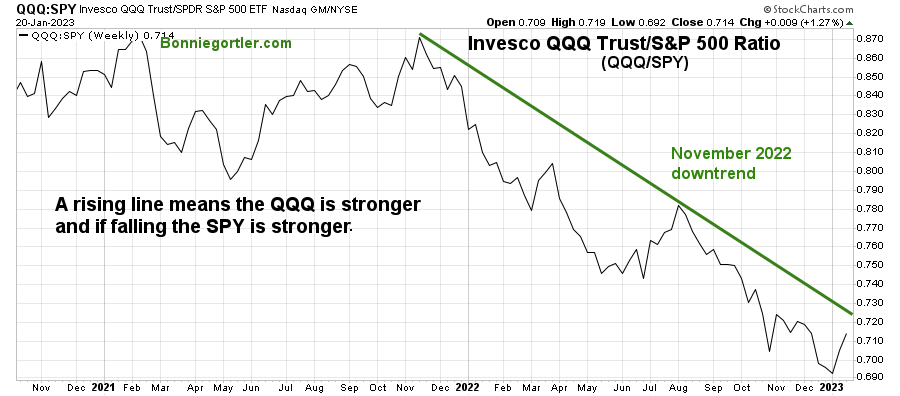
Figure 9: Invesco QQQ Trust (QQQ)/SPDR S&P 500 (QQQ/SPY) Weekly Relative Strength Index Ratio
012023 QQQ/SPY Weekly Relative Strength Ratio
Source: Stockcharts.com
The chart above is the weekly Invesco QQQ Trust (QQQ)/SPDR S&P 500 (QQQ/SPY) Relative Strength Index Ratio. A rising line means the QQQ is stronger, and if falling, the SPY is stronger.
The (QQQ/SPY) ratio fell to its lowest level at the start of January, turned up, and is, gaining strength. Continued outperformance of QQQ vs. SPY penetrating the November 2022 downtrend (green line) would be bullish for Information Technology, Communication Services, and Consumer Discretionary stocks, the top sector allocations of QQQ.
Learn about coaching with Bonnie. Ask questions. Discover more about the coaching processes in this 15-minute call by emailing me at Bonnie@BonnieGortler.com. I would love to connect with you
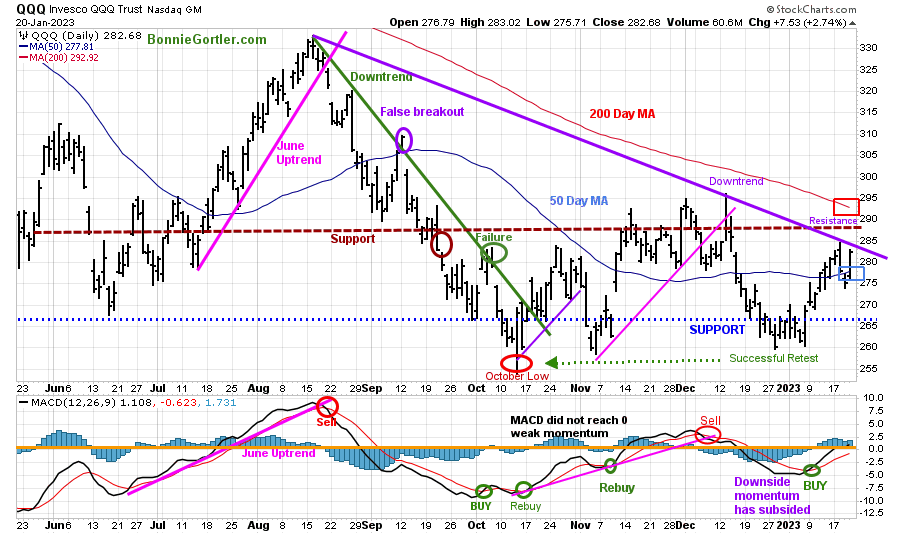
Figure 10: Daily Invesco QQQ Trust (QQQ) Price (Top) and 12-26-9 MACD (Bottom)
012023 QQQ Daily
Source: Stockcharts.com
The chart shows the daily Invesco QQQ, an exchange-traded fund based on the Nasdaq 100 Index. QQQ moved lower after a false break out (purple circle) in September of the August downtrend (green line) but had a few rally attempts after but stalled and made a low in October 2022 (red circle).
It appears to be a successful test of the lows in December 2022, with tape action improving in 2023.
QQQ rose +0.61%% last week, closing at 282.68 above the 50-Day Moving Average and now closer to the 200-Day Moving Average (red rectangle) but fell short of penetrating resistance at 287.00.
QQQ support is at 275.00, 270.00, and 265.00. I would like to see QQQ hold above 275.00 next week and close above 287.00, breaking the downtrend (purple line) from August 2022.
The bottom chart is MACD (12, 26, 9) remains on a new buy above 0, with positive momentum
Keep an eye on Apple (AAPL) and Microsoft (earnings 1/24), over 20% combined, which will impact the performance of QQQ if they show strength or drag down QQQ. Both stocks have improving momentum patterns and are on a daily MACD buy but still closed below their 50 and 200-Day Moving Averages.
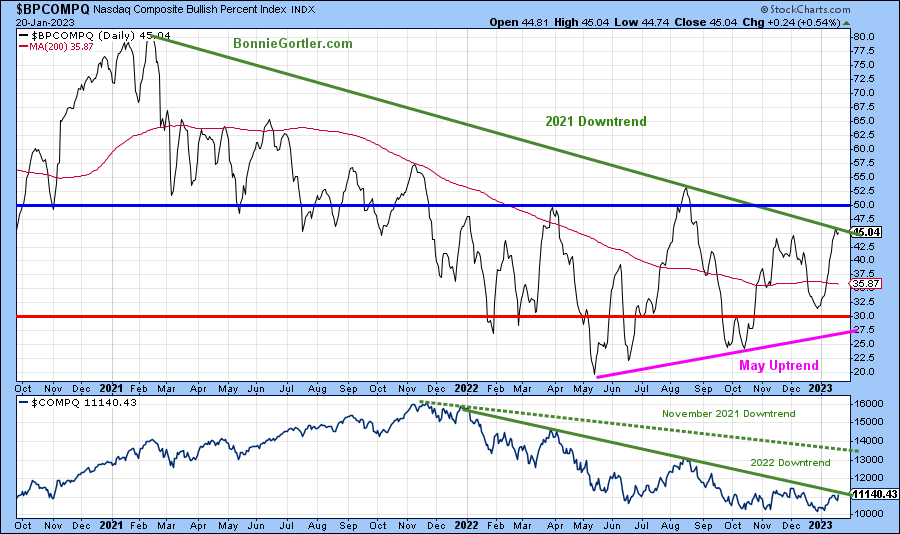
Figure 11: Nasdaq Composite Index Bullish Percent Index (Top) and Nasdaq Composite Index (Bottom)
012023nasdaq Bullish Percentage Daily
Source: Stockcharts.com
The Nasdaq Composite Index is a market capitalization-weighted index of more than 3,700 stocks listed on the Nasdaq Stock Exchange.
The Nasdaq index technical indicators continue to improve.
The Bullish Percentage indicator (BPI) is a breadth indicator. BPI has had higher lows since May 2022 and has formed an uptrend (pink line). Further gains of the indicator from its close of 45.04% above 50% would be a buy signal and break the 2021 downtrend in the BPI.
The bottom chart is the Nasdaq Composite. There are two downtrends (green dotted and solid green line). With strength this week, the Nasdaq Composite could break the 2022 downtrend, which would be positive.
A close above 50% in BPI and the break of the 2022 downtrend would be bullish.
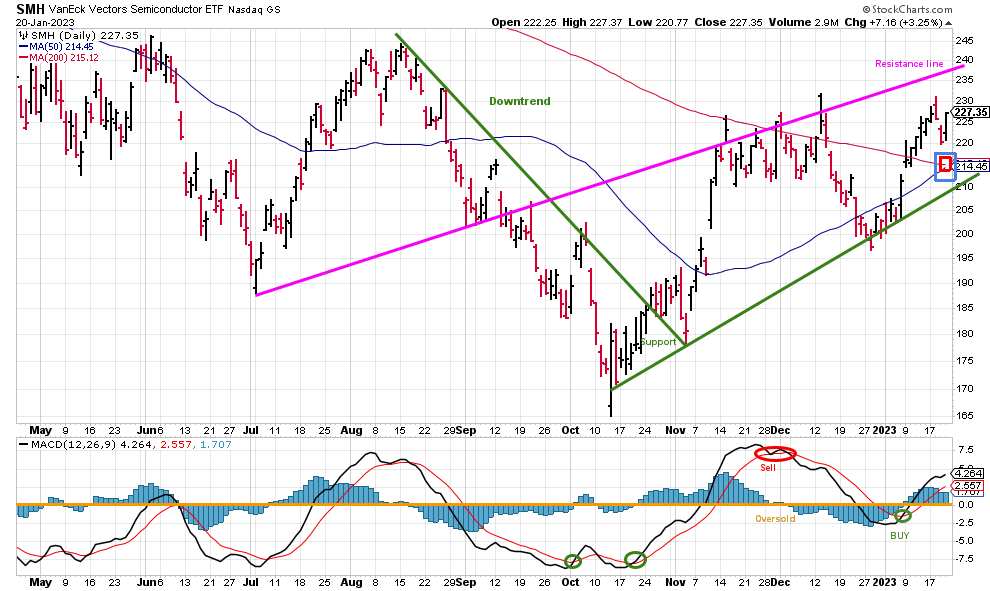
Figure 12: Van Eck Vectors Semiconductor (SMH) and 12-26-9 MACD (Bottom)

Source: Stockcharts.com
The top part chart shows the Van Eck Vectors Semiconductor (SMH) concentrated, mainly in US-based mega-cap semiconductors companies. SMH is a lead indicator for the market when investors are willing to take on increased risk and the opposite when the market is falling.
Semiconductors (SMH) rose +0.69 last week and are up 12.03% in 2023. SMH has remained in its uptrend since October and showing underlying strength. SMH closed above its 50 and 200 Day Moving averages (blue and red rectangle) and 50-week and 200-week moving Averages (chart not shown).
Support is at 214.00 and 210.00, while resistance is at 237.00 and 245.00.
MACD (lower chart) remains on a buy, rising, showing positive momentum.
Higher prices are likely in the short term for Semiconductors as long as the uptrend remains in effect.
Learn about coaching with Bonnie. Ask questions. Discover more about the coaching processes in this 15-minute call by emailing me at Bonnie@BonnieGortler.com. I would love to connect with you.
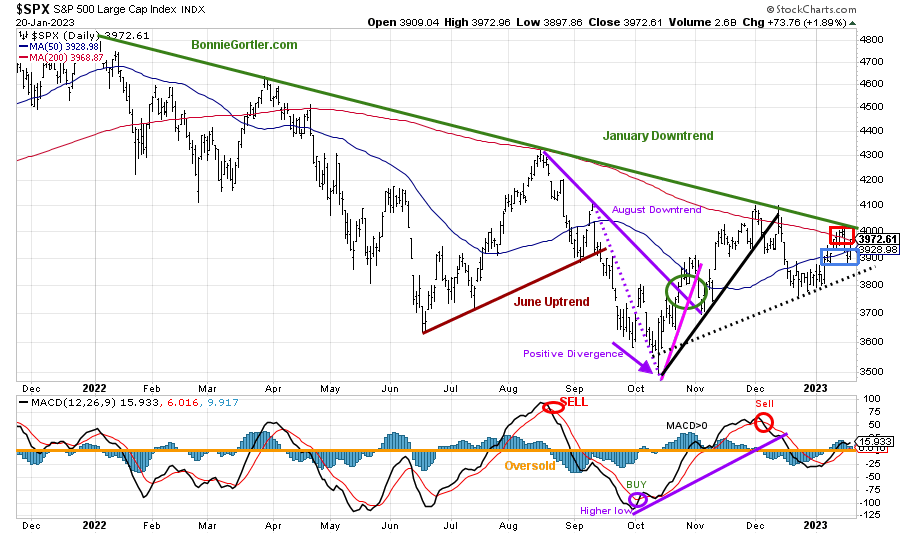
Figure 13: The S&P 500 Index ($SPX) Daily (Top) and 12-26-9 MACD (Bottom)
012023 SPX Daily
Source: Stockcharts.com
The S&P 500 (SPX) failed to get through resistance at 4100 in December 2022 and reversed lower, breaking the October uptrend (black line), and the 2022 downtrend remains in effect (green line) despite the rise in the first two weeks in 2023.
The S&P fell 0.66%, closing at 3972.61, in the upper part of the current trading range, closing above its 50-and 200-Day Moving Average (blue and red rectangle), showing underlying strength, but remains in a downtrend.
Resistance remains at 4100, while support is at 3900 and 3800.
MACD (lower chart) generated a buy last week (green circle) from below 0, is rising, and broke its downtrend, implying the worst downside momentum is complete.
Watch if SPX can close above resistance at 4000 and then gains momentum to close above 4100, tripping the buy stops fueling the next leg higher, or if the SPX stalls and falls below support at 3800.
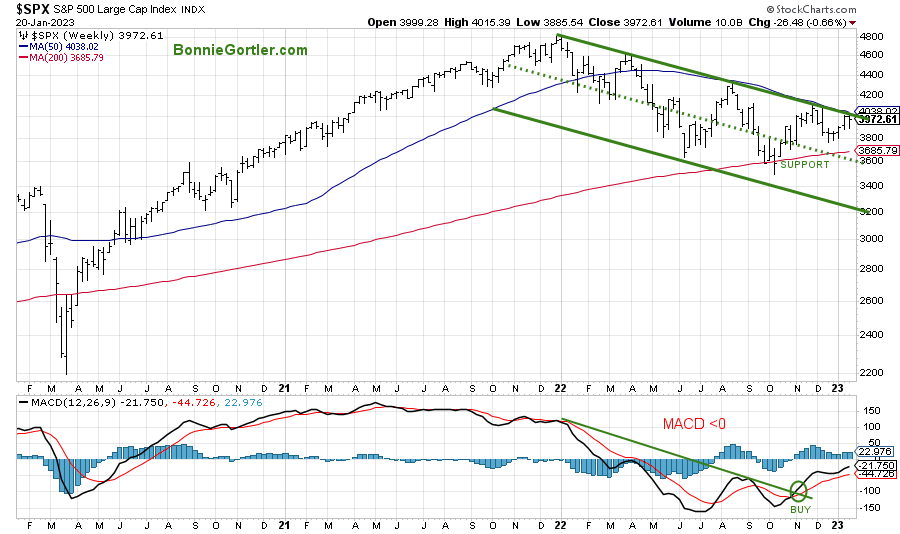
Figure 14: The S&P 500 Index ($SPX) Weekly (Top) and 12-26-9 MACD (Bottom)
 Source: Stockcharts.com
The top chart shows the weekly S&P 500 Index ($SPX) peaked in January 2022 and remains in a downtrend.
MACD (lower chart) is on a buy and has broken the 2022 downtrend, and rising, which is promising, but if MACD turns down now after not reaching 0, weakness is likely.
S&P 500 3600 remains a crucial support area (green dotted line) for the intermediate term that needs to hold above the mid-channel (green dotted line) or expect another leg down towards 3200. On the other hand, a close above 4100 would give higher upside projections.
U.S. Dollar weakness continues
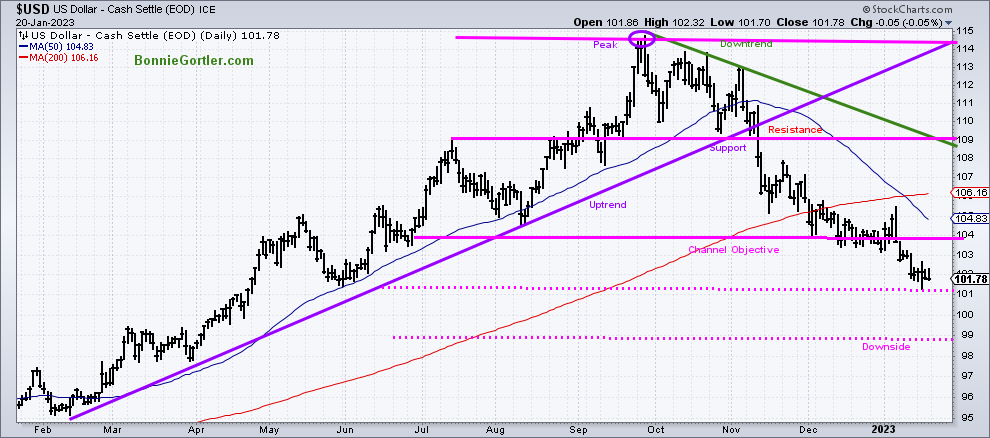
Figure 15: U.S. Dollar Daily
012023 DXY Daily
Source: Stockcharts.com
The U.S. dollar peaked in September 2022, starting a downtrend that remains in effect.
The U.S. dollar fell slightly by -0.16% and closed near the lower range for the week, supporting the international markets.
The downside objective remains at 98.80 (pink dotted line), and a close above 106.00 would negate the downside objective.
The continued weakness of the U.S. dollar bodes well for global and U.S. equities in the coming weeks. However, if the dollar stabilizes and rises, look for a pullback in the international markets.
Figure 16: Vanguard FTSE All-Word ex-US ETF Weekly and 12-26-9 MACD (Bottom)
012023 SMH Daily
Source: Stockcharts.com
The top chart is the Vanguard FTSE All-World ex-US ETF Weekly chart going back to 2019. VEU includes approximately 2,200 stocks of companies located in 46 countries, including developed and emerging markets worldwide.
VEU broke its downtrend in November 2022 (green circle) and continues higher, VEU rose 0.82% for the week, outperforming the S&P 500 again.
MACD remains on its November buy (green line) and rising,
Resistance is at 56.00 and 58.00. Support is at 50.00, and a close below 50 would break the uptrend and would be negative.
Follow up on XOP from the Market Update 1/13/23
Speculative Buying Opportunity – Positive Divergence Confirmed by a MACD buy
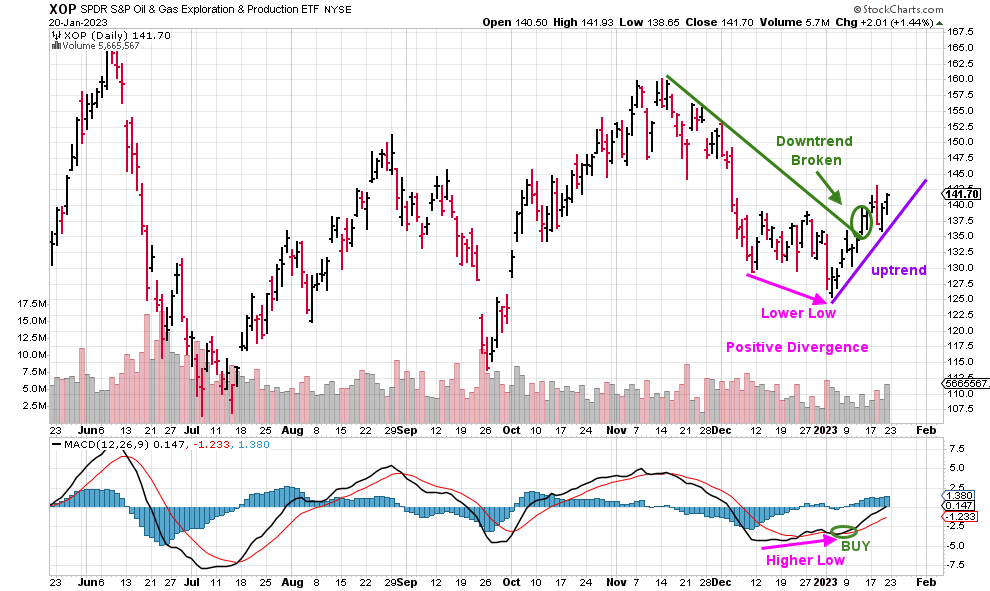
Figure 17: SPDR Oil and Gas Exploration (XOP) and 12-26-9 MACD (Bottom)
012023 XOP Daily
Source: Stockcharts.com
The XOP ETF provides exposure to US companies in oil and gas exploration & production space and rebalances quarterly.
Last week, a buying opportunity developed in SPDR Oil and Gas Exploration (XOP) and was up 1.88%
It’s bullish that the November 2021 downtrend broke (green line), combined with a MACD buy (green circle lower chart) from an oversold condition and positive divergence, one of my favorite buying patterns. Learn more about this pattern in my free Masterclass, Charting Strategies to Cut Risk and Trade with the Trend. Sign up here.
XOP closed above resistance at 140.00, with the first objective being 151.00. On the other hand, a close below 135.00 would break the uptrend and negate the trade.
Summing Up:
A mixed week for the major averages. However, tape action remains favorable, with a strong close on Friday. Nasdaq technical indicators continue to improve and appear ready to accelerate higher. Semiconductors and Technology strength implies higher prices ahead despite all the bad economic news. Earnings season continues this week and could add to the daily volatility. Key downside trendlines are close to being broken this week which could fuel the major averages higher. Watch for the leadership by Technology with an expansion of New Highs on both NYSE and Nasdaq for confirmation the rally is sustainable. Respect the bullish tape action and strength of the thrust to the upside implying higher prices ahead.
Remember to manage your risk, and your wealth will grow.
Let’s talk investing. You are invited to set up your Free 30-minute Wealth and Well-Being Strategy session by clicking here or emailing me at Bonnie@BonnieGortler.com. I would love to connect with you.
Disclaimer: Although the information is made with a sincere effort for accuracy, it is not guaranteed that the information provided is a statement of fact. Nor can we guarantee the results of following any of the recommendations made herein. Readers are encouraged to meet with their own advisors to consider the suitability of investments for their own particular situations and for determination of their own risk levels. Past performance does not guarantee any future results.


Create more wealth in your life
with these simple strategies.
As an added bonus you will also
receive BG’s Updates and Ezine

Discover how to quickly create more well-being in your life with these simple strategies.
As an added bonus you will also
receive BG’s Updates and Ezine

As an added bonus you will receive BG’s Updates and Ezine

All work listed on BonnieGortler.com is licensed under a Creative Commons Attribution - Noncommercial - No Derivative Works 3.0 Unported License.


Free Report:
Grow and Sustain Your Wealth
Discover how to grow your money with these easy, simple steps.

