

10 Simple Tips for Financial Well-Being
07/01/2026
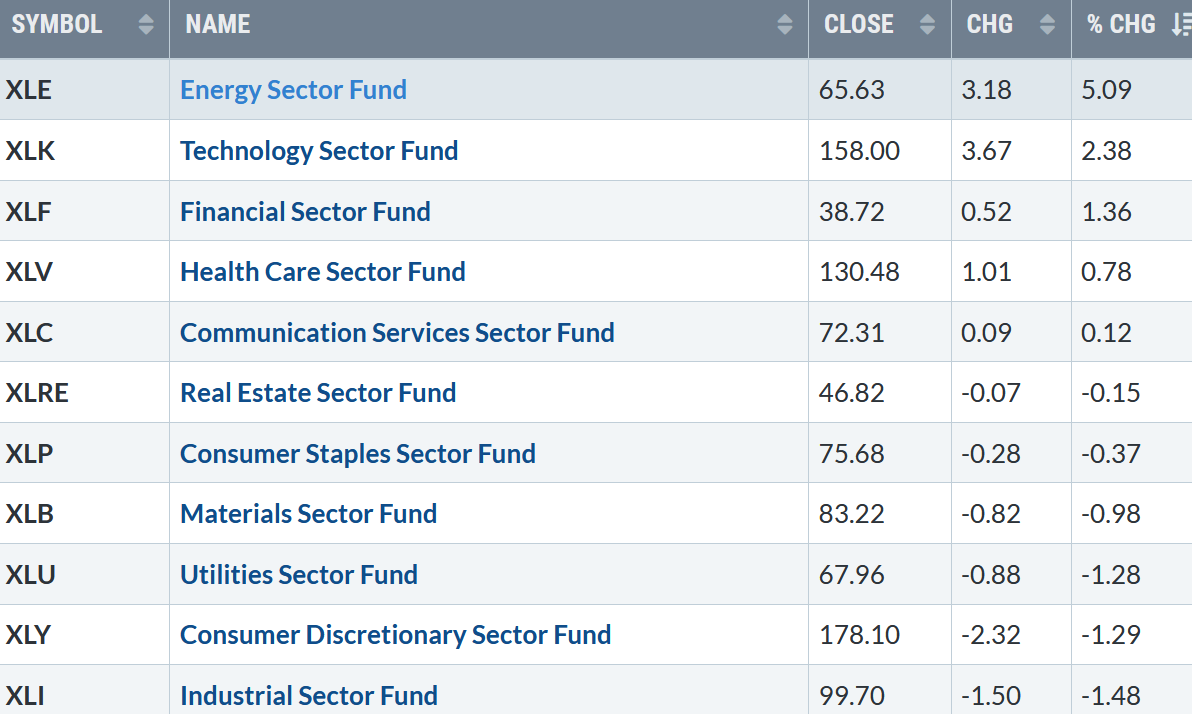
The volatile week closes on a positive note. Five of the eleven sectors rose, with three sectors performing better than the SPDR S&P 500 ETF Trust (SPY) +0.91%. Energy (XLE) and Technology (XLK) were the strongest while Consumer Discretionary (XLY) and the Industrial Sector was the weakest.
S&P SPDR Sector ETFs Performance Summary
1/21/22 – 1/28/22
012822 Week Sectors
Source: Stockcharts.com
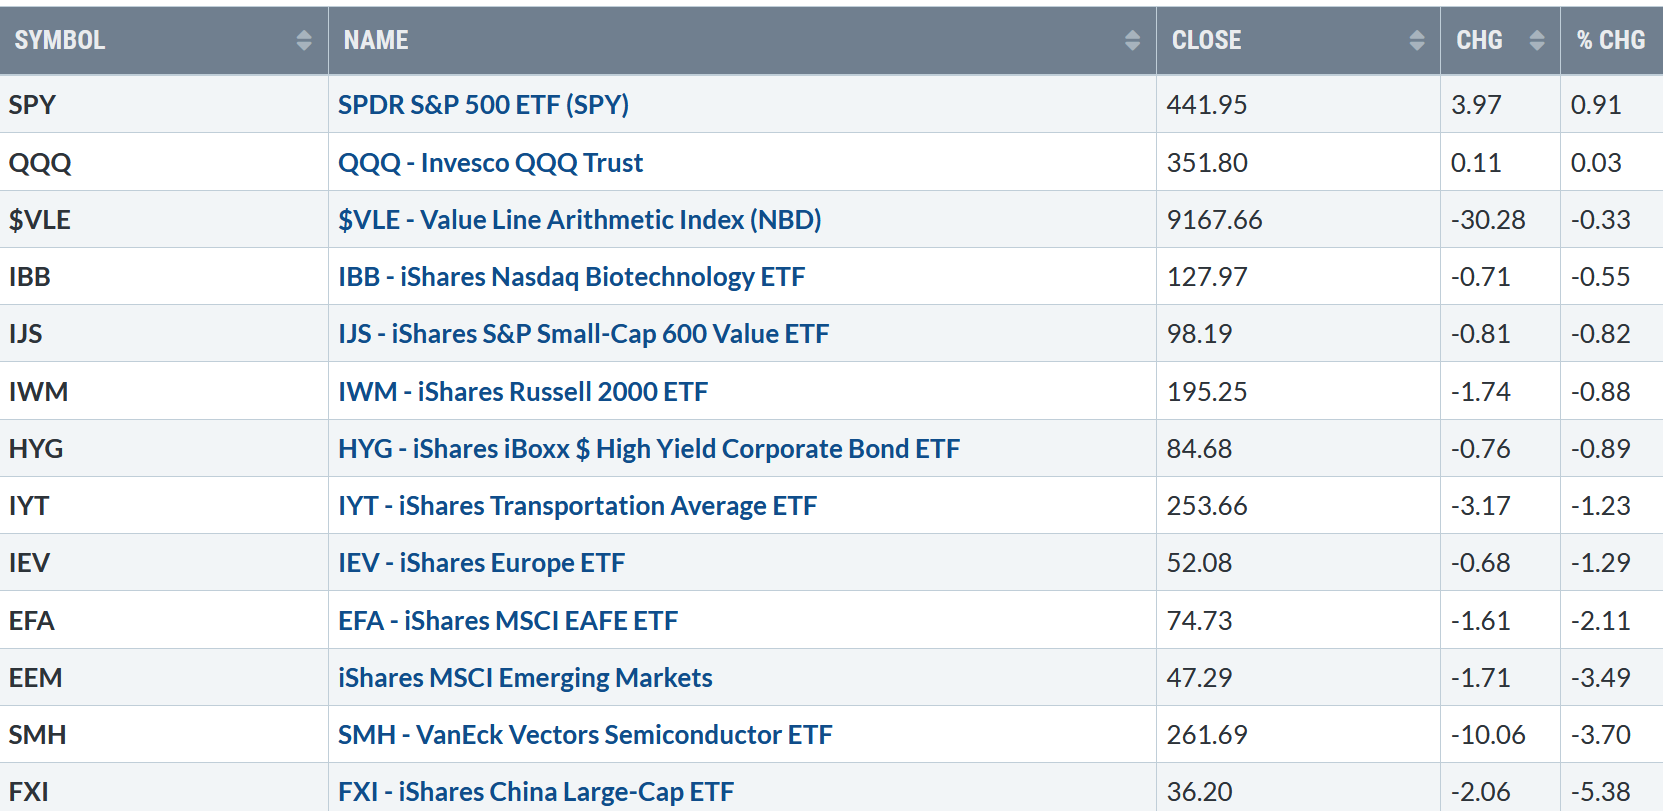
Figure 2: Bonnie’s Mix of ETFs To Monitor
Summary 1/21/21 – 1/28/22
12822 Week ETFs
Source: Stockcharts.com
International markets lost ground to the U.S. markets, weakening considerably as the dollar strengthened, closing at its highest level since November 2021. Small Caps and Semiconductors were lower for the week.
Dow gained +1.34% for the week. S&P 500 rose +0.77%, while Nasdaq avoided its fifth weekly loss in a row up +0.01%.
The Russell 2000 Index fell -0.98%, and the Value Line Arithmetic Index (a mix of approximately 1700 stocks) fell -0.33%. 10-Year U.S. Treasury yields finished higher for the week closing at 1.782% but stabilized, closing below the intraday high on 1/19 at 1.874%.
Weekly market breadth was negative and is concerning. The New York Stock Exchange Index (NYSE) had 1199 advances and 2419 declines. Nasdaq had 1576 advances and 3705 declines. There were 80 New Highs and 1153 New Lows on the NYSE and 119 New Highs, and 2359 New Lows on the Nasdaq.
Historically, unusually low optimism has been followed by above-average returns (gains).
Market Sentiment Implies Fridays Bounce Could Continue in the short-term
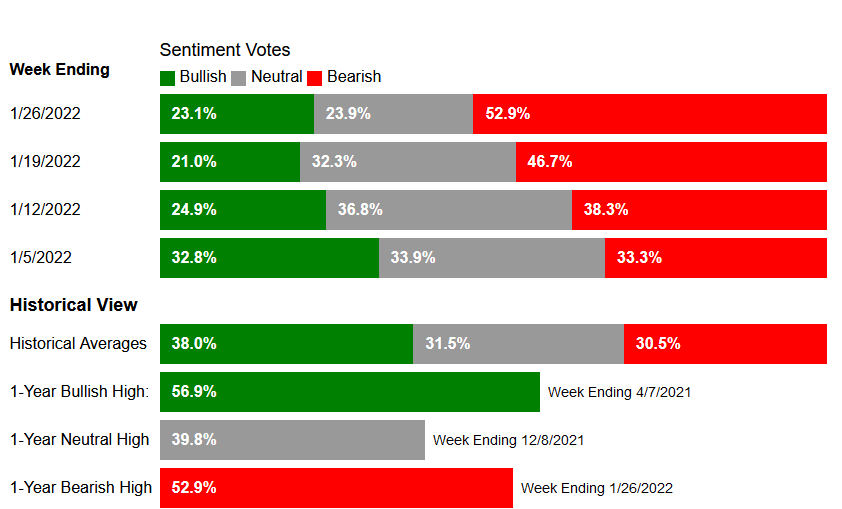
Figure 3: AAII Investor Sentiment Survey Week Ending 1/26/22
12622 Bullish Bearish Sentiment AAII
Source: aaii.com/sentimentsurvey
Market Sentiment (a contrary indicator) as of 1/26/22, based on the AAII Investor Sentiment Survey (AAII) Bulls increased 2.02% to 23.1%. Bearish sentiment rose 6.2 points to 52.9%, staying above the historical average of 30.5% posting the highest level of pessimism since April 11, 2013. Historically, unusually low optimism has been followed by above-average returns (gains).
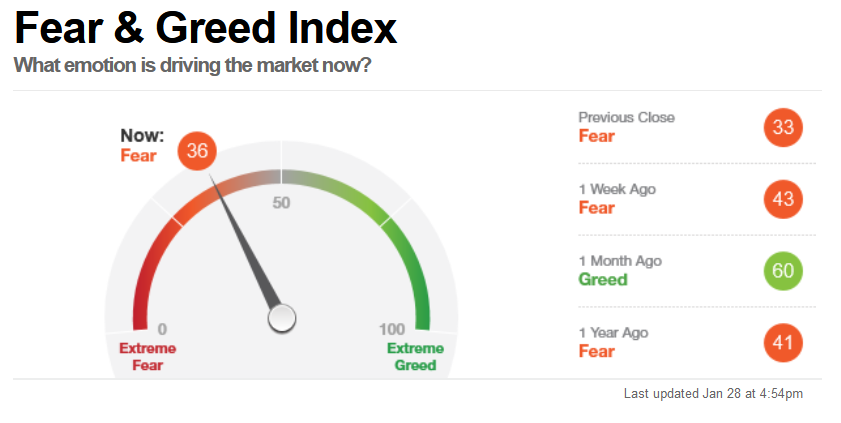
Figure 4: CNBC Fear & Greed Index 1/28/22
12822 Fear and Greed Index
Source CNN Business:
Last week the CNBC Fear and Greed Index (a contrary indicator) lingered in the fear zone, closing at 36, getting closer to extreme fear, which may or may not occur before the final market bottom.
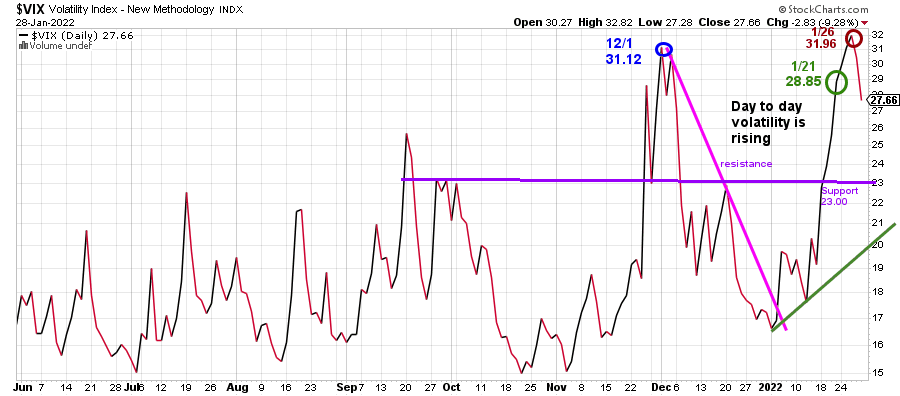
Figure 5: CBOE Volatility Index VIX
12822 VIX Daily
Source: Stockcharts.com
The CBOE Volatility Index ($VIX), a measure of fear, surpassed 28.85 on 1/21, which previously was the highest close since 12/1/21 at 31.12% (blue circle).
Volatility continued last week as the bottoming process was developing. On 1/26, VIX rose above 12/1 at 31.96 before falling Friday closing at 27.66.
Expect the day-to-day volatility to continue as long as VIX closes above support at 23.00.
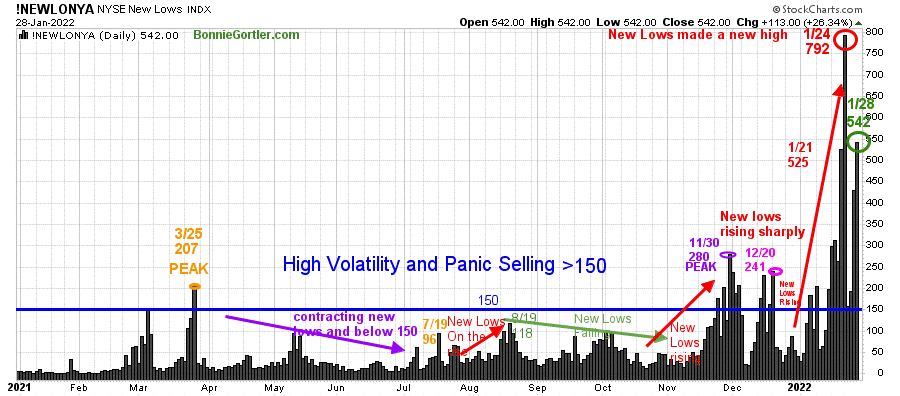
Figure 6: Daily New York Stock Exchange (NYSE) New Lows
12822 Daily NYSE New Lows
Source: Stockcharts.com
Watching New lows on the New York Stock Exchange is a simple technical tool that helps awareness about the immediate trend’s direction.
New lows warned of a potential sharp pullback, high volatility, and “panic selling” for most of 2022, closing above 150.
Learn more about the significance of New Lows in my book, Journey to Wealth, published on Amazon. Here is an excerpt, If the New Lows are above 50, it is an alert or warning of possible market weakness or a change in market tone. Be aware it’s a good idea to make sure you are happy and comfortable with your portfolio. It is best not to have more volatile investments than you can handle where you feel uncomfortable. If the selling continues, you could have serious losses if the market falls further. When new lows are above 150, the market is negative, higher risk, selling is taking place. Sometimes it could be severe, and sometimes on a very nasty day, you can have “panic selling,” and big wild swings (high volatility) to the downside may occur.
Last week, New Lows expanded, making a new peak on 1/24 of 792 (red circle), above the previous new low of 525 on 1/21, closing on 1/28 at 542 (green circle), not yet in a safe, low-risk zone.
As long as New Lows remain above 150, caution is necessary, implying risk is high. On the other hand, if News Lows on the NYSE begin to contract below 150 and ultimately between 25 and 50, it would imply lower risk and that a short-term bottom has occurred.
For now, the risk is high, and expect elevated intraday volatility.
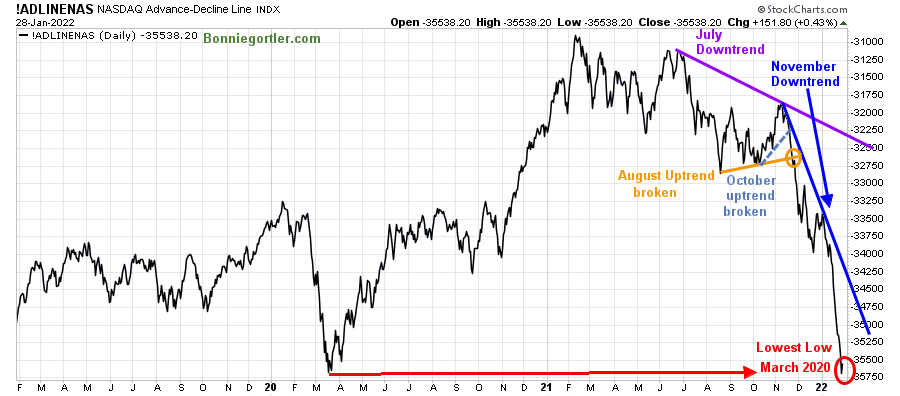
Figure 7: Daily Nasdaq Advance-Decline Line
12822 Nasdaq Daily AD Line
Source: Stockcharts.com
Market breadth continues to be weak in 2022. The daily Nasdaq AD-Line broke the June downtrend (purple line), peaking in November 2021, and then turned down, breaking the October uptrend (blue dotted line). Then the August uptrend (orange line) was broken, an advanced warning that a decline was forthcoming.
The daily Ad-Line has accelerated down, continuing to make new lows (red circle), with no clear sign yet of a bottom, only a few upticks that have failed.
For a sustainable rally, the AD-Line needs to break the November downtrend (blue line).
For now, more time is necessary to imply a safe bottom has formed.
Nasdaq is oversold from where tradeable rallies occur
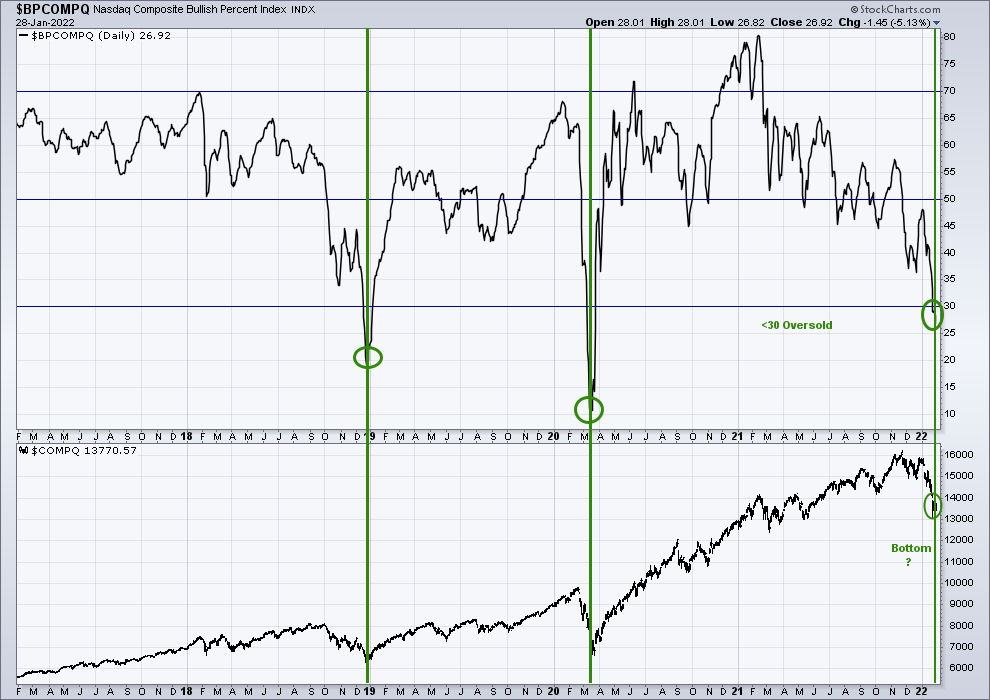
Figure 8: Daily Nasdaq Composite Bullish Consensus
12822 Nasdaq Bullish Consensus
In its most basic form, the Bullish Percent Index (BPI) favors the bulls when above 50% and the bears when below 50%. The bulls are in control when BPI is over 50%.
BPI is considered overbought when above 70% and oversold when below 30%.
The Nasdaq composite is at its lowest reading on Bullish Consensus (top chart) since March of 2020 (middle green circle), closing at 26.92%.
When the Nasdaq (bottom chart) rises, there is plenty of room for the upside.
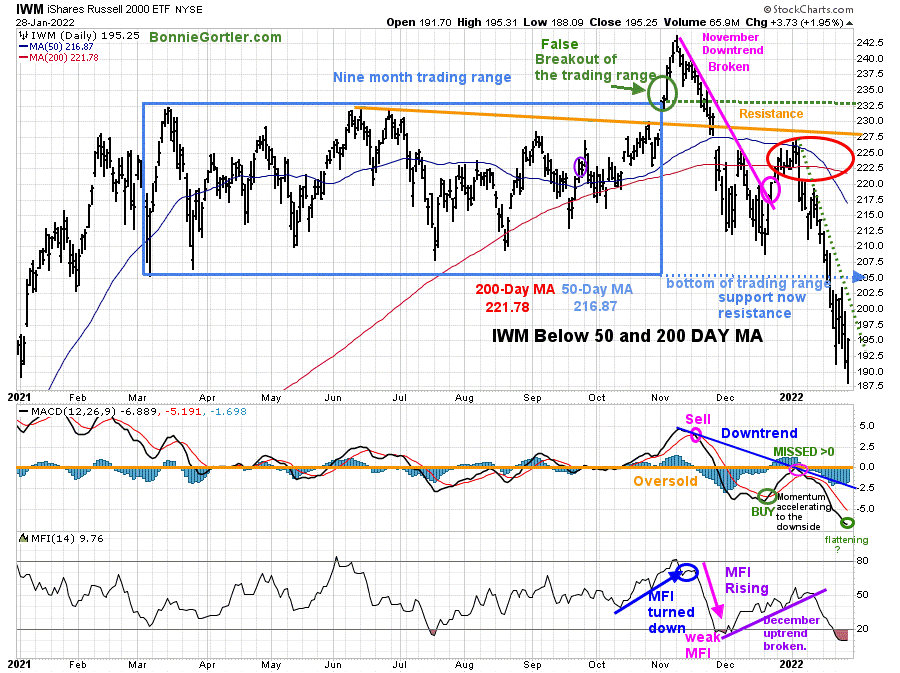
Figure 9: Daily iShares Russell 2000 (IWM) Price (Top) and 12-26-9 MACD (Middle and Money Flow (Bottom)
12822 IWM Daily
Source: Stockcharts.com
The top portion of the chart is the daily iShares Russell 2000 Index ETF (IWM), the benchmark for small-cap stocks, with a 50-Day Moving Average (MA) (blue line) and 200-Day Moving Average (MA), that traders watch and use to define trends. A false breakout occurred in November in IWM after being in a nine-month trading range. IWM broke the November downtrend but could not get above resistance and turned sharply lower quickly.
IWM remains below its 50 and 200-Day Moving Average (red circle), favoring the bears. Once IWM broke below support at 205.00, the decline accelerated as mentioned on the market update 01/14/21.
IWM was down -0.88% with an intraday low at 188.09 on 1/28, falling to its lowest level since 1/4/21. Its bullish IWM recovered all of its loss closings near its high of the day +1.95%.
On the other hand, the January downtrend remains (green dotted line). IWM continues to make lower lows. No pattern of higher highs has developed. Learn more about lower lows in my ecourse.
Short term downside objective remains at 178.00. Support is 187.00. It’s positive the 60-minute chart (not shown has a bullish double bottom positive divergence along with a turn up in money flow. On the other hand, if Friday’s lows are violated, the stops will be triggered, and the decline will resume.
Resistance is 200.00, 205.00, and 210.00.
MACD (middle chart) was too weak to generate a sell, just missing getting above 0 in early January, or MACD would be on a sell. MACD showed its first sign of downside momentum slowing after accelerating to the downside in January.
Money Flow (lower chart) continued to fall after the December uptrend broke and is now oversold and also started to flatten.
Summing up:
IWM made a bullish reversal closed near its high Friday, the first sign the decline in IWM may be coming to an end. Downside momentum in MACD and Money Flow started to flatten. It would be positive if MACD begins to rise, generates a buy signal, and breaks the November downtrend on increasing Money Flow.
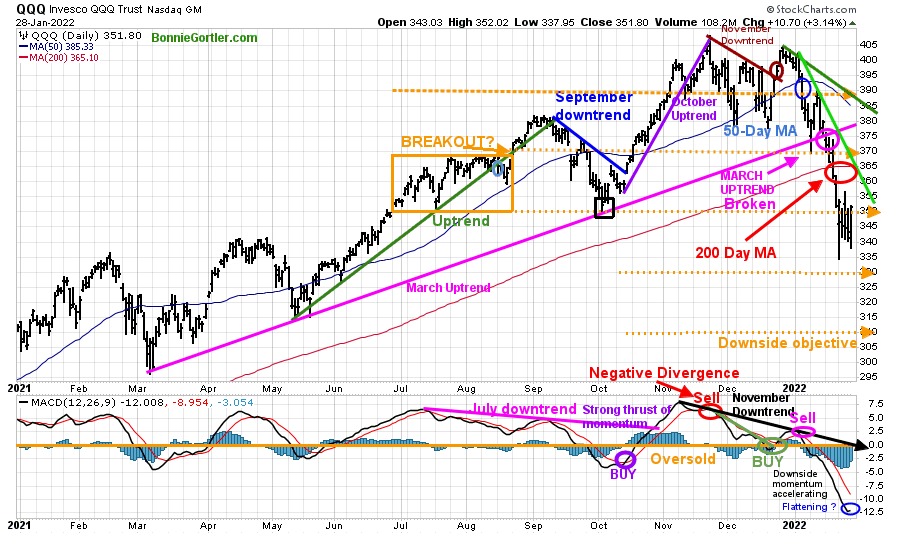
Figure 10: Daily Invesco QQQ Trust (QQQ) Price (Top), and 12-26-9 MACD (Bottom)
12822 QQQ Daily
Source: Stockcharts.com
The chart shows the daily Invesco QQQ, an exchange-traded fund based on the Nasdaq 100 Index with its 50-Day Moving Average and 200-Day Moving Average. In June, QQQ was in a trading range (orange rectangle), followed by a breakout that failed in late September.
After breaking the short-term downtrend (blue line), QQQ rallied in October and continued to climb in November, barely missing its upside target of 410.00 on 11/22 with a high of 408.71 before reversing lower. In December, QQQ failed to make a new high and broke down below the first support at 390.00 and below the 50-Day Moving Average (blue circle).
QQQ trend shifted to down after closing below the March uptrend (pink line). QQQ penetrated key support (mentioned in the update 1/14/22) at 370.00 that needed to hold and then accelerated lower on heavy volume.
A volatile week for QQQ after testing Monday 1/26 low 334.15 on Friday successfully closing at 351.80 up +. 03% for the week near the highs of the day but below the 200-Day Moving Average (red circle).
Resistance is at 355.00, 360.00, followed by 370.00. Support is at 350.00 and 340.00. The downside objective missed last week remains at 330.00, followed by 310.00.
The lower chart is MACD (12, 26, 9), a measure of momentum. MACD flipped to a sell the first week of January (pink circle) remains in a downtrend (black line). Like IWM, QQQ has begun to flatten a sign of diminishing momentum. Time will tell if it will be temporary or it will start to rise, which would be positive.
Intermediate-term Remains Negative
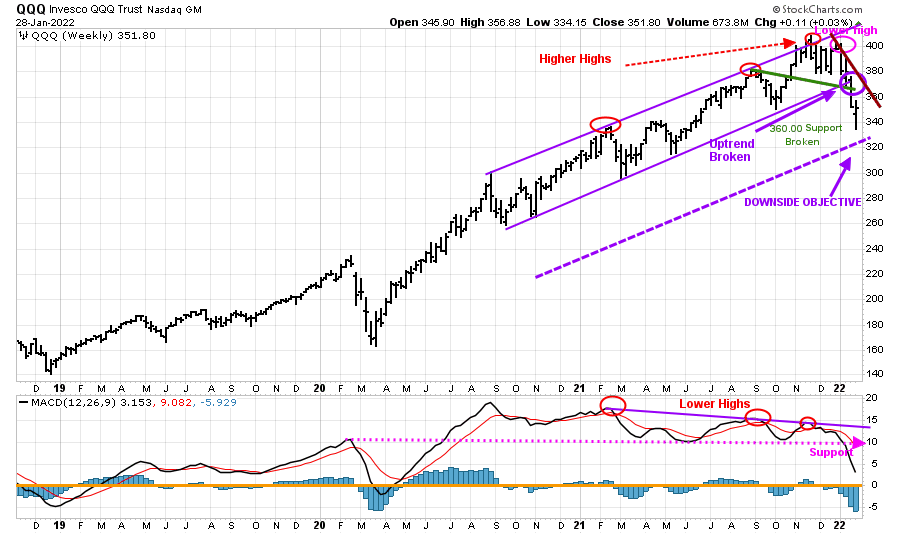
Figure 11: Weekly Invesco QQQ Trust (QQQ) Price (Top), and 12-26-9 MACD (Bottom)
Source: Stockcharts.com
The top chart shows the weekly Invesco QQQ Trust (QQQ) making higher highs peaking in November (red circles) but failed to make a new high in December and then turned down.
The previous week the intermediate uptrend since September 2020 was broken (green line), and the intermediate trend shifted to down. QQQ fell below support at 370.00, and selling accelerated; the downside objective remains 320.00 (lower channel).
MACD (lower chart) remains on a sell, making lower highs, weakening momentum, forming a negative divergence (price high unconfirmed by MACD, made lower highs). MACD remains below support held since February 2020 (pink dotted line), implying that underlying momentum is weak and high risk. With the decline, MACD fell sharply but is not yet oversold, below 0.
More time is needed for a safe intermediate bottom to develop and be sustainable.
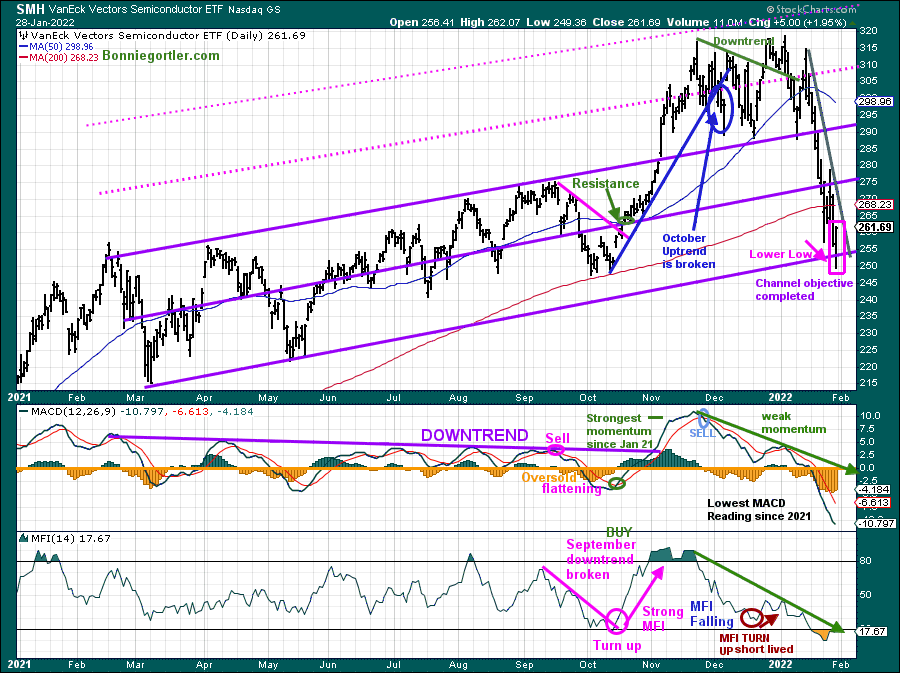
Figure 12: Van Eck Semiconductors (SMH) Daily Price (Top), 12-26-9 MACD (Middle) and, Money Flow (Bottom)
12822 SMH Daily
Source: Stockcharts.com
Semiconductors (SMH) broke through resistance in October (green arrow) and surged higher until late November. However, SMH stalled in November, and the October uptrend was violated (blue line), followed by a trading range that broke down the last two weeks. After support was broken, below 290.00 and 275.00 in January, SMH fell sharply.
SMH closed down -3.70 % for the week at 261.69. On Friday, SMH made a lower low than Monday’s low, touching the lower channel, and then reversed sharply to finish near the day’s highs, a positive reversal going into the new week.
Resistance is at 275.00, followed by 290.00. Support is at 250.00, followed by 235.00, the next downside channel objective if the Fridays rally falters.
MACD (middle chart) remains on a sell, falling, extremely oversold below 0. No sign of flattening yet. However, If SMH stabilizes and moves higher, MACD will flatten quickly and likely rise, generating a buy signal.
Money flow (lower chart) remains in a downtrend (green line) and more oversold than in October. A turn up in Money Flow and MACD generating a buy together would be a positive sign of a potential rally in SMH.
For now, SMH remains risky with momentum falling, and SMH is weaker than QQQ based on relative strength.
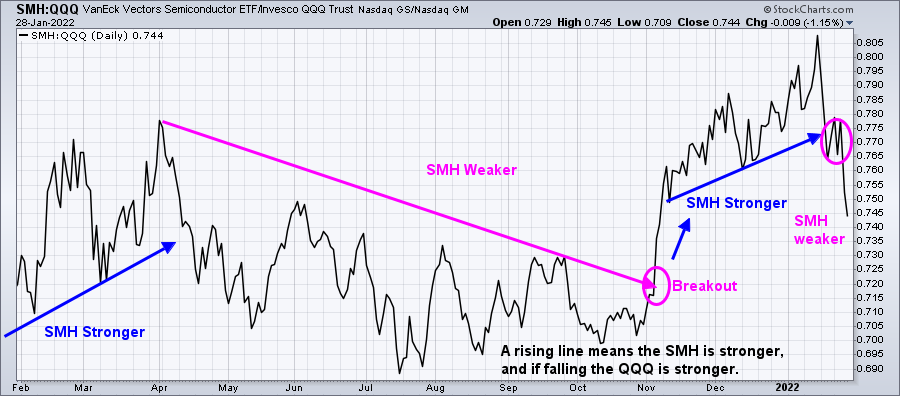
Figure 13: Relative Strength Ratio Daily Van Eck Semiconductor ETF(SMH)/Invesco QQQ Trust (QQQ) SMH/QQQ
12822 SMh QQQ Relative Strength Daily
Source: Stockcharts.com
A rising line means the SMH is stronger, and if falling, the QQQ is stronger.
Semiconductors were stronger than QQQ early in late 2020 to 2021 (rising line on left. SMH peaked in relative strength in April 2021. The ratio SMH/QQQ trended down, making a relative strength low in July. Several attempts occurred to break the April downtrend, but each time SMH didn’t have enough momentum until breaking out on November 21.
SMH’s relative strength compared to QQQ weakened in January and remained weaker than QQQ.
I would like to see SMH outperform QQQ to signal strength in the near term.
NYSE AD-Line breaks below support.
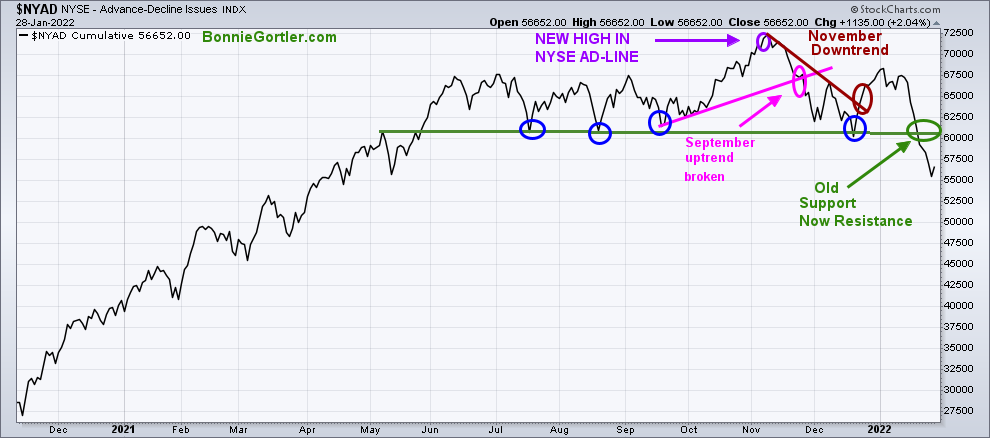
Figure 14: New York Stock Exchange AD-Line
12822 NYSE Daily AD Line
Source: Stockcharts.com
The NYSE A/D line made a new high on 11/8/21. In December, the AD line broke the November downtrend (brown line) but did not make a new high warning of a pending correction forthcoming in the NYSE. The lows made in July, August, September, and December (blue circles) did not hold, and weak breadth in the NYSE continues. The old support area is now new resistance.
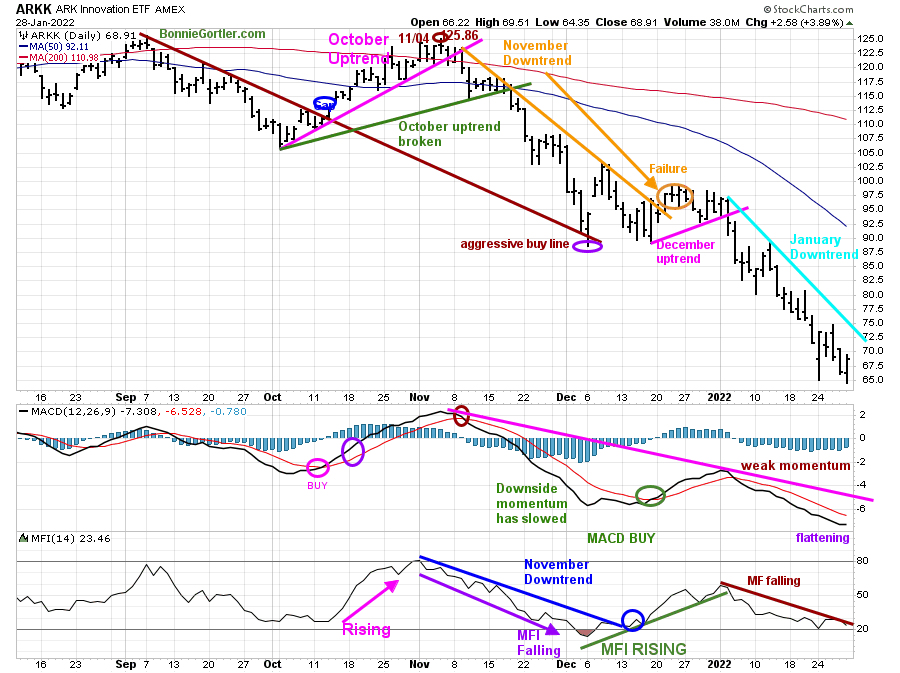
Figure 15: ARKK Daily
12822 ARKK Daily
Source: Stockcharts.com
ARKK is an actively managed ETF by Cathie Wood that seeks long-term growth and is highly volatile.
ARKK broke its September short-term downtrend (brown line) in October and gapped up (blue circle), followed by a failed rally peaking at 125.86 on 11/04. Once ARKK fell below support at 94.00, it broke through the December uptrend (pink line) and accelerated lower.
The January downtrend remains. ARKK fell again last week down -3.65%%, closing at 68.91. ARKK is worth watching to see if ARKK stabilizes and begins to rise, having successive positive closes as a sign that traders are stepping into buying growth stocks.
Resistance is at 71.00 followed by 75.00 and 90.00. Support is at 64.00.
MACD remains on a buy because MACD never made it above 0, implying weak momentum.
Money flow (lower chart) continues to fall in 2022.
ARKK remains high-risk volatile, with the bears in control. However, when it turns for real, it will be sharp and quick, so don’t get caught short.
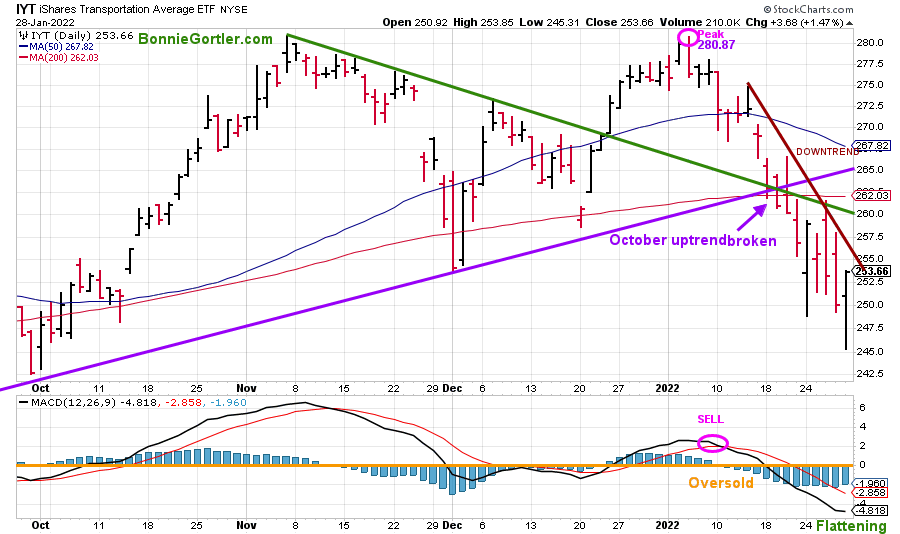
Figure 16: Ishares Transportation Average (IYT)
12822 IYT Daily
Source: Stockcharts.com
The Transportation Average (IYT) peaked on 1/5/22 at 280.87 and turned sharply lower, now in a downtrend.
Last week IYT fell -1.47%, closing at 253.66, well off their low of 245.31 after breaking intraday support at 252, reversing to close near Friday’s high, a positive sign a short-term bottom has been made.
A close below 245.00 would imply more downside and a test of the October 2021 low.
Summing Up:
Intraday volatility is likely to continue. Downside momentum finally slowed as the major averages, and many stocks reversed off of their low and closed near their highs of the day. The bulls come out of hiding that the worst may be over in the short term, deciding prices had fallen enough. Small Caps, Semiconductors, Technology, and Transports all closed at their highs, a promising sign the worst has been seen in the short-term. Watch for improvement in market breadth on both the NYSE and Nasdaq. Market sentiment continues to show fear helping the bullish case. Short-term momentum oscillators remain very oversold and ripe for a rally.
Remember to manage your risk, and your wealth will grow.
If you liked this article, you would love my Free Charting Master Class. Get it here:
See more charts in my FB group Wealth Through Market Charts.
I would love to hear from you. If you have any questions or comments or would like to talk about the market, click here.
Disclaimer: Although the information is made with a sincere effort for accuracy, it is not guaranteed that the information provided is a statement of fact. Nor can we guarantee the results of following any of the recommendations made herein. Readers are encouraged to meet with their own advisors to consider the suitability of investments for their own particular situations and for determination of their own risk levels. Past performance does not guarantee any future results.


Create more wealth in your life
with these simple strategies.
As an added bonus you will also
receive BG’s Updates and Ezine

Discover how to quickly create more well-being in your life with these simple strategies.
As an added bonus you will also
receive BG’s Updates and Ezine

As an added bonus you will receive BG’s Updates and Ezine

All work listed on BonnieGortler.com is licensed under a Creative Commons Attribution - Noncommercial - No Derivative Works 3.0 Unported License.


Free Report:
Grow and Sustain Your Wealth
Discover how to grow your money with these easy, simple steps.

