

10 Simple Tips for Financial Well-Being
07/01/2026
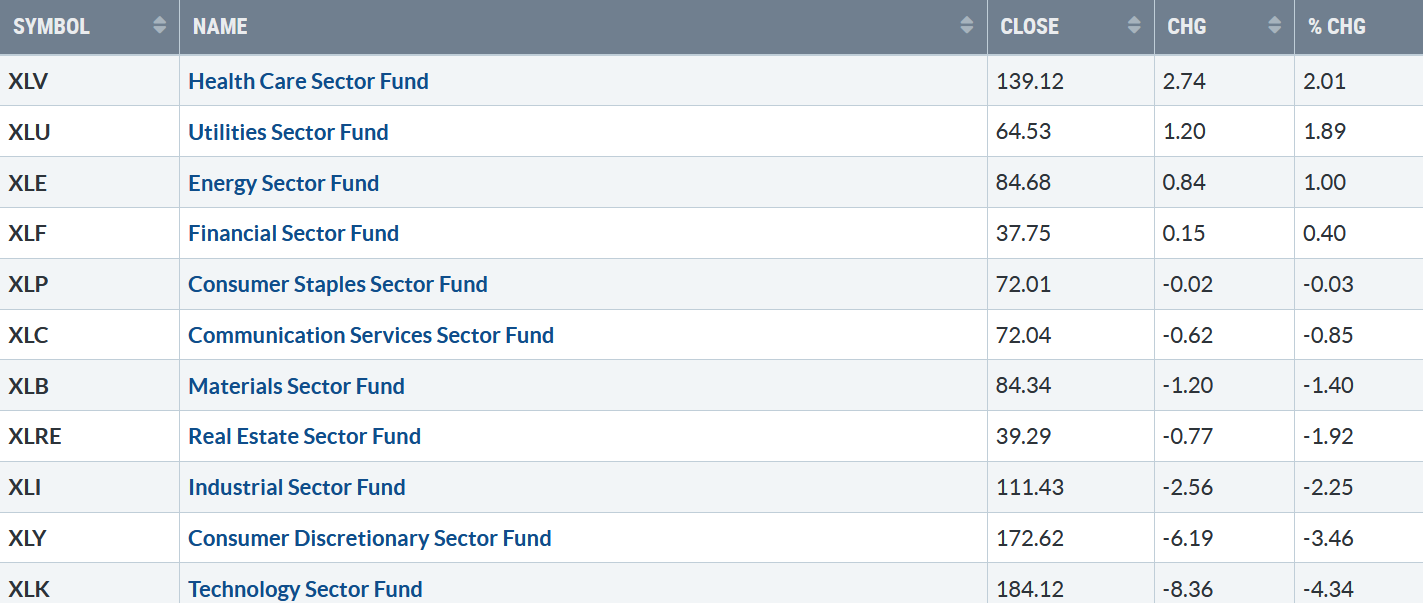
A shaky start to 2024. Only four of eleven S&P SPDR sectors were higher last week. Health Care (XLV) and Utilities (XLU) were the best sectors, while Consumer Discretionary (XLY) and Technology (XLK) were the weakest. The SPDR S&P 500 ETF Trust (SPY) was down -1.55%.
S&P SPDR Sector ETFs Performance Summary 12/29/23 – 1/05/24
010524 SPDR Sectors
Source: Stockcharts.com
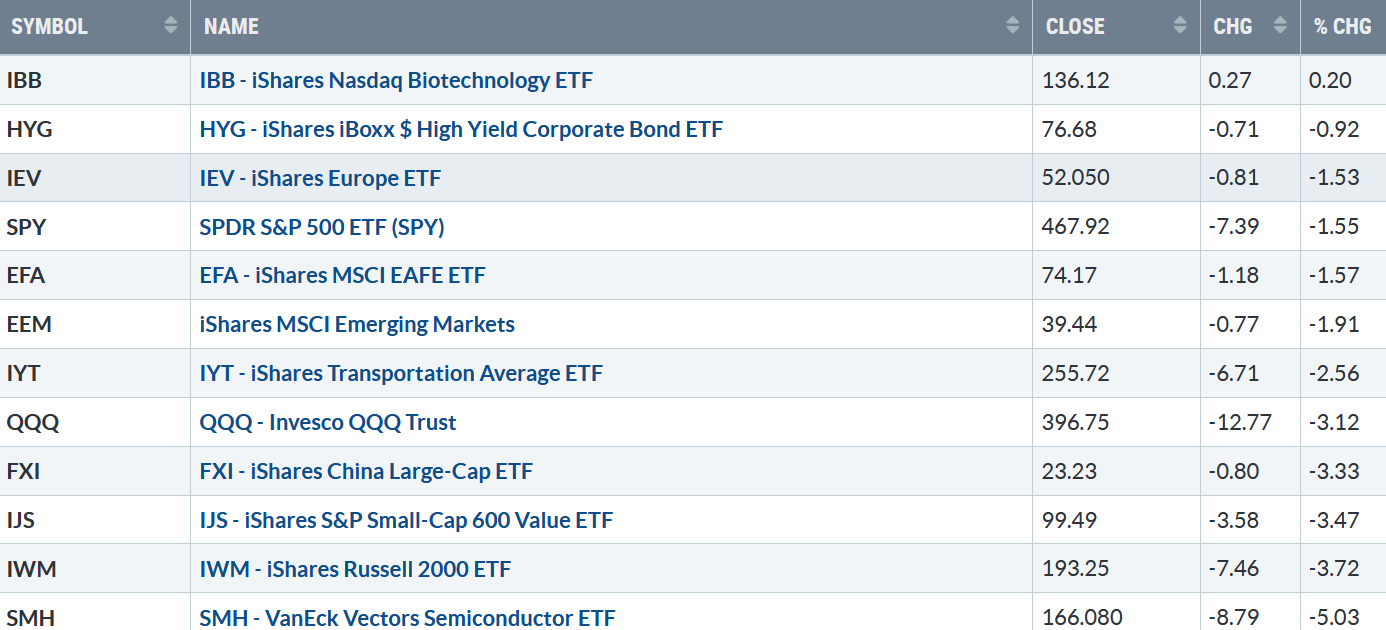
Figure 2: Bonnie’s ETFs Watch List Performance Summary 12/29/23 – 1/05/24
040524 Week ETFs
Source: Stockcharts.com
Profit taking took place both in international and U.S markets. Biotechnology rose slightly, while Semiconductors, Small Cap Growth, and Small Value fell sharply.
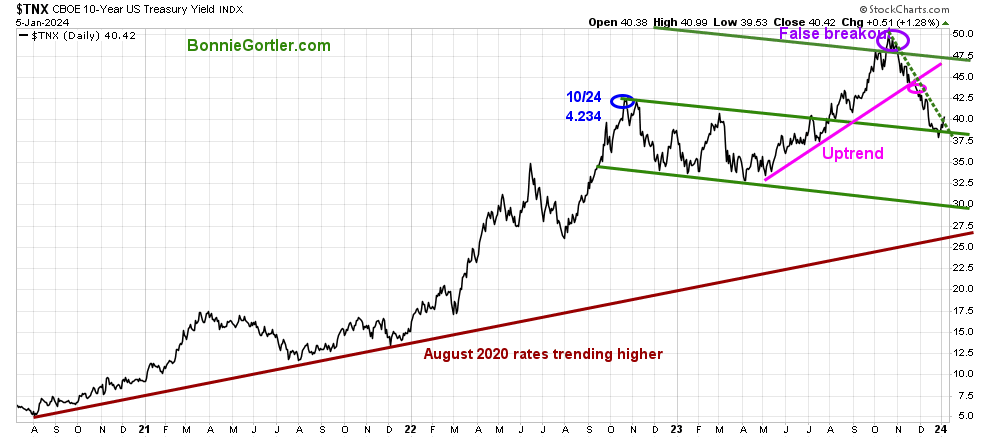
Figure 3: UST 10YR Bond Yields Daily
010524 UST 10 Yr Bond Yields Daily
Source: Stockcharts.com
The 10-year U.S. Treasury yields rose last week, closing at 4.042%, barely penetrating support at the middle channel (in green), turning up, and closing at the downtrend line (green dotted) from October. Rising yields could lead to more downside pressure in equities. On the other hand, falling yields could spark a short-term rally.
The major market averages fell after nine weeks of gains. The Dow fell -0.59%, the S&P 500 went down -1.52.%, and the Nasdaq dropped -3.25%. The Russell 2000 Index was weakest, down -3.75%.
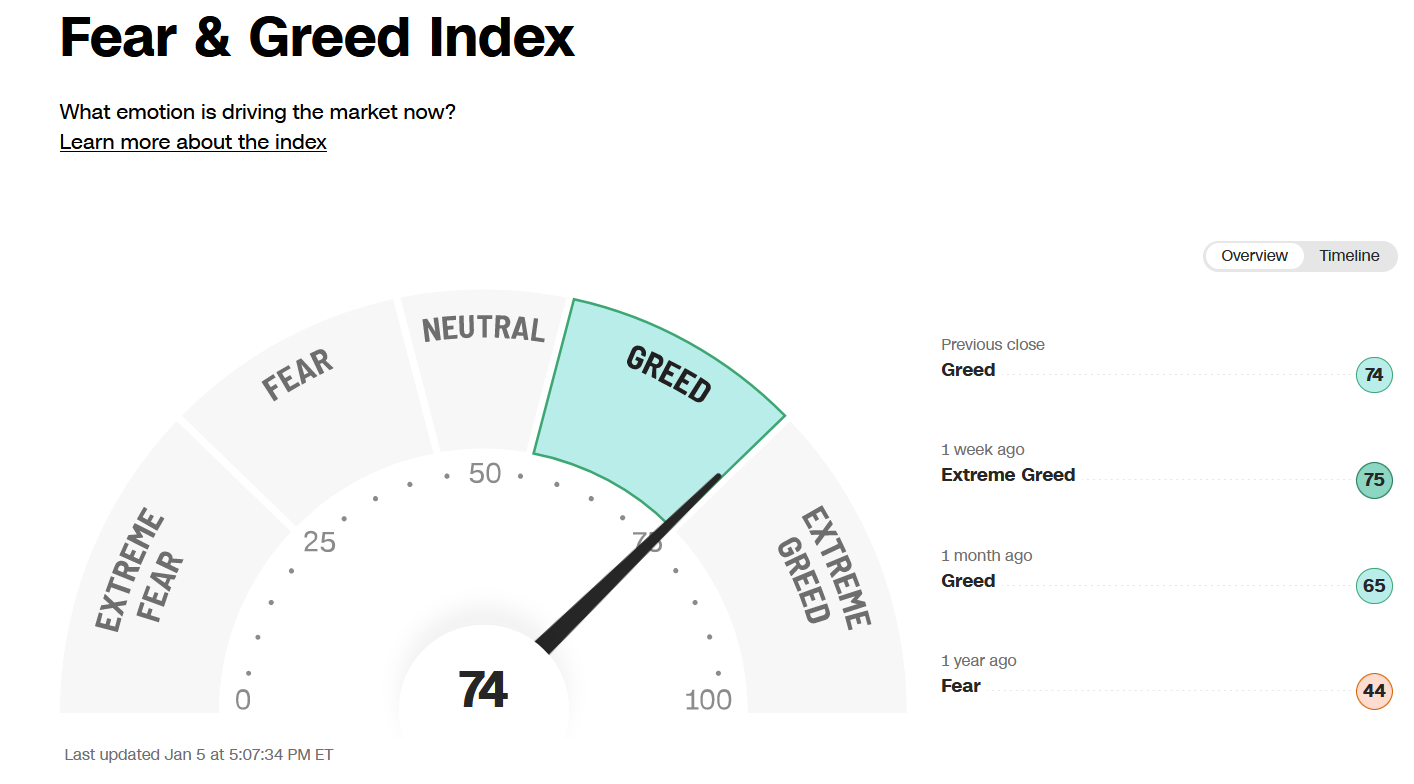
Figure 4: Fear & Greed Index
010524 CNN Fear and Greed Index
Source. CNN.com
Investor sentiment based on the Fear and Greed Index (a contrarian index) measures the market’s mood. The Fear and Greed Index down ticked from extreme greed to close at 74, but it still shows greed.
Are you interested in more knowledge about the stock market? Learn how to implement a powerful wealth-building mindset and simple, reliable strategies to help you grow your wealth in my eCourse Wealth Through Investing Made Simple. Learn more here.
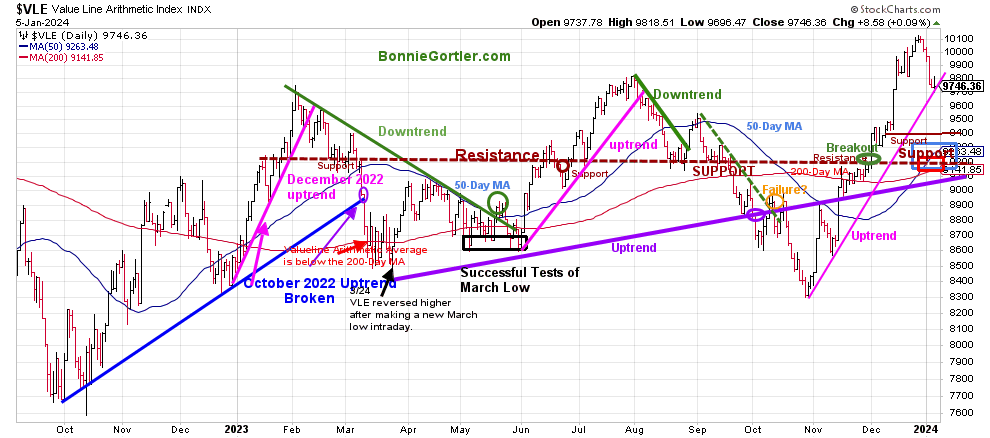
Figure 5: Value Line Arithmetic Average
010524 VLE Daily
Source: Stockcharts.com
The Value Line Arithmetic Index ($VLE) is a mix of approximately 1700 stocks. VLE broke the October 2022 uptrend in early March 2023 (blue line), and April, May, and June successfully tested the March low and ultimately made a new low in October 2023.
The daily trend of VLE remains up. VLE closed at 9746.36, down -2.71% last week, remaining above the 50-day MA, which is rising (blue rectangle), and the 200-day MA (red rectangle), a sign of underlying strength.
Support at 9800 broke last week. The following support is 9700, 9400, 9200, and 9000. Resistance remains at 10200.
It would be positive if VLE held support at 9700 and then turned up, surpassing this week’s high of 10040.56.
Do you want to go deeper into charting? Learn more in the comfort of your home today with my Free 33-minute Training, Charting Strategies to Cut Risk and Trade with the Trend. Sign up here.
Market breadth narrowed
Weekly market breadth was negative on the New York Stock Exchange Index (NYSE) and the Nasdaq. The NYSE had 1080 advances and 1854 declines, with 137 new highs and 32 new lows. There were 1539 advances and 3096 declines on the Nasdaq, with 213 new highs and 207 new lows.
If you want to go more in-depth with charts, I invite you to join my Free Facebook group, Wealth Through Market Charts.
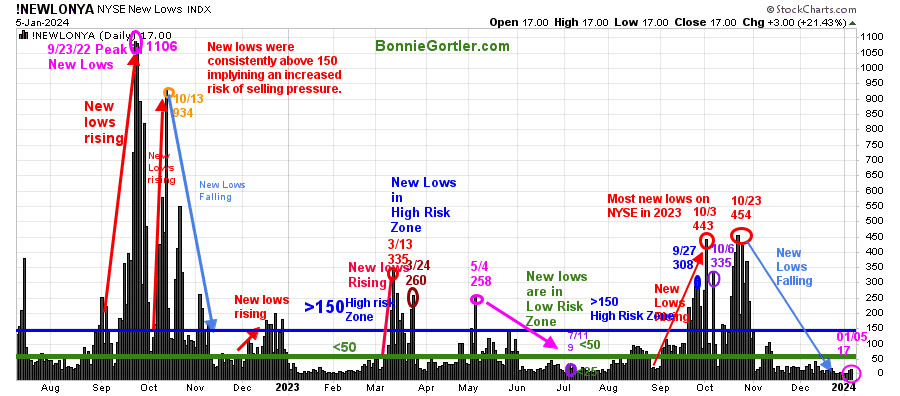
Figure 6: Daily New York Stock Exchange (NYSE) New Lows
010524 NYSE New Lows Daily
Source: Stockcharts.com
Watching New Lows on the New York Stock Exchange is a simple technical tool that helps awareness of the immediate trend’s direction. New lows warned of a potential sharp pullback, high volatility, and “panic selling” for most of 2022, closing above 150. The peak reading was 9/23/22 when New Lows made a new high of 1106 (pink circle), and New Lows expanded to their highest level in 2023 on 3/13/23 (red circle) to 335.
New Lows increased last September (red arrow on the right) toward the high-risk zone greater than 150, peaking at 443 on 10/3, the highest reading since October 2022.
New lows had stopped accelerating in early October. However, the decline was not complete until the end of the month as New Lows made only a slight new high, peaking at 454 (red circle) on 10/23/23.
Last week, New lows on the NYSE rose slightly, closing at 17 (pink circle) and remaining in the lowest risk zone below 25. It would remain positive and imply low risk if New Lows stay between 25 and 50. On the other hand, an increase above 150 would be a warning sign of a market correction. However, New Lows will likely take at least a few weeks to expand to greater than 150 due to the strength of the advance.
Learn more about the significance of New Lows in my book, Journey to Wealth, published on Amazon. If you would like a preview, get a free chapter here.
Downside Pressure on Small Caps After Previous Strength
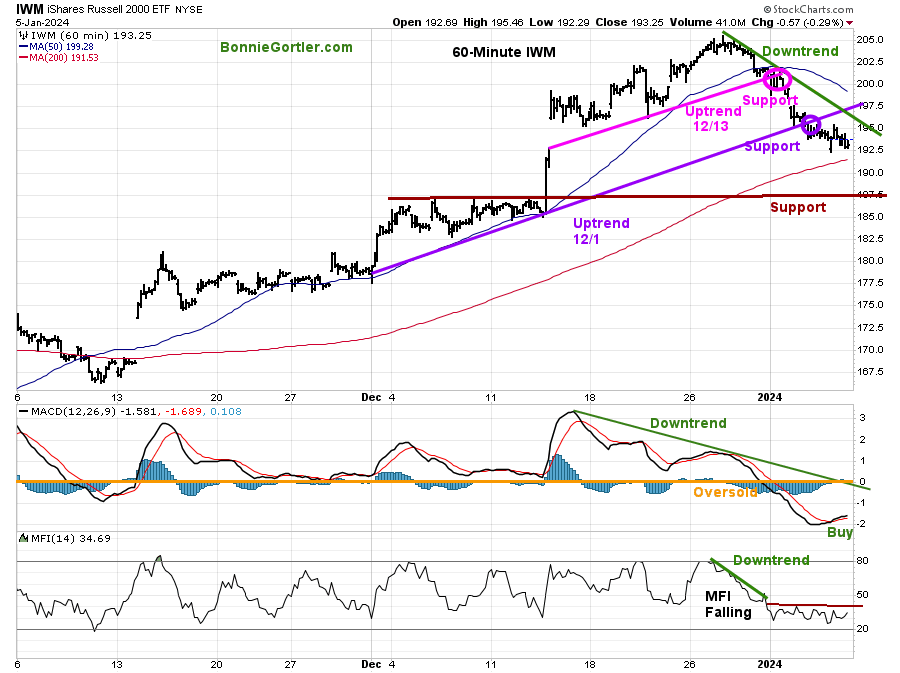
Figure 7: 60 Minute iShares Russell 2000 (IWM) Price (Top) and 12-26-9 MACD (Middle) and Money Flow (Bottom)
010524 IWM 60-minute
Source: Stockcharts.com
The top chart is the 60-minute iShares Russell 2000 Index ETF (IWM), with a high made on December 28 at 205.49.
Two hourly uptrends in IWM, 12/1 and 12/13 (purple and pink circle), were broken last week. Hourly support broke at 200.00, 196.00, and 193.00 intraday but closed slightly above 193.25.
MACD is on a buy, below 0 (orange line), and rising but remains in a downtrend (green line).
Money flow is rising, but not yet showing significant buying now.
Despite the MACD buy, it’s not very convincing that the short-term pullback is complete, with both IWM and MACD in a downtrend. Keep an eye on IWM to see if the 12/27 downtrend and MACD also break its downtrend. If so, it would imply the retracement is over, and another rally will begin. However, if the downtrends are not broken, it would imply a resumption of the decline.
Figure 8: Daily iShares Russell 2000 (IWM) Price (Top) and 12-26-9 MACD (Middle and Money Flow (Bottom)

010524 SPY Daily
Source: Stockcharts.com
The top chart is the daily iShares Russell 2000 Index ETF (IWM), the benchmark for small-cap stocks, with a 50-Day Moving Average (MA) (blue line) and 200-Day Moving Average (MA) (red line) that traders watch and use to define trends. (IWM closed above both).
IWM fell sharply after its recent run-up, closing at 193.25, down -3.72% last week but remaining above the 50-day MA and the 200-day MA (blue rectangle), both rising, which is positive.
Support is 193.00, 187.50, 182.50, and 177.50. Resistance is at 197.50, 200.00, and 205.00.
MACD (middle chart) is on a sell, above 0, falling, and not yet oversold after reaching the highest momentum reading in 2023, implying underlying strength and the likelihood another rally will follow the pullback.
Money Flow (lower chart) is falling, breaking the uptrend (purple circle) from October closer to 20, oversold, an area where rising money flow may begin again.
Look for a reflex rally this week toward first resistance at 197.50 and potentially more if IWM closes for two days above Friday’s high at 195.46.
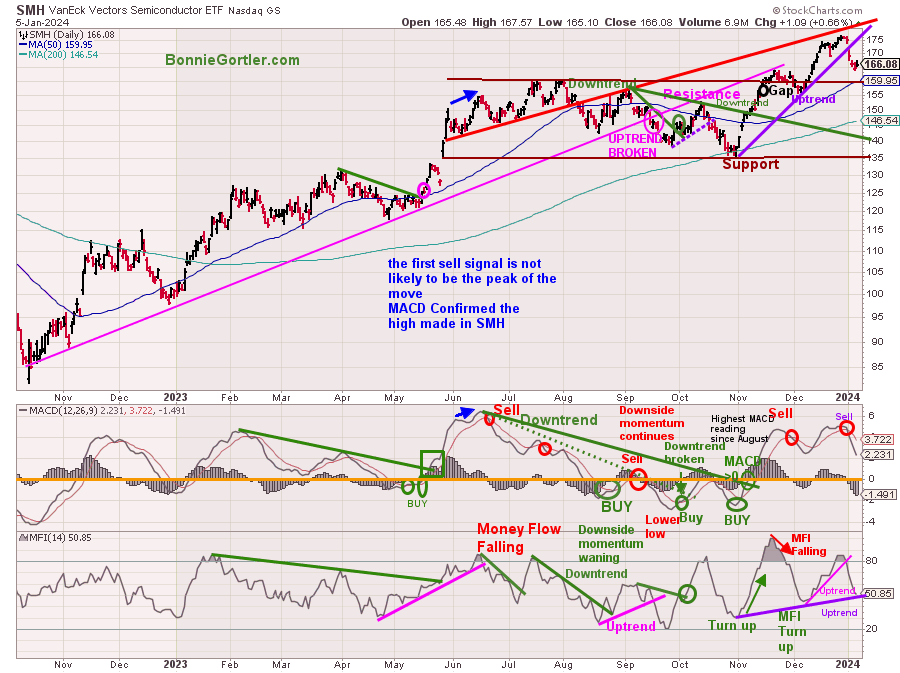
Figure 9: Daily Semiconductors (SMH) (Top) and 12-26-9 MACD (Middle) and Money Flow (Bottom)
010524 SMH Daily
Source: Stockcharts.com
The top chart shows the Daily Semiconductors (SMH) ETF, concentrated mainly in US-based Mega-Cap Semiconductors companies. SMH tends to be a lead indicator for the market when investors are willing to take on increased risk and the opposite when the market is falling.
The Semiconductor ETF (SMH) never challenged the previous week’s high as profit-taking occurred immediately. SMH fell short of the short-term upside objective of 185.00. and broke its October uptrend, down -5.03%, closing at 166.08 last week.
Support is at 165.00, 158.00, 142.00, and 135.00. Resistance is at last week’s high of 176.75.
MACD (middle chart) is on a sell, above 0, falling, but not yet oversold. However, don’t be surprised if a reflex rally occurs as underweight investors rebalance their investments after last week’s weakness.
Money Flow (lower chart) is falling after breaking the December uptrend after not surpassing the November high. However, the October uptrend (purple line) remains. A turn-up would imply investors stepping in to buy Semiconductor stocks wanting to add risk and bargain hunting into the decline this past week. The decline will likely continue if there is no turn-up in Money Flow.
Figure 10: Daily Invesco QQQ Trust (QQQ) Price (Top) and 12-26-9 MACD (Bottom)
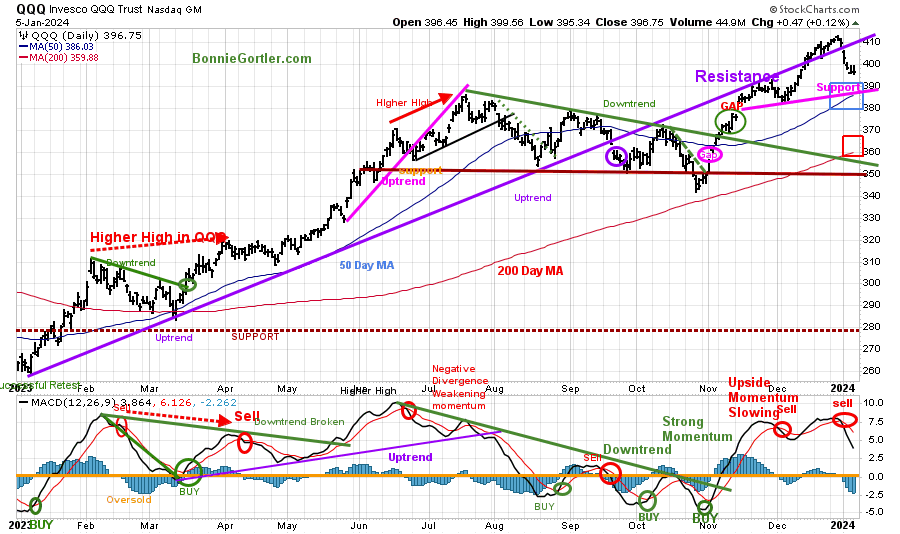
010524 QQQ Daily
Source: Stockcharts.com
The chart shows the daily Invesco QQQ, an exchange-traded fund based on the Nasdaq 100 Index. QQQ made a low in October 2022 (red circle), followed by a successful retest of the low in early January 2023 and the start of an uptrend.
Last week, Nasdaq 100 (QQQ) fell below resistance at 406.00, and the selling continued throughout the week. QQQ closed at 396.75, down -3.12%. QQQ remains above the rising 50-day Moving Average (blue rectangle) and the 200-day Moving Average (red rectangle), a sign of underlying strength.
Support is at 390.00, 380.00, 360.00, and 350.00, with resistance at 400.00, 406.00, and 413.00, slightly above the high from two weeks ago.
The bottom chart, MACD (12, 26, 9), is on a sell, above 0, and falling.
If support at 390.00 holds, look for buyers to step in.
Are you interested in more knowledge about the stock market? Learn how to implement a powerful wealth-building mindset and simple, reliable strategies to help you grow your wealth in my eCourse Wealth Through Investing Made Simple. Learn more here:
Figure 11: The S&P 500 Index (SPY) Daily (Top) and 12-26-9 MACD (Bottom)
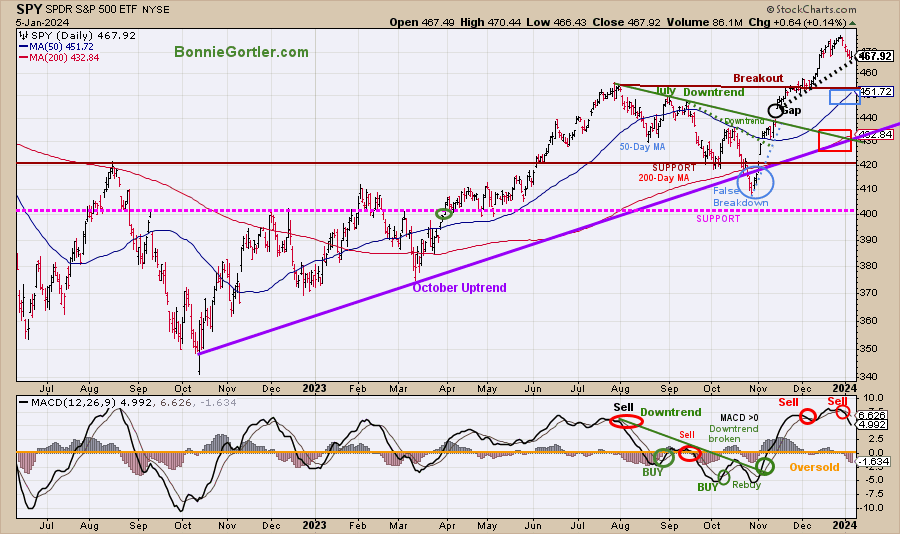
010524 SPY Daily
Source: Stockcharts.com
The S&P 500 (SPY) had a false breakdown (blue circle) in October after being in an uptrend (purple line). Two downtrends were in effect and broken to the upside in September (green dotted line) and August (green solid line).
The daily trend for the SPY remains up, with an upside objective of 485.00.
The SPY closed at 467.92, slightly below support at 468.00, down -1.55% for the week, remaining above the rising 50-day Moving Average (blue rectangle) and the 200-day Moving Average (red rectangle), a sign of strength.
Support is at 460.00, 455.00, 447.00, 440.00, 430.00, and 420.00.
MACD (bottom chart) remains on a sell, above 0, and falling.
It would be a positive sign if support at 460.00 holds and SPY closes above last week’s high of 473.67.
Figure 12: S&P 500 Bullish Percent Index
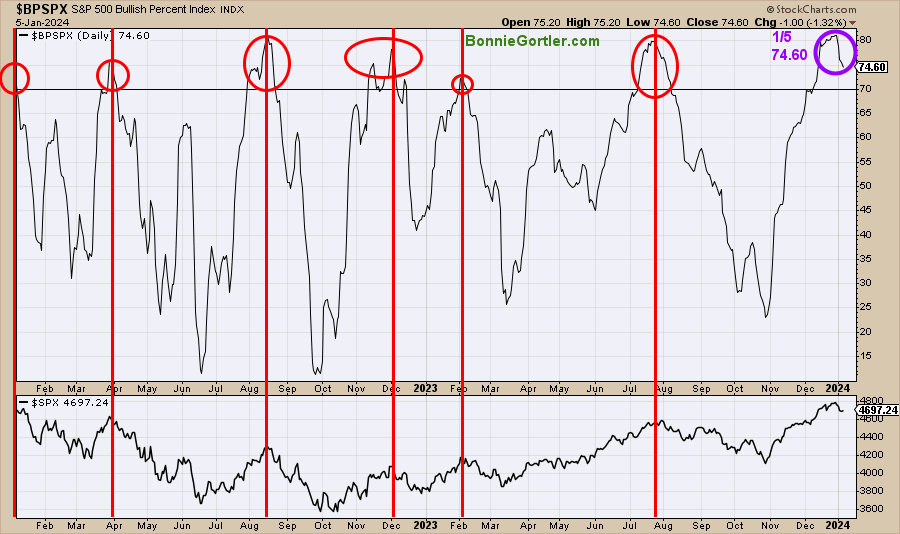
010524 SPY Bullish Percentage Index Daily
Source: Stockcharts.com
The Bullish Percent Index (BPI), developed by Abe Cohen in the 1950s, is a breadth indicator based on the number of stocks based on Point and Figure Buy signals. The indicator helps you know the market’s health and when it’s overbought or oversold.
When the bullish percent index is above 70%, the market is overbought, and when the indicator is below 30%, the market is oversold. Like other overbought indicators, sometimes it does not get as high or as low.
In 2022 and 2023, the indicator reached 70 (overbought) six times (red circles). All occurrences were near market peaks (red lines). Last week, the BPI fell from the peak reading of 81.00 on 12/29/23 to close at 74.60 on 1/05/24 (purple circle). A reading over 70, followed by a retracement below 70, would give a sell signal on this indicator. The S&P index fell from 4769.83, and the S&P 500 index dropped -1.52% for the week.
BPI remains on a buy.
Summing Up:
The nine-week winning streak ended for the major averages. Market breadth weakened on the New York Stock Exchange Index and Nasdaq. There was selling pressure in Semiconductors, Technology, and Small-Cap stocks as investors locked in profits from 2023. Daily momentum indicators turned down last week from an overbought condition but have not yet formed a new low-risk buying pattern. Expect continued volatility this week as the bulls and bears battle for control. Market tops tend to take time to form. With the strength of the advance since October, the odds favor the bulls regaining control and the resumption of the rally before a final top is made.
Remember to manage your risk, and your wealth will grow.
Let’s talk investing. You are invited to set up your Free 30-minute Wealth and Well-Being Strategy session by clicking here or emailing me at Bonnie@BonnieGortler.com. I would love to schedule a call and connect with you.
Disclaimer: Although the information is made with a sincere effort for accuracy, it is not guaranteed that the information provided is a statement of fact. Nor can we guarantee the results of following any of the recommendations made herein. Readers are encouraged to meet with their own advisors to consider the suitability of investments for their own particular situations and for determination of their own risk levels. Past performance does not guarantee any future results


Create more wealth in your life
with these simple strategies.
As an added bonus you will also
receive BG’s Updates and Ezine

Discover how to quickly create more well-being in your life with these simple strategies.
As an added bonus you will also
receive BG’s Updates and Ezine

As an added bonus you will receive BG’s Updates and Ezine

All work listed on BonnieGortler.com is licensed under a Creative Commons Attribution - Noncommercial - No Derivative Works 3.0 Unported License.


Free Report:
Grow and Sustain Your Wealth
Discover how to grow your money with these easy, simple steps.


Wow Bonnie! Very insightful and nicely explained. Ty!
Thank you Don. I appreciate your kind words and stopping by my blog. Much success to you. Bonnie