

10 Simple Tips for Financial Well-Being
07/01/2026
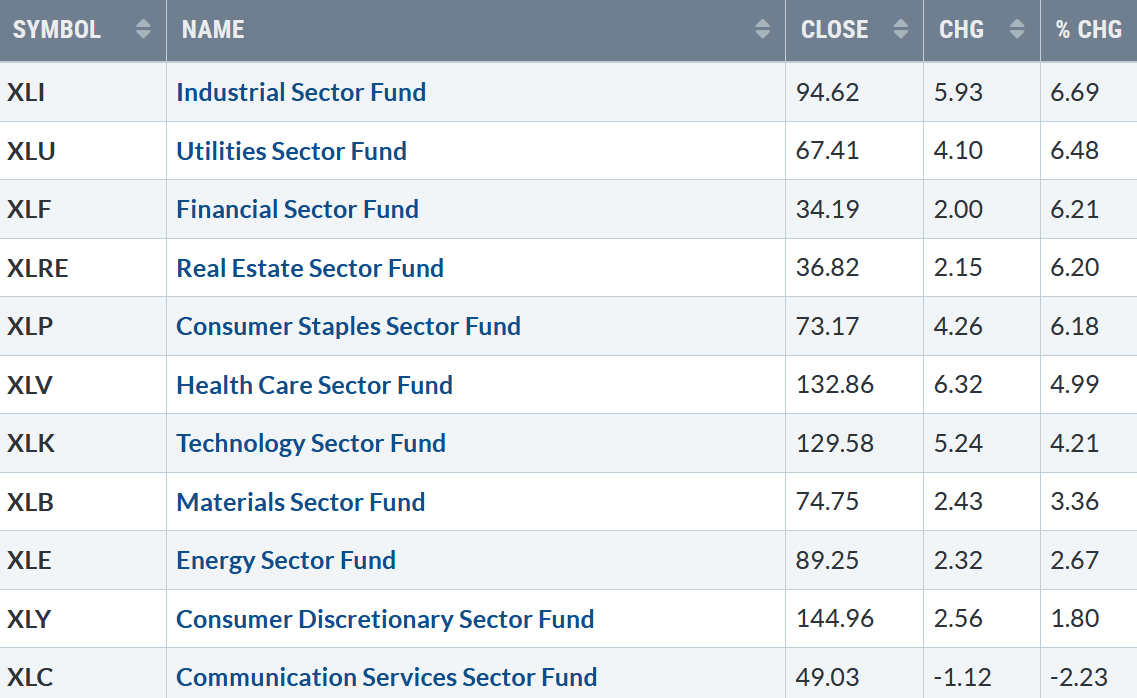
A broad market rally occurred last week, despite all the bad news. Ten of eleven S&P SPDR sectors finished higher. Industrials (XLI) and Utilities (XLU) were the strongest sectors, while Consumer Discretionary (XLY) and Communications Services (XLC) were the weakest. The SPDR S&P 500 ETF Trust (SPY) rose +3.94%.
S&P SPDR Sector ETFs Performance Summary
10/21/22 – 10/28/22
102822 Sectors Week
Source: Stockcharts.com
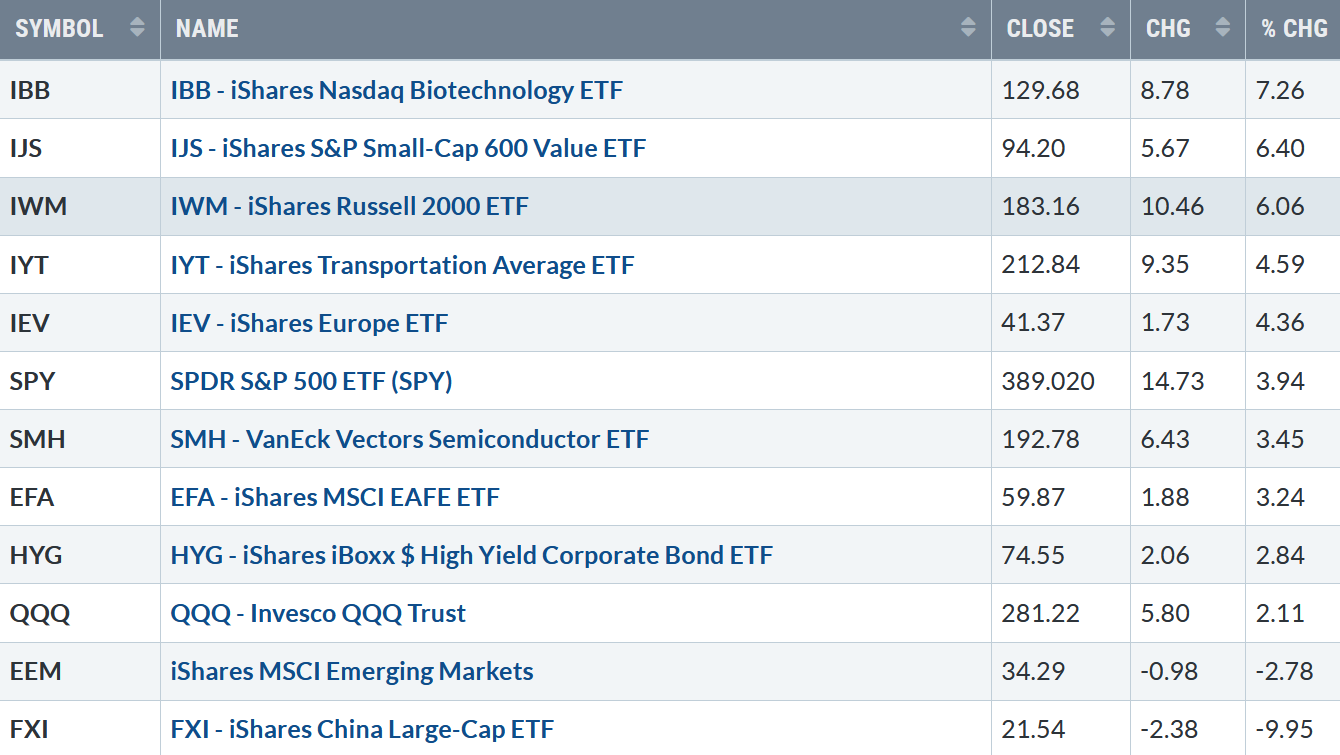
Figure 2: Bonnie’s Mix of ETFs
Performance Summary 10/21/22 – 10/28/22
102822 Week ETFs
Source: Stockcharts.com
Stocks rose sharply, with Small Cap Value and Growth outperforming the S&P 500, while Emerging Markets and China lagged, both down on the week.
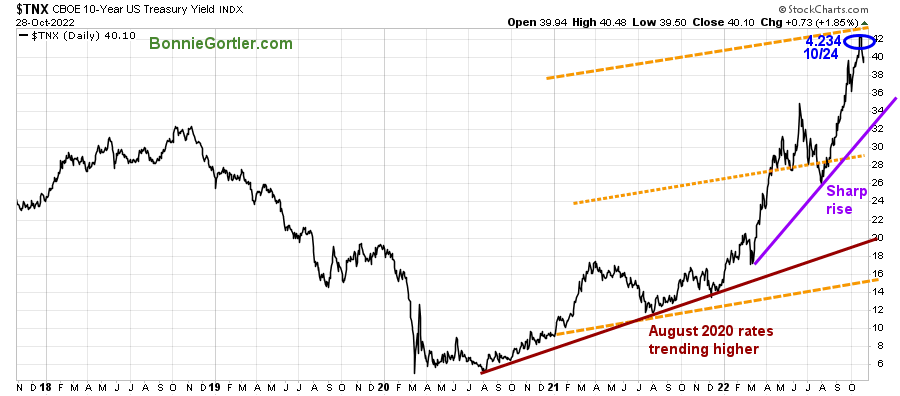
Figure 3: UST 10YR Bond Yields Daily
102922 UST 10 Yr Bond Yields Daily
Source: Stockcharts.com
The 10-Year U.S. Treasury yields fell, closing at 4.010% last week, backing off the high of 4.234%, and below the upper channel objective. It would be positive if yields started to consolidate and the pace of rise slowed.
The major averages all were higher last week. The Dow was up +5.72%, rising for its fourth straight week. The S&P 500 gained +3.95%, its third week higher in the last four weeks, and the Nasdaq was up +2.24%. Nasdaq underperformed the Dow and S&P 500 after weak results and outlooks from Microsoft, Alphabet, and Meta.
The Russell 2000 Index led the major averages, gaining +6.01%, and the Value Line Arithmetic Index (a mix of approximately 1700 stocks gained +5.44%, implying the advance is broadening.
Weekly market breadth improved and was positive on the New York Stock Exchange Index (NYSE) and Nasdaq. The NYSE had 2708 advances and 745 declines, with 188 new highs and 487 new lows. There were 3798 advances and 1574 declines on the Nasdaq, with 343 new highs and 811 new lows.
“Successful people are simply those with successful habits.” ~Brian Tracy
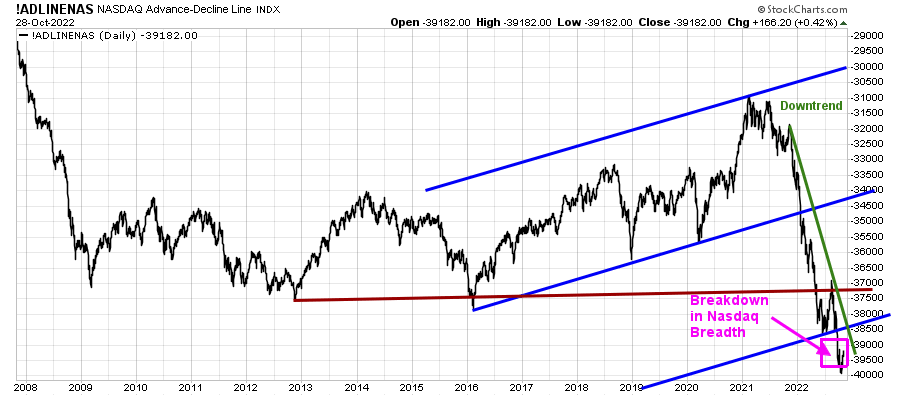
Figure 4: Nasdaq Advance-Decline Line (Daily) 2008-2022
102822 Nasdaq Daily AD-Line
Source: Stockcharts.com
It remains concerning Nasdaq breadth has made lower lows except for brief short-term rallies with a breakdown (pink rectangle) that fell to its lowest level since 2016.
The 2022 downtrend remains in effect (green line).
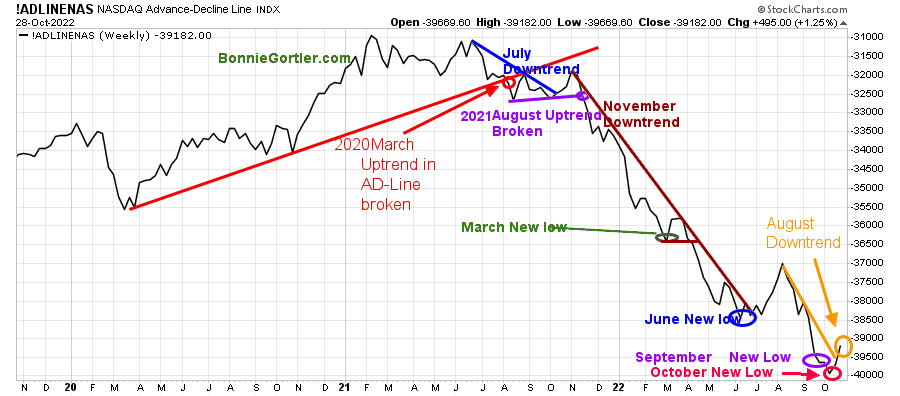
Figure 5: Nasdaq Advance-Decline Line (Weekly)
102922 Nasdaq Weekly AD-Line
Source: Stockcharts.com
The March 2020 uptrend in the weekly Nasdaq Ad-Line broke in July 2021 (red line), and then Nasdaq breadth weakened, with many Nasdaq growth stocks down over 50% in 2022.
In July 2022, market breadth improved, starting an uptrend in the AD-Line, but it was short-lived. In August, breadth weakened further, followed by new lows in September and October.
Last week, the August downtrend was penetrated (orange circle).
If there is further improvement in market breadth, growth stocks are likely to act better and be less volatile.
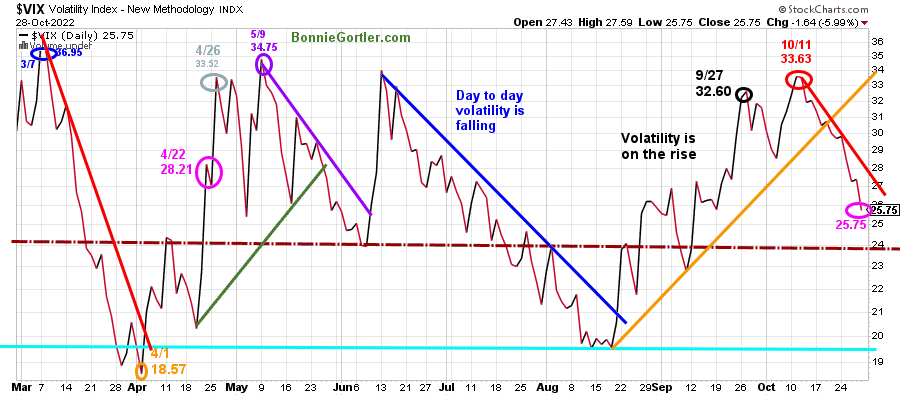
Figure 6: CBOE Volatility Index VIX
102822 VIX Daily
Source: Stockcharts.com
The CBOE Volatility Index (VIX), a measure of fear, has been trading above 20.00 for most of 2022. In late January, VIX made a high at 36.95 on 3/7 (blue circle), followed by a pullback to a low on 4/1 at 18.57 (orange circle). VIX approached the low in August but trended higher, peaking at 33.63 on 10/11 (red circle).
VIX fell continued to fall last week after breaking the August up trend (orange line), closing at 25.75 (pink circle), near support at 24.00 (brown dotted line), a previous resistance area.
Intra-day volatility could remain high with traders awaiting the Federal Reserve meeting next week and another rate increase. A close below 24.00 would be positive and imply intraday volatility to slow.
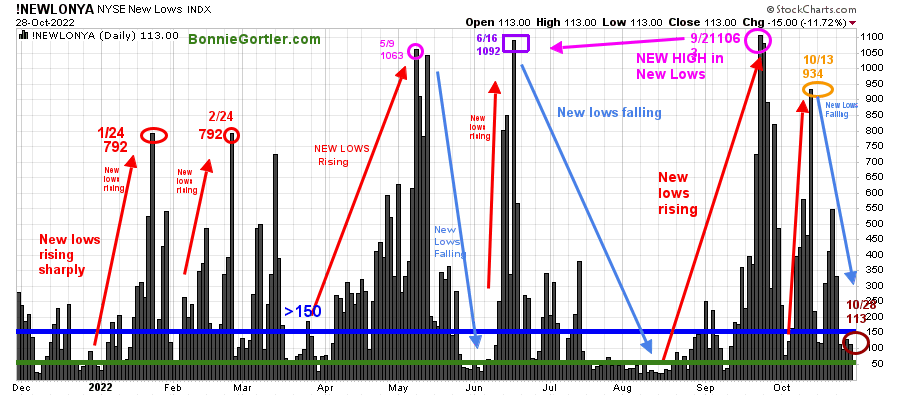
Figure 7: Daily New York Stock Exchange (NYSE) New Lows
102822 NYSE New Lows
Source: Stockcharts.com
Watching New lows on the New York Stock Exchange is a simple technical tool that helps awareness of the immediate trend’s direction.
New lows warned of a potential sharp pullback, high volatility, and “panic selling” for most of 2022, closing above 150. n January 2022, New Lows rose sharply, peaking at 792 on 1/24 and again on 2/24 (red circles), implying an increased risk of further selling pressure.
Investors in early May unloaded stocks, with New Lows expanding to 1063 on 5/9 (pink circle), then to a new high of 1092 on 6/16 (purple rectangle), which remained the most New Lows until 9/23 when New Lows made a new high of 1106. After New Lows contracted in June and July, New lows began to increase in mid-August, rising above 150 (blue horizontal line), the high-risk zone. As a result, the broad market weakened.
After falling below, the high-risk zone in early October, New Lows on the New York Stock Exchange Index (NYSE) began to increase. On 10/13, they reached 934 (brown circle) but were below the peak of 1106 on 9/23 (pink circle), implying less downside momentum.
New Lows have fallen the past two weeks, closing at 113 (brown circle) below 150, no longer in a high-risk zone. If New Lows contracts between 25 and 50, it would be positive. Learn more about the significance of New Lows in my book, Journey to Wealth, published on Amazon. If you would like a preview, get a free chapter here.  Want a 15-minute chat with me about your investments? Just email me at Bonnie@Bonniegortler.com to set it up.
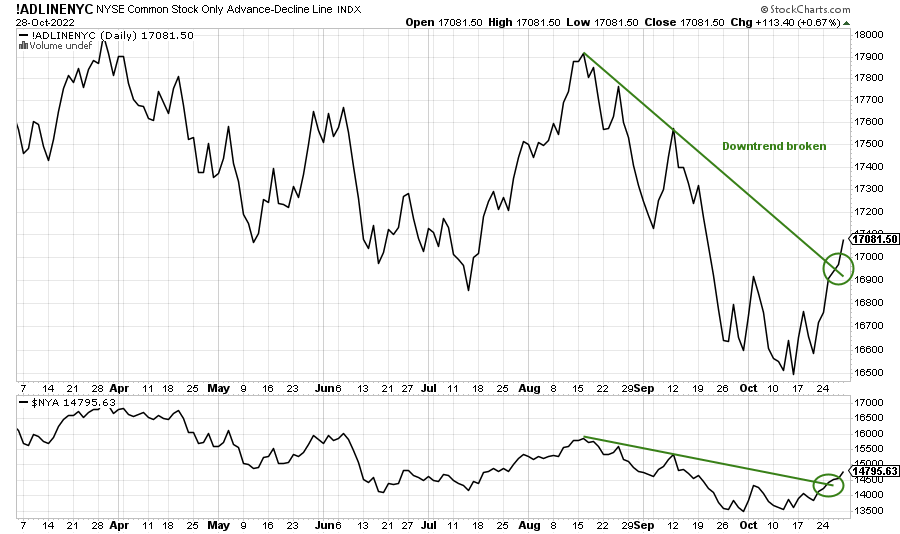
Figure 8: NYSE Cumulative Advance-Decline Line (Top) NYSE (Bottom)
102822 NYSE Cum AD LIne and NYSE Price
The top chart above is the NYSE cumulative advance-decline line, a breadth indicator representing the cumulative difference between the number of advancing and declining stocks on the New York Stock Exchange (NYSE).
Last week AD-Line broke its short-term downtrend from August (green line), confirmed by the NYSE (bottom chart), implying underlying strength that will likely continue in the near term.
Improving Market Breadth Bodes Well For U.S. Equities
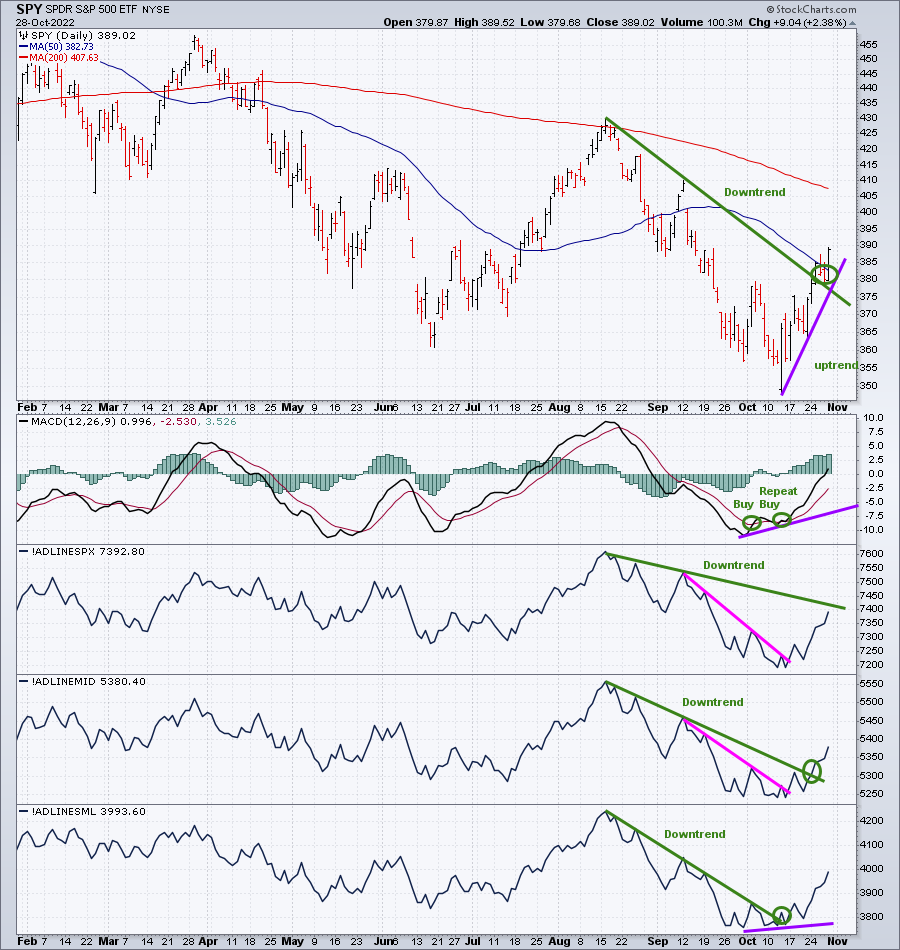
Figure 9: S&P 500 (SPY) Price, MACD, and Advance-Decline lines of the S&P 500, MidCap, and Small Cap
102822 S&P500, Midcap, Smallcap AD Lines
Source: Stockcharts.com
The chart above is the S&P 500 (SPY) Price and MACD, with the S&P 500, Midcap, and Small Cap Advances Decline Lines. It’s positive the S&P 500 top chart broke its August downtrend (green line).
All three’s Advance-Decline lines appear to have made a short-term bottom.
The Mid and Small Cap AD Lines have broken their August downtrends confirming more room to the upside while the S&P 500 is close.
Small Caps are gaining strength is bullish
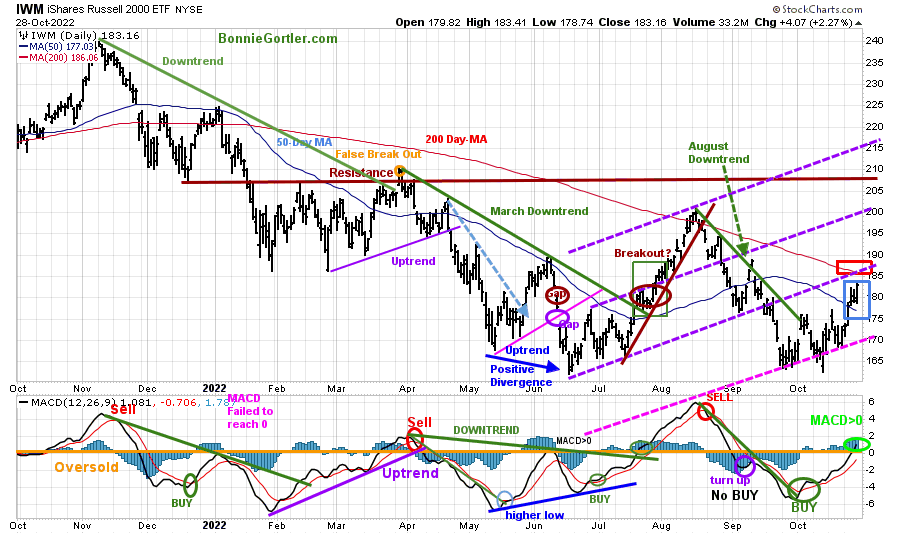
Figure 10: Daily iShares Russell 2000 (IWM) Price (Top) and 12-26-9 MACD (Bottom)
102822 IWM Daily
Source: Stockcharts.com
The top portion of the chart is the daily iShares Russell 2000 Index ETF (IWM), the benchmark for small-cap stocks, with a 50-Day Moving Average (MA) (blue line) and 200-Day Moving Average (MA) that traders watch and use to define trends.
At the end of March, IWM failed to break out above resistance at 210.00 (orange circle) and turned lower with few rallies since the June bottom that have been unsustainable. IWM stalled below the mid-channel in early September (middle purple dotted line) at 190.00.
Last week IWM outperformed the major averages, up +6.06%, closing at 183.16, above Its 50-Day Moving Average (blue rectangle), a sign of underlying strength. However, IWM remains slightly below the 200-Day Moving Average (red rectangle).
It’s positive that IWM was stronger than the S&P 500 last week and gaining relative strength. Short-term resistance is 185.00 and 200.00. Support is at 175.00 and 170.00.
MACD (middle chart) remains on its buy, rising and above 0, implying underlying strength.
If IWM continues to outperform the S&P 500 (SPY) and close above 185.00, the odds favor further strength towards 190.00, followed by 200.00.
Want a 15-minute chat with me about your investments? Just email me at Bonnie@bonniegortler.com to set it up.
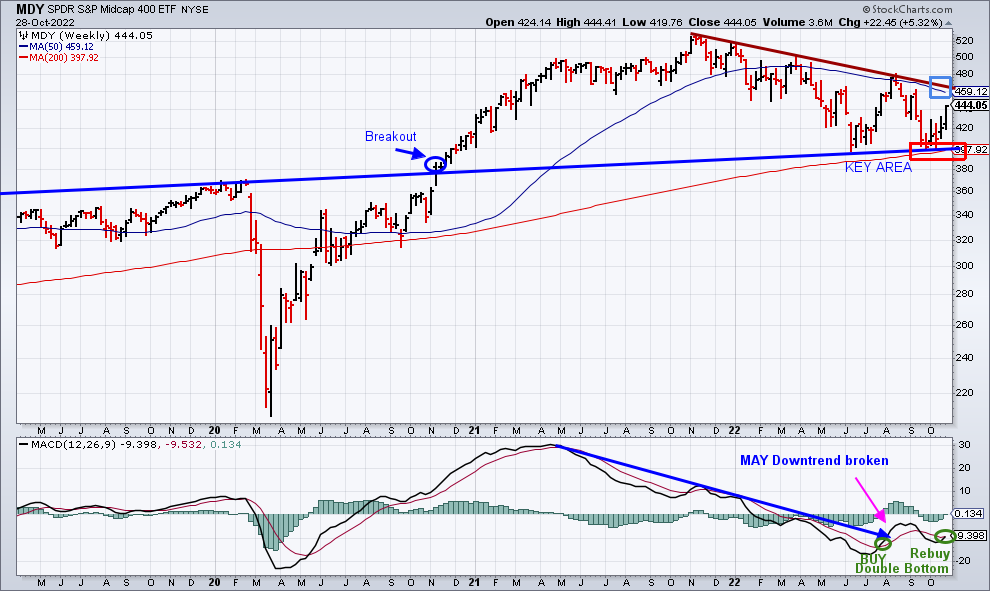
Figure 11: SPDR S&P MidCap 400 (MDY) Weekly Price (Top) and 12-26-9 MACD (Bottom)
102822 MDY Weekly
Source: Stockcharts.com
The SPDR S&P MidCap 400 (MDY) (top chart) has been acting better and gaining strength in October after holding a key support area (blue line) above the 200 Week MA (red rectangle).
MACD (lower chart) remains on a buy (green circle) after breaking the downtrend (blue line), which was premature. However, MACD has given a rebuy with a favorable double-bottom formation.
If MDY has the strength to break the November 21 downtrend (brown line), expect further gains.
Nasdaq Closed Well But is Weaker Than the Broad Market
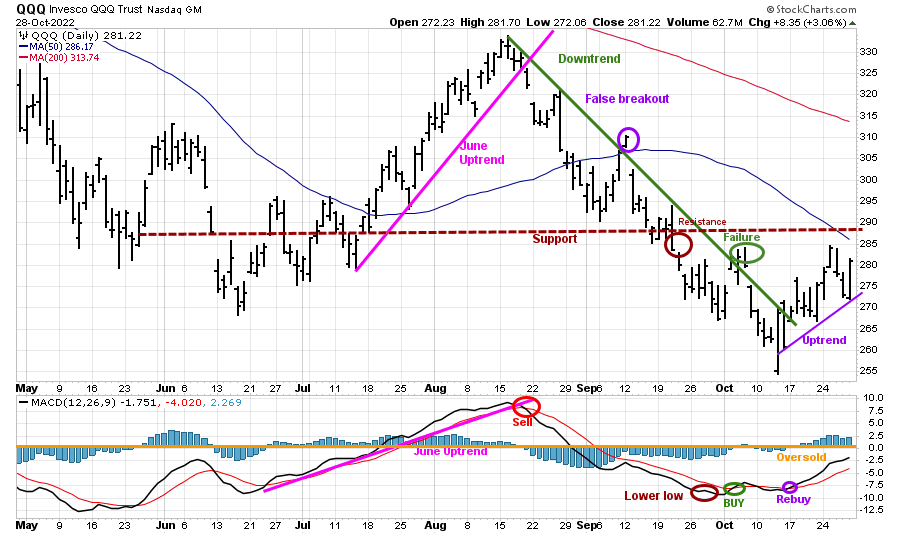
Figure 12: Daily Invesco QQQ Trust (QQQ) Price (Top) and 12-26-9 MACD (Bottom)
102822 QQQ Daily
Source: Stockcharts.com
The chart shows the daily Invesco QQQ, an exchange-traded fund based on the Nasdaq 100 Index. The two top holdings in QQQ are Apple (AAPL) and Microsoft, with over 20.00%. Both stocks impact the direction of QQQ.
QQQ moved lower after a false break out (purple circle) in September of the August downtrend (green line). QQQ has lagged the Dow and S&P 500 in October as interest rates have risen. QQQ missed its downside objective of 250.00 mentioned in the 10/7/22 Market Update, with a low of 254.26 on 10/13.
It’s positive the QQQ is now in an uptrend (purple line). Last week QQQ closed with a gain of +2.11% at 281.22. Support is 270.00 and 265.00. Resistance is at 286.00, 290.00, and 300.00.
The bottom chart is MACD (12, 26, 9), a measure of momentum remains on a buy, rising but below 0, not yet showing underlying strength.
For now, the QQQ closed strong on Friday, but there is no sign yet of significant upside momentum; however, for QQQ to continue, APPL needs to hold above 142.00 and MSFT above 225.00.
More base building in QQQ may be needed, with a confirmation of the intermediate trend (weekly chart) confirming the rise.
Figure 13: Weekly Invesco QQQ Trust (QQQ) Price (Top) and 12-26-9 MACD (Bottom)
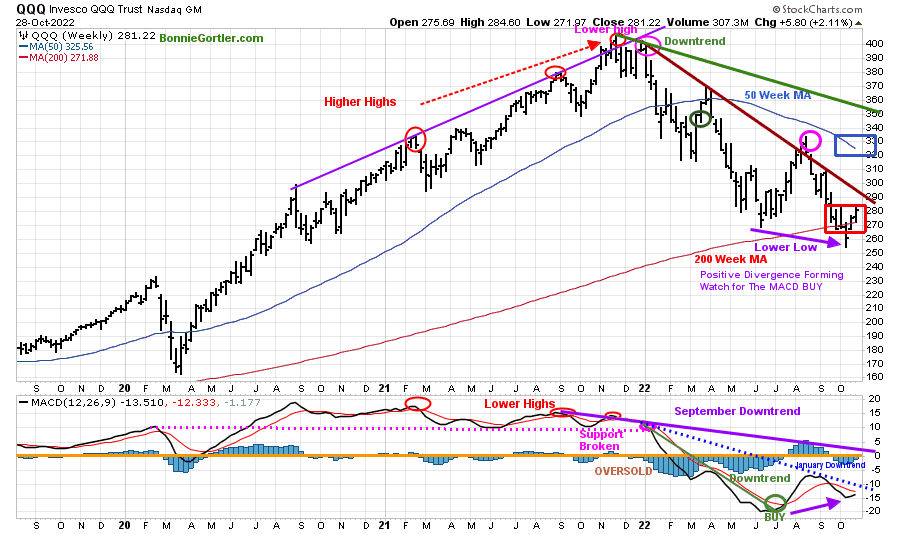
102822 QQQ Weekly
Source: Stockcharts.com
The top chart shows the weekly Invesco QQQ Trust (QQQ) making higher highs peaking in November 2021 (red circles) but failing to make a new high in December 2021. QQQ then formed two downtrends (brown line and green line).
One downtrend (brown line) was broken in August, but QQQ immediately turned down (pink circle), stalling below a down sloping 50-Week MA. QQQ then made a lower low in October (purple arrow).
MACD in the lower chart has a higher low. Notice the positive divergence. A rebuy with a break of the January downtrend (blue dotted line) would be bullish.
Figure 14: Energy SPDR Daily (XLE)
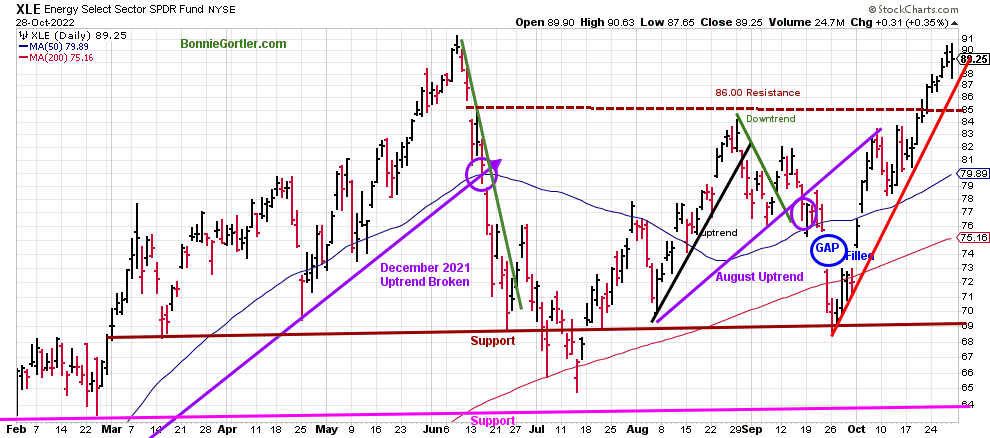
102822 XLE Daily
Source: Stockcharts.com
Energy (XLE), the strongest sector in 2022, rose in early August, forming an uptrend after its pullback from the June highs holding support at 69.00 (brown line).
Last week XLE rose +2.67%, continuing its uptrend from September, closing above the 50 and the 200-Day, a sign of underlying strength.
Resistance is at 91.00. Support is at 85.00, 80.00, and 76.00, followed by 69.00. As long as XLE remains above 85.00, the recent uptrend (redline) will remain in effect, and the rise will likely continue.
If you are interested in following this chart and other charts during the week, I invite you to join my FB group Wealth Through Market Charts, where I post updated charts intraday throughout the week.
Follow-Up – Silver
Figure 15: I Shares Silver Trust (SLV) and 12-26-9 MACD (Bottom)
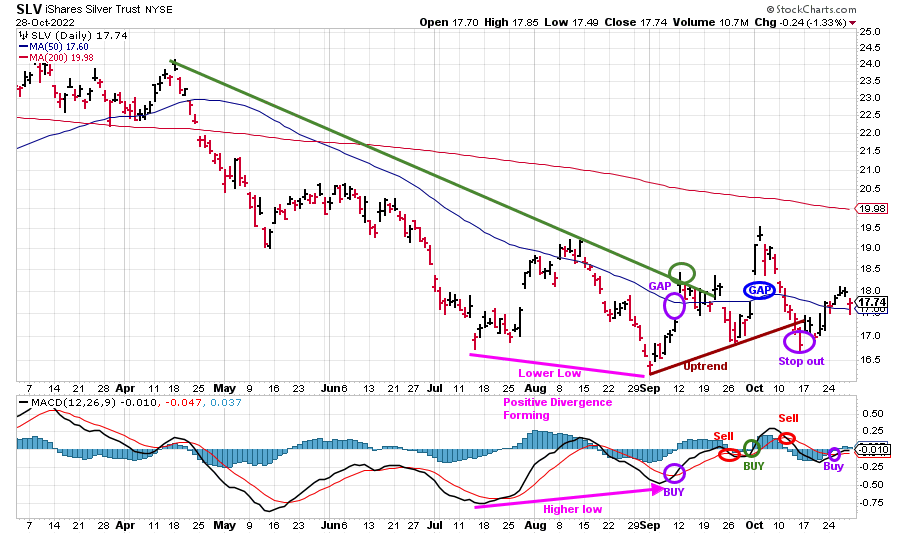
102822 SLV Daily
Source: Stockcharts.com
SLV fell -0.11%, closing at 17.74, continuing its choppy price action. SLV fell below the stop on 10/14/22 after SLV closed at 16.81, below the stop price of 16.87.
MACD (bottom chart) has flipped again to a buy after two quick buy and sells.
There is no evidence that SLV will begin a big move in either direction.
Monitor Junk Bonds (HYG) For the Risk Appetite of Investors.
Figure 16: I Shares Hi Yield Corporate Bond (HYG) (Top), and 12-26-9 MACD (Bottom)
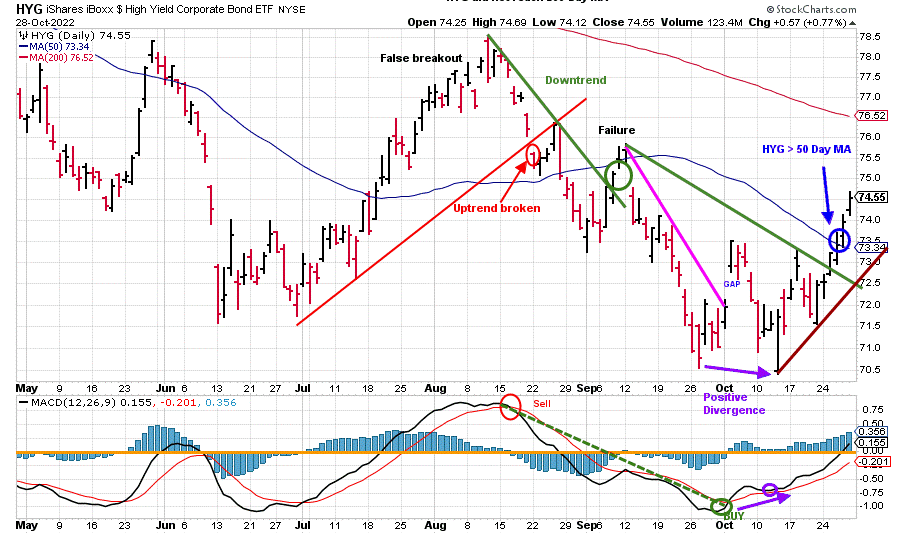
102822 HYG Daily
Source: Stockcharts.com
Investors were willing to take on the risk, buying Hi-Yield Bonds (HYG), up 2.84%, closing at 74.55. HYG is in an uptrend (brown line) after making a low in October. HYG broke the September downtrend (green line) last week and closed above the 50-Day Moving Average.
MACD (bottom chart) is on a buy, rising, and above 0, which implies underlying strength.
Continued strength in HYG would be bullish for Equities and High Yield bonds.
On the other hand, the opposite is true. Weakness in HYG would be bearish for Equities and High Yield bonds.
Summing Up:
Investors ignored bad news of disappointing earnings and closed higher before the weekend, a rare occurrence in 2022. Short-term momentum indicators have improved, with Small and Mid-Cap Stocks outperforming the S&P 500, a sign that the recent rise is broadening. It’s positive the major averages are now in short-term uptrends, and the intermediate momentum patterns are improving. The bulls appear to have taken control as the most favorable historical seasonal period of the year is here. As long as the October uptrends remain in effect, higher prices are likely.
Remember to manage your risk, and your wealth will grow.
If you liked this article, you will love my Free Grow and Sustain Your Wealth Report. Get it here:
Do you like charts, I invite you to my FB group Wealth Through Market Charts or email me at Bonnie@Bonniegortler.com.
I would love to hear from you. If you have any questions or comments or would like to talk about the market, click here.
Disclaimer: Although the information is made with a sincere effort for accuracy, it is not guaranteed that the information provided is a statement of fact. Nor can we guarantee the results of following any of the recommendations made herein. Readers are encouraged to meet with their own advisors to consider the suitability of investments for their own particular situations and for determination of their own risk levels. Past performance does not guarantee any future results.


Create more wealth in your life
with these simple strategies.
As an added bonus you will also
receive BG’s Updates and Ezine

Discover how to quickly create more well-being in your life with these simple strategies.
As an added bonus you will also
receive BG’s Updates and Ezine

As an added bonus you will receive BG’s Updates and Ezine

All work listed on BonnieGortler.com is licensed under a Creative Commons Attribution - Noncommercial - No Derivative Works 3.0 Unported License.


Free Report:
Grow and Sustain Your Wealth
Discover how to grow your money with these easy, simple steps.

