

10 Simple Tips for Financial Well-Being
07/01/2026
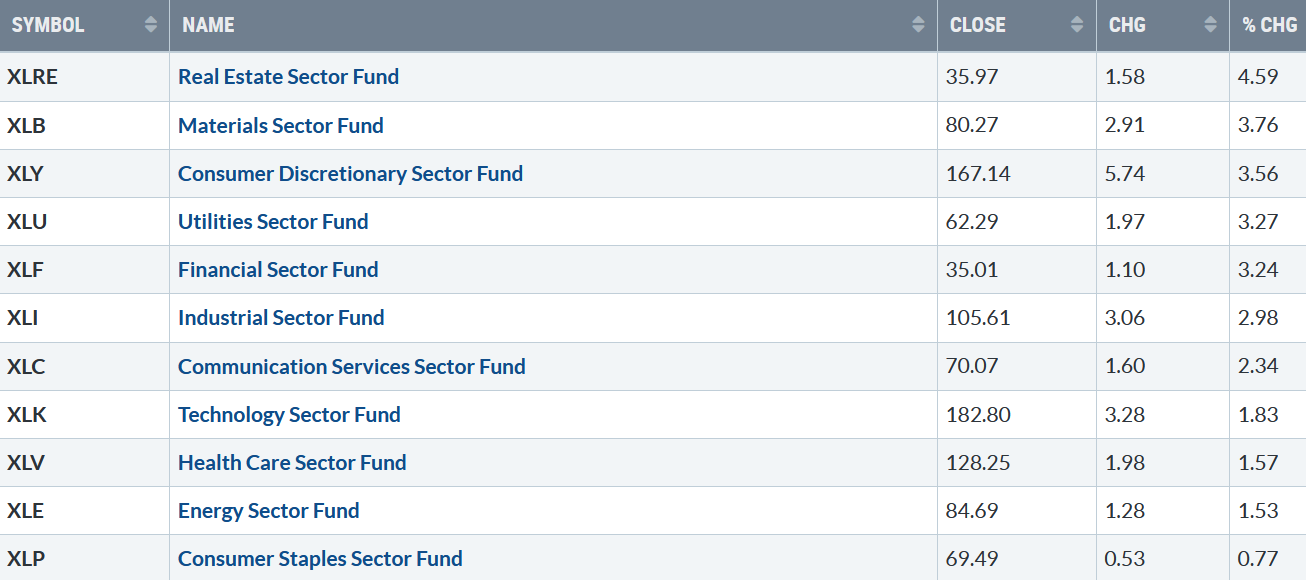
The stock market advance broadened last week, with all eleven S&P SPDR sectors higher. Real Estate (XLRE) and Materials (XLB) were the best sectors, while Energy (XLE) and Consumer Staples rose but were the weakest. The SPDR S&P 500 ETF Trust (SPY) gained +2.31%.
S&P SPDR Sector ETFs Performance Summary 11/10/23-11/17/23
111723 SPDR Sectors
Source: Stockcharts.com
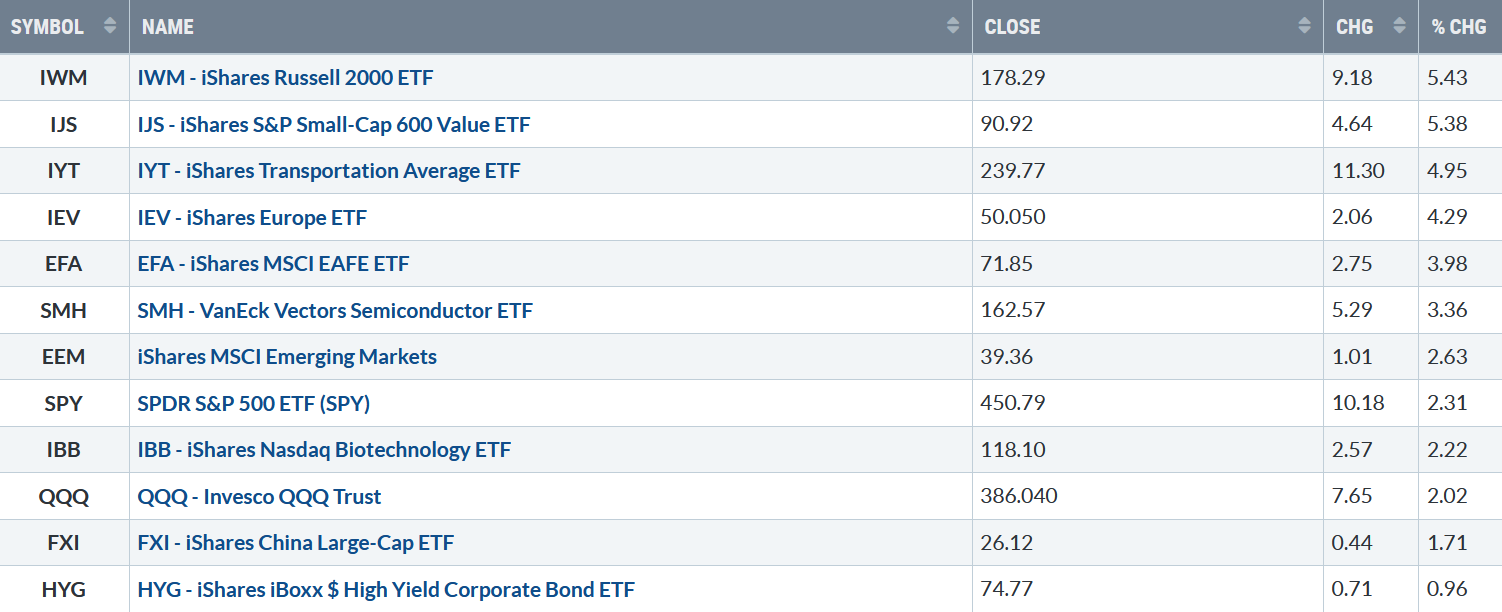
Figure 2: Bonnie’s ETFs Watch List Performance Summary 11/10/23-11/17/23
111723 Week ETFs
Source: Stockcharts.com
Small Cap Growth and Small Cap Value led the way, with Transportation and Global markets gaining strength.
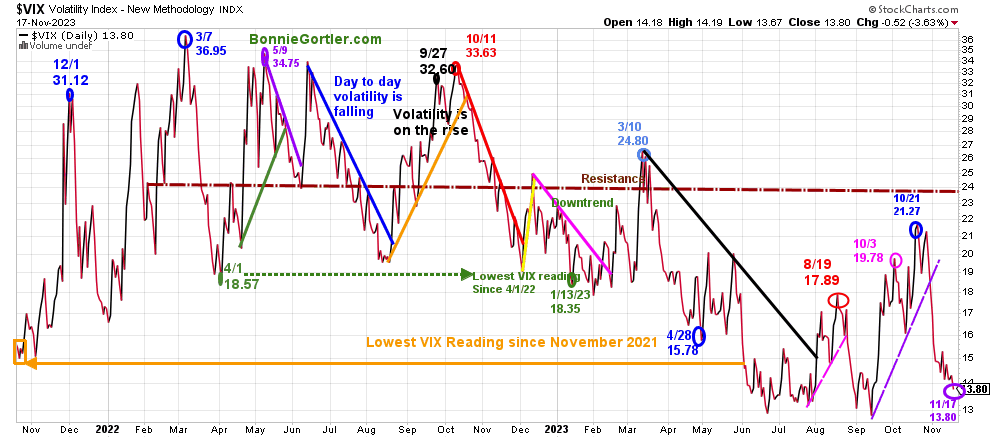
Figure 3: CBOE Volatility Index VIX
111723 VIX Daily
Source: Stockcharts.com
The CBOE Volatility Index (VIX), a measure of fear, traded above 20.00 for most of 2022, with a high at 36.95 on 3/7 (blue circle), which did not get violated in 2023.
VIX continued its downward trend last week, closing at 13.80 (purple circle).
If the VIX remains below 16, look for intraday volatility to be limited.
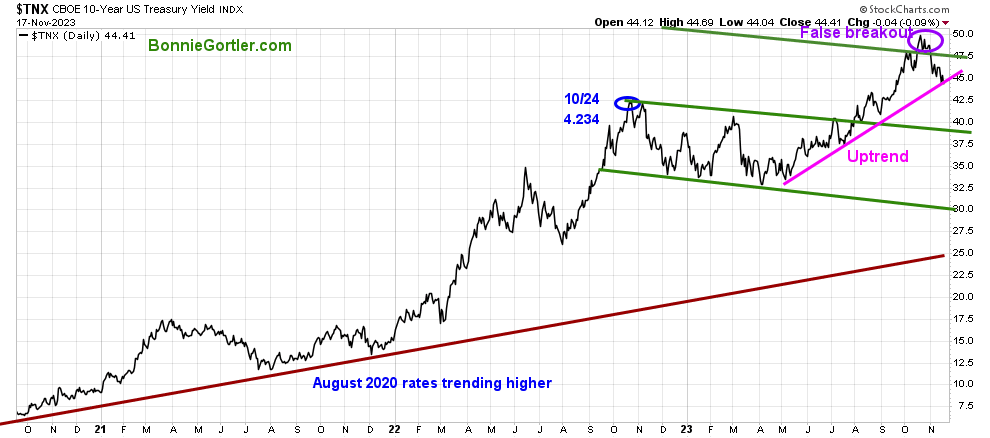
Figure 4: UST 10YR Bond Yields Daily
111723 UST 10 Yr Bond Yields Daily
Source: Stockcharts.com
The 10-year U.S. Treasury yields closed lower last week at 4.441% in volatile trading, slightly above the May uptrend (pink line) after a false break out of the channel (top green line) in October.
A drop in yields breaking the May uptrend would imply a potential test of 3.90% and be short-term positive for equities to continue to rise.
A solid week of gains for the major market averages, with the Dow gaining +1.94%, the S&P 500 +2.24%, and the Nasdaq up +2.37%. The Russell 2000 Index gained +5.42%, the big winner last week.
Are you interested in learning about the stock market in the comfort of your home? Learn how to implement a powerful wealth-building mindset and simple, reliable strategies to help you Grow Your Wealth. Learn more here: https://bonniegortler.lpages.co/wealth-made-simple-ecourse/.
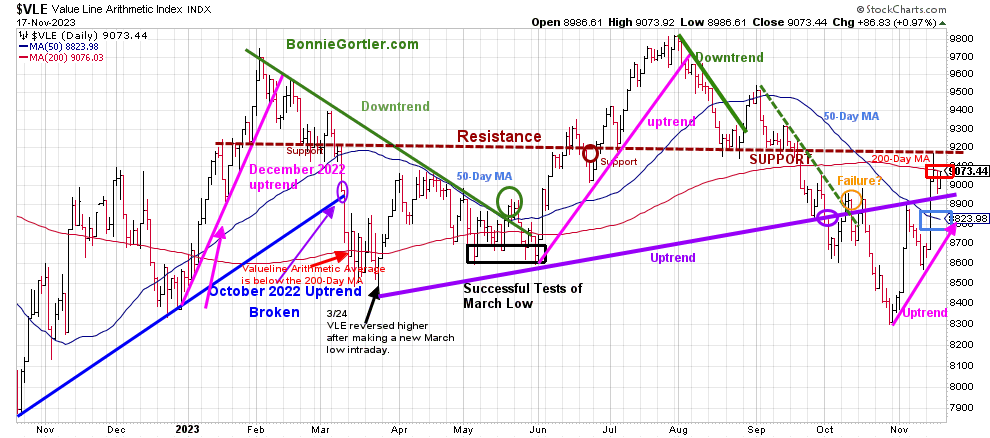
Figure 5: Value Line Arithmetic Average
 Source: Stockcharts.com
The Value Line Arithmetic Index ($VLE) is a mix of approximately 1700 stocks. VLE broke the October 2022 uptrend in early March 2023 (blue line), and April, May, and June successfully tested the March low and ultimately made a new low in October 2023.
The daily trend of the VLE shifted to up.
VLE reversed higher last week, closing at 9073.44, up 4.5%%. VLE closed above the 50-day MA (blue rectangle), only a few points below the 200-day MA (red rectangle).
Support is 8950, 8800, and 8600. Resistance is at 9200 and 9500.
It is bullish that VLE closed above the uptrend line where VLE broke down (purple line). A rising double-bottom pattern has formed.
Further strength in VLE this week would imply a continuation of the rally broadening and be short-term positive, potentially testing September’s high. On the other hand, if VLE stalls now and closes below 8600, this would be a short-term negative.
Do you want to go deeper into charting? Learn more in the comfort of your home today with my Free 33-minute Training, Charting Strategies to Cut Risk and Trade with the Trend. Sign up here.
Market breadth improving.
Weekly market breadth was positive on the New York Stock Exchange Index (NYSE) and for the Nasdaq. The NYSE had 2474 advances and 538 declines, with 189 new highs and 117 new lows. There were 3408 advances and 1,305 declines on the Nasdaq, with 245 new highs and 513 new lows.
Continued improvement in market breadth on the NYSE and Nasdaq New Lows is necessary for the latest rally to continue over the next several weeks.
If you want to go more in-depth with charts, I invite you to join my FB group, Wealth Through Market Charts.
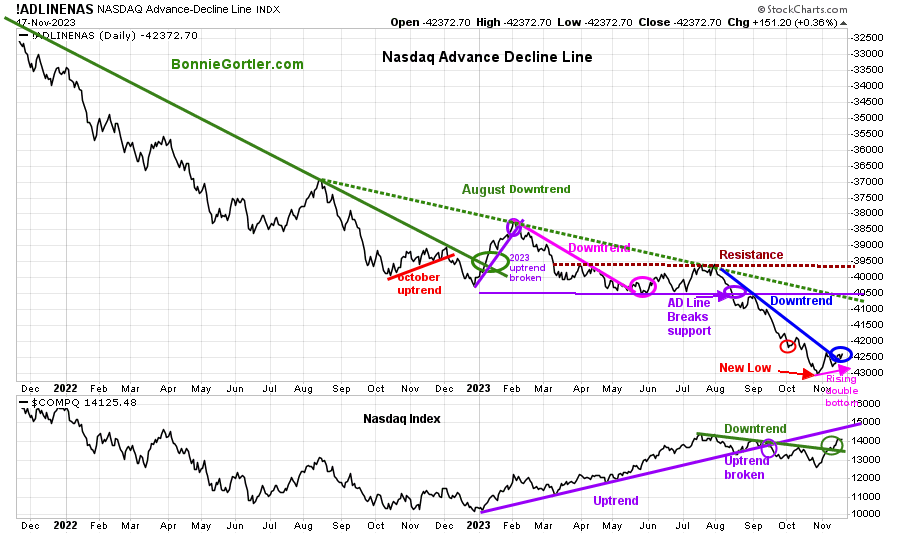
Figure 6: Nasdaq Advance Decline Line Daily (Top) and Nasdaq (Bottom)
111723 Daily Nasdaq Cumulative Advance-Decline Line
Source: Stockcharts.com
The top chart is the Nasdaq Daily Advance-Decline Line, a technical indicator that plots the difference between the number of advancing and declining stocks. In January 2023, the October 2022 downtrend was broken (solid green line) but quickly reversed lower in February 2023, when most of the stock participation was the large Mega Cap Stocks.
The AD-Line (top chart) broke support (purple circle) in August and continued making new lows in October (red arrow). It is positive a favorable rising double formation has formed, combined with a break of the August downtrend (blue circle).
It’s positive Nasdaq (lower chart) broke the July downtrend (green line) but remains below the uptrend (purple line), now resistance where it broke down in September.
If market breadth continues improving, expect the Nasdaq to increase over the next several weeks and months.
New Lows on the NYSE and the Nasdaq are falling.
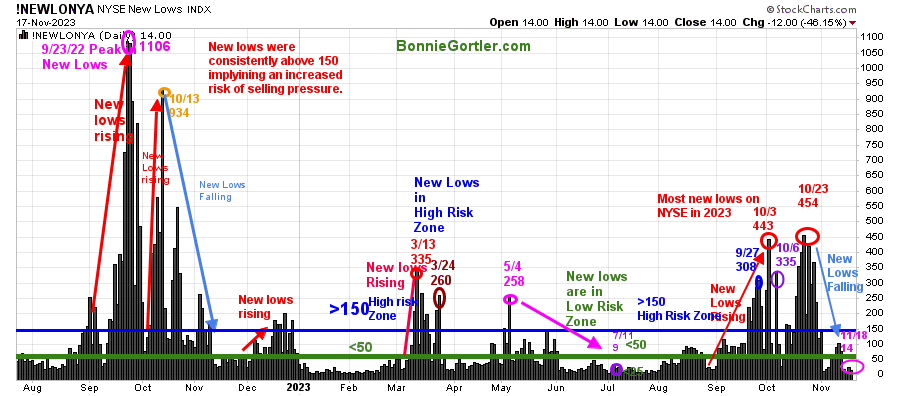
Figure 7: Daily New York Stock Exchange (NYSE) New Lows
111723 NYSE New Lows Daily
Source: Stockcharts.com
Watching New Lows on the New York Stock Exchange is a simple technical tool that helps awareness of the immediate trend’s direction. New lows warned of a potential sharp pullback, high volatility, and “panic selling” for most of 2022, closing above 150. The peak reading was 9/23/22 when New Lows made a new high of 1106 (pink circle), and New Lows expanded to their highest level in 2023 on 3/13/23 (red circle) to 335.
New Lows increased in September (red arrow on the right) toward the high-risk zone greater than 150, peaking at 443 on 10/3, the highest reading since October 2022.
New lows had stopped accelerating in early October. However, the decline was not complete until the end of the month as New Lows made only a slight new high, peaking at 454 (red circle) on 10/23.
New lows on the NYSE are falling, closing at 14 (pink circle) last week, now in the lowest risk zone below 25. It would be short-term positive if New Lows remain consistently between 25 and 50. On the other hand, an increase above 150 would be a warning sign of potential weakness.
Learn more about the significance of New Lows in my book, Journey to Wealth, published on Amazon. If you would like a preview, get a free chapter here.
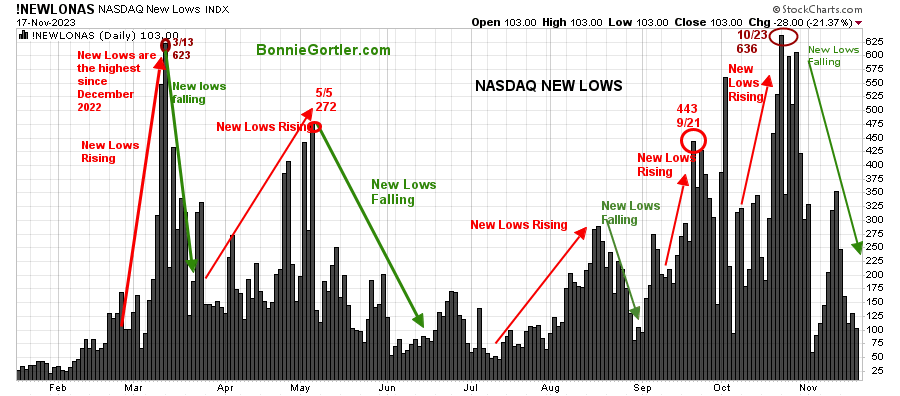
Figure 8: Daily Nasdaq New Lows
111723 Nasdaq New Lows Daily
Nasdaq New Lows have risen since July, peaking on 10/23 at 636, the most New Lows since 9/21/23 when they were 443. It’s positive New Lows have trended lower since.
Nasdaq New Lows continued to fall last week, closing at 103. Pay attention this week if New Lows expand or contract for a clue if the recent rally will continue or stall. If New Lows begin to rise, a possible short-term reversal to the downside will occur.
For now, give the bulls the benefit of the doubt.
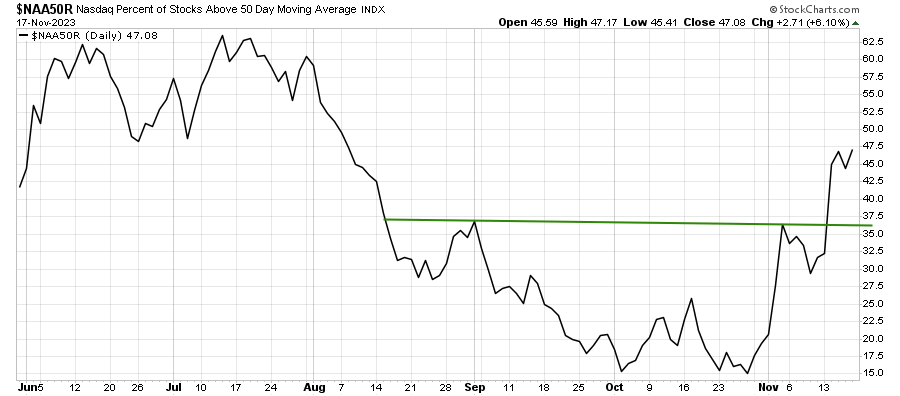
Figure 9: Nasdaq Percent of Stocks Above 50-Day Moving Average
111723 Nasdaq Percent of Stocks Above 50-Day Moving Average
Source: Stockcharts.com
The percentage of stocks trading above a specific moving average is a market breadth indicator that helps determine the underlying strength or weakness. The percentage of stocks on the Nasdaq above the 50-day Moving Average is rising, closing at 47.08%, higher than early in November, now at its highest reading since August but not yet at an extreme level.
Upside reversal in Small Caps.
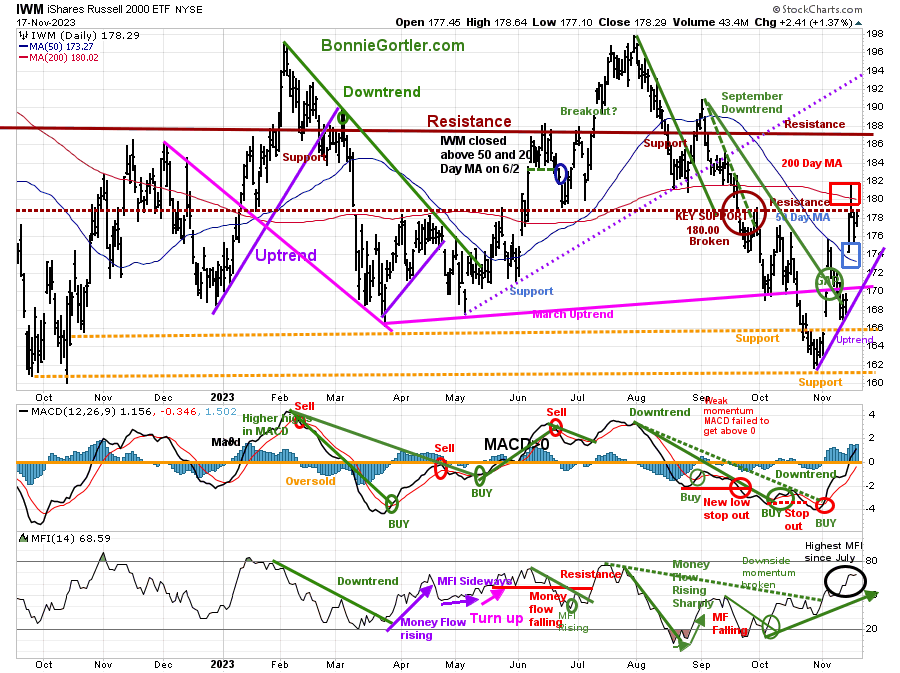
Figure 10: Daily iShares Russell 2000 (IWM) Price (Top) and 12-26-9 MACD (Middle and Money Flow (Bottom)
111723 IWM Daily
Source: Stockcharts.com
The top chart is the daily iShares Russell 2000 Index ETF (IWM), the benchmark for small-cap stocks, with a 50-Day Moving Average (MA) (blue line) and 200-Day Moving Average (MA) (red line) that traders watch and use to define trends.
IWM reversed higher last week, leading the broad market higher, now in an uptrend, closing at 178.29 above resistance at 170.00 and 176.00, up +5.43%. IWM closed above the 50-day MA and tested the 200-day MA (blue rectangle) but closed a few points below.
Support is at 176.00, 170.00, 166.00, and 161.00. Resistance is at 182.00, 188.00, and 194.00.
MACD (middle chart) remains on a buy, above 0, and has shown strength since breaking the August downtrend.
Money Flow (lower chart) is positive and at its highest since July (black circle).
Keep an eye on the Russell 2000 (IWM) for a clue for this week if it strengthens, showing leadership and stronger than the S&P 500, which would be positive, or if IWM lags, which would be a short-term negative.
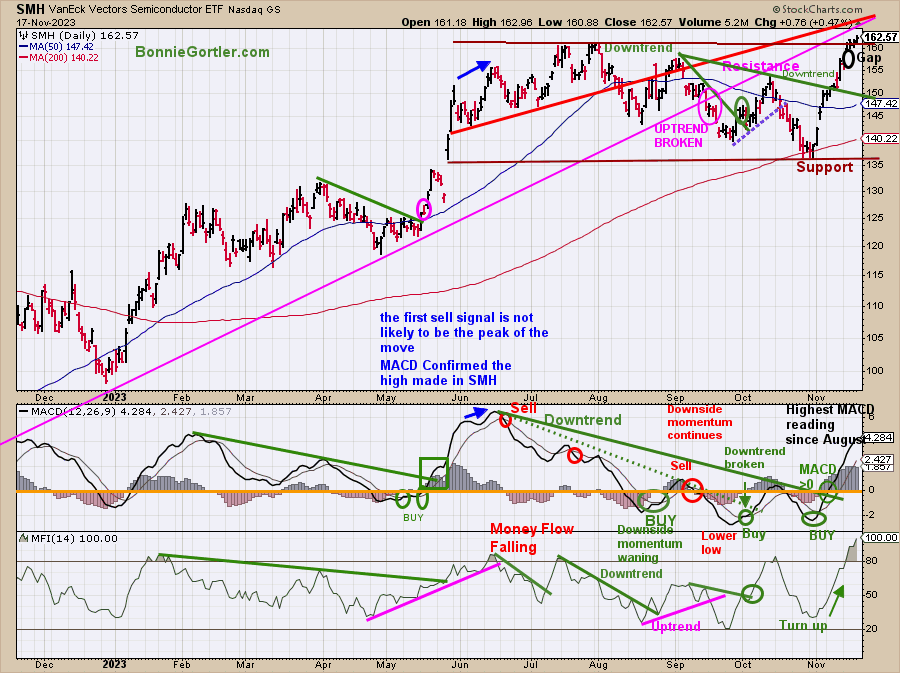
Figure 11: Daily Semiconductors (SMH) (Top) and 12-26-9 MACD (Middle) and Money Flow (Bottom)
111723 SMH Daily
Source: Stockcharts.com
The top chart shows the Daily Semiconductors (SMH) ETF, concentrated mainly in US-based Mega-Cap Semiconductors companies. SMH tends to be a lead indicator for the market when investors are willing to take on increased risk and the opposite when the market is falling.
Semiconductors (SMH) had its third straight week of solid gains, up +3.36%, closing at 162.57.
Support is at 155.00, 150.00, 140.00, and 135.00. Resistance is at 160.00. Short-term objective is185.00.
MACD (middle chart) is on a buy, rising after breaking the June downside momentum trendline (green line) at its highest MACD reading since August.
Money Flow (lower chart) continues to rise to the highest level in 2023 after confirming the MACD buy and implying strong interest in Semiconductors.
Technology remains a leader in the advance.
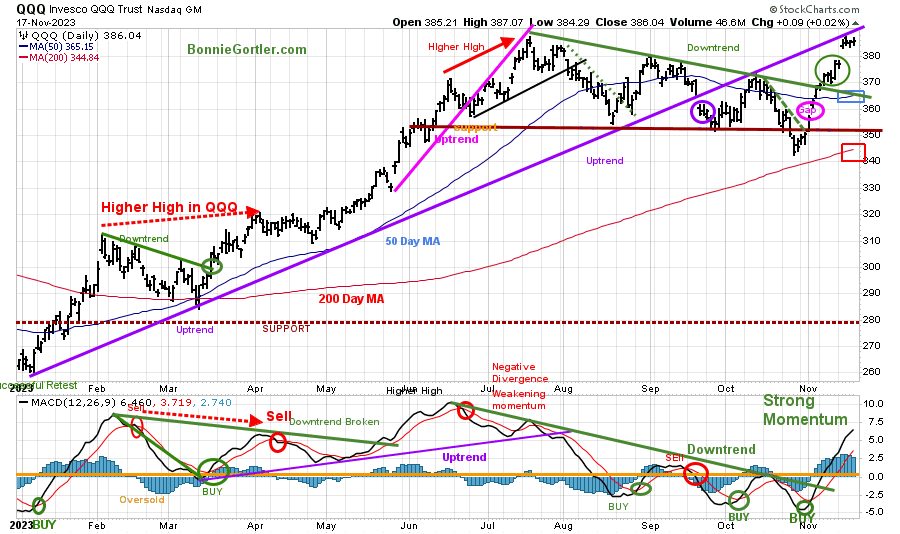
Figure 12: Daily Invesco QQQ Trust (QQQ) Price (Top) and 12-26-9 MACD (Bottom)
111723 QQQ Daily
Source: Stockcharts.com
The chart shows the daily Invesco QQQ, an exchange-traded fund based on the Nasdaq 100 Index. QQQ made a low in October 2022 (red circle), followed by a successful retest of the low in early January 2023 and the start of an uptrend.
QQQ broke the July downtrend (green line) and did not look back, continuing higher.
Last week the Nasdaq 100 (QQQ) gained +2.02%, closing at 386.04. QQQ remains above the 50-day Moving Average (blue rectangle) and the 200-day Moving Average (red rectangle), a sign of underlying strength.
Support is 380.00, 376.00, 365.00, and 350.00, with resistance at 390.00.
The bottom chart, MACD (12, 26, 9), remains on a buy, above 0 and rising at its highest reading since a sign of strength.
It’s bullish that the gap (pink circle) remains, not filled from last week. Any strength early in the week will force more shorts to cover, fueling QQQ to move higher.
Figure 13: The S&P 500 Index (SPY) Daily (Top) and 12-26-9 MACD (Bottom)
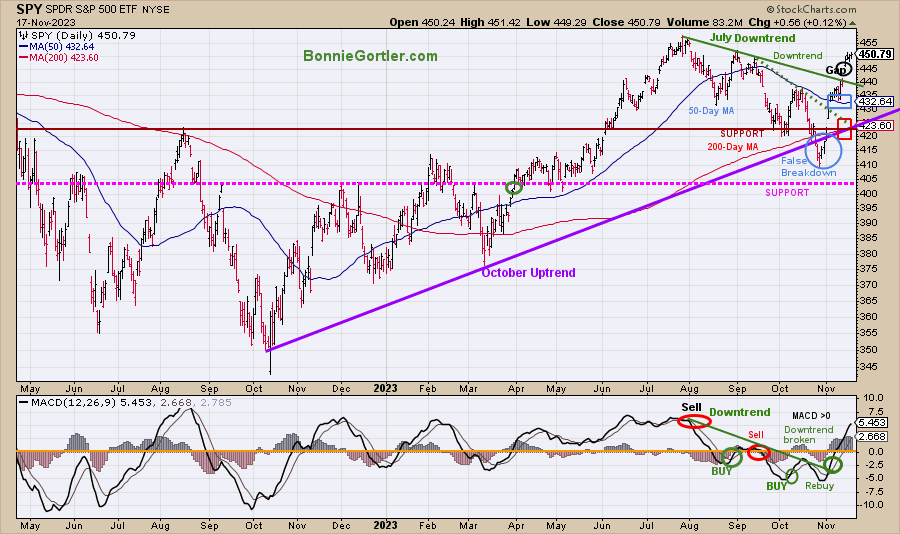
111723 SPY Daily
Source: Stockcharts.com
The S&P 500 (SPY) had a false breakdown (blue circle) in October after being in an uptrend (purple line). Two downtrends were in effect: the September downtrend (green dotted line) broken the previous week and the August (green solid line) downtrend where the SPY closed.
SPY continued higher, closing at 450.79, up +2.31% for the week, above resistance at 446.00 and the 50-day Moving Average (blue rectangle) and the 200-day Moving Average (red rectangle), a sign of strength.
Resistance is at 452.00 and 455.00. Support is at 440.00, 433.00, 425.00, and 405.00.
MACD (bottom chart) is on a buy above 0, rising sharply after breaking the August momentum downtrend (green line), which is bullish
Higher prices will continue if SPY remains above last week’s low of 438.42.
Figure 14: S&P 500 Percent of Stocks Above 50-Day Moving Average
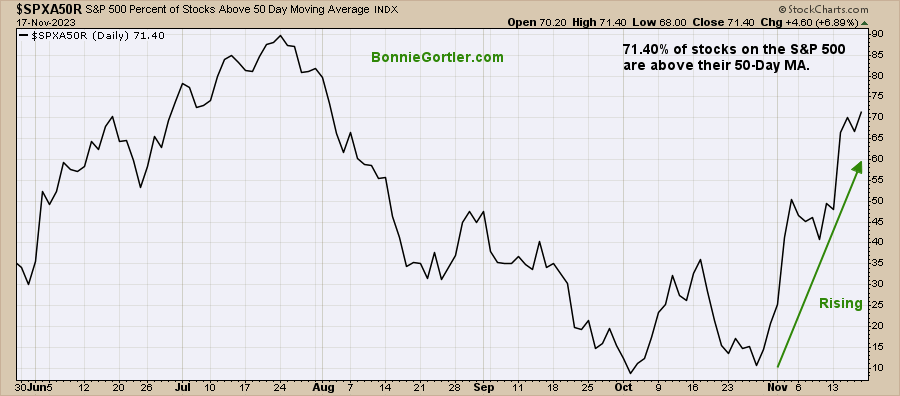
111723 S&P 500 Percent of Stocks Above 50-Day Moving Average
Source: Stockcharts.com
The percentage of stocks trading above a specific moving average is a market breadth indicator that helps determine the underlying strength or weakness.
The percentage of stocks on the S&P 500 above the 50-day Moving Average is rising, closing at 71.40%, gaining strength, higher than early in November, now at its highest reading since August.
Summing Up:
Market technicals are strengthening. The major market averages continued to climb as the rally broadened with more sectors participating. The Nasdaq and S&P 500 showed gains for the third consecutive week, closing near their weekly highs. Market breadth improved significantly, the Russell 2000 outperformed the S&P 500, short-term momentum patterns are improving, and a bullish double bottom in the Nasdaq AD-Line. Continue to give the bulls the benefit of the doubt until proven otherwise.
Remember to manage your risk, and your wealth will grow.
Let’s talk investing. You are invited to set up your Free 30-minute Wealth and Well-Being Strategy session by clicking here or emailing me at Bonnie@BonnieGortler.com. I would love to schedule a call and connect with you.
Disclaimer: Although the information is made with a sincere effort for accuracy, it is not guaranteed that the information provided is a statement of fact. Nor can we guarantee the results of following any of the recommendations made herein. Readers are encouraged to meet with their own advisors to consider the suitability of investments for their own particular situations and for determination of their own risk levels. Past performance does not guarantee any future results.


Create more wealth in your life
with these simple strategies.
As an added bonus you will also
receive BG’s Updates and Ezine

Discover how to quickly create more well-being in your life with these simple strategies.
As an added bonus you will also
receive BG’s Updates and Ezine

As an added bonus you will receive BG’s Updates and Ezine

All work listed on BonnieGortler.com is licensed under a Creative Commons Attribution - Noncommercial - No Derivative Works 3.0 Unported License.


Free Report:
Grow and Sustain Your Wealth
Discover how to grow your money with these easy, simple steps.

