

10 Simple Tips for Financial Well-Being
07/01/2026
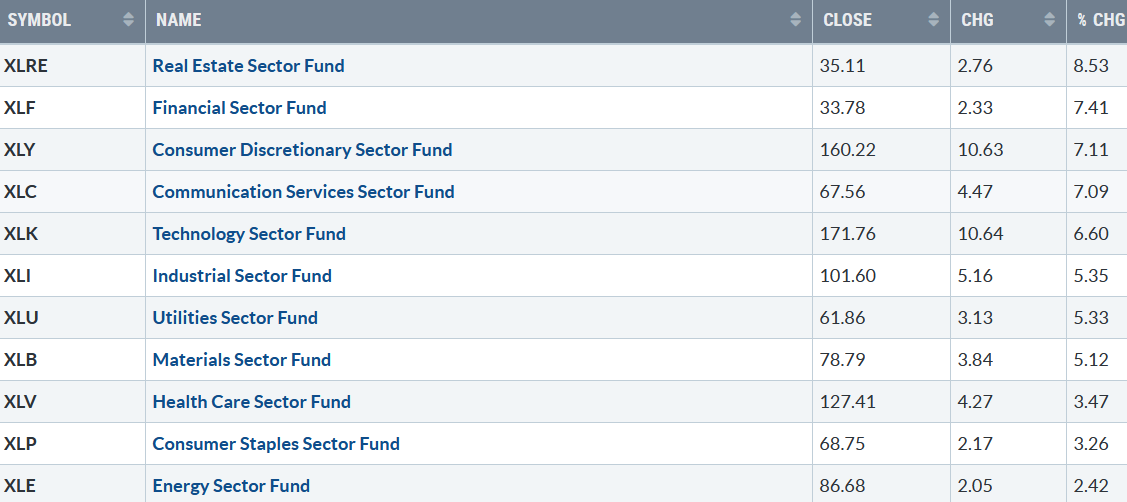
A solid week of gains last week, with all S&P SPDR sectors moving higher. Real Estate (XLRE) and Financials (XLF) were the best sectors, while Consumer Staples (XLP) and Energy (XLE) were the weakest. The SPDR S&P 500 ETF Trust (SPY) gained +5.85%.
S&P SPDR Sector ETFs Performance Summary 10/27/23-11/3/23
110323 SPDR Sectors
Source: Stockcharts.com
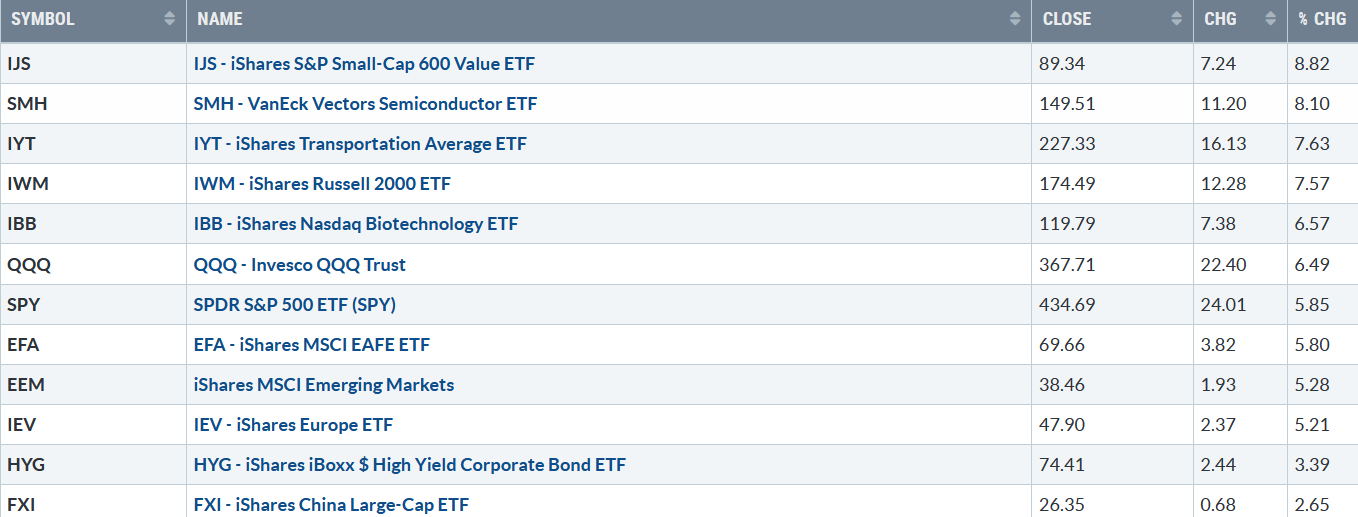
Figure 2: Bonnie’s ETFs Watch List Performance Summary 10/27/23-11/3/23
110323 Week ETFs
Source: Stockcharts.com
Small Cap Value and Growth, Semiconductors, Transports, and Technology led the way, all stronger than the S&P 500. International markets were strong, and Hi Yield Bonds showed strength, implying investors are willing to take on increased risk.
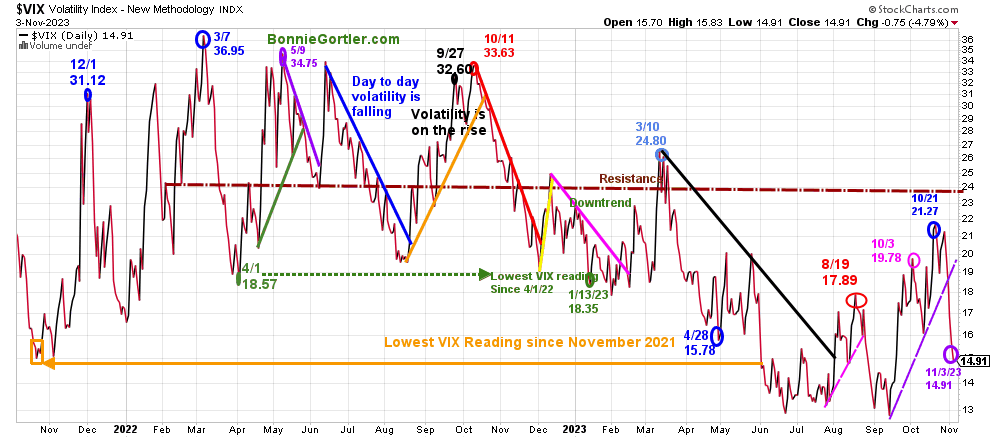
Figure 3: CBOE Volatility Index VIX
110323 VIX Daily
Source: Stockcharts.com
The CBOE Volatility Index (VIX), a measure of fear, traded above 20.00 for most of 2022, with a high at 36.95 on 3/7 (blue circle). A new VIX low did not occur until 1/13/23 at 18.35 (green circle) after peaking in October 2022 at 33.63 (red circle).
VIX fell sharply, 30%, one of the largest weekly declines in history, closing the week at its low, 14.91 (purple circle). If the VIX remains below 18, look for intraday volatility contained.
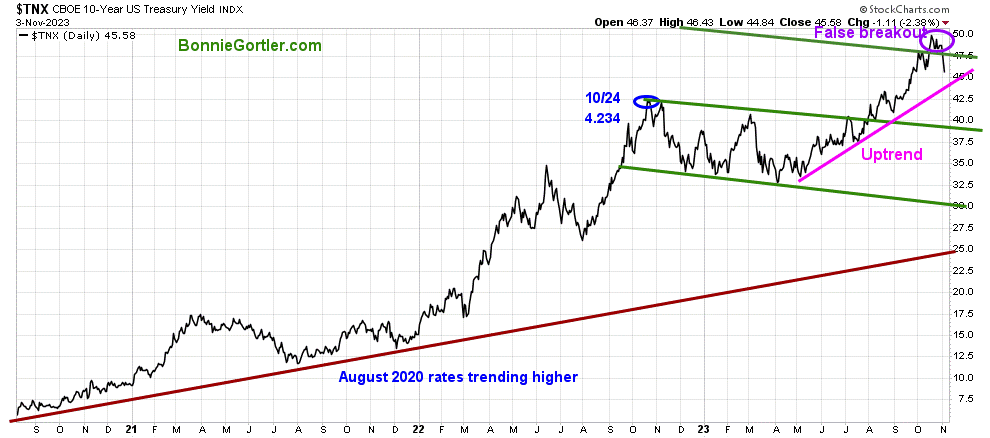
Figure 4: UST 10YR Bond Yields Daily
110323 UST 10 Yr Bond Yields Daily
Source: Stockcharts.com
The 10-year U.S. Treasury yields closed sharply lower last week at 4.558% in volatile trading, remaining in the May uptrend (pink line), pulling back from the top of the channel (top green line) and closing below. A further drop in yields breaking the May uptrend would be short-term positive.
Last week, the major market averages rocked. The Dow gained +5.07%, the S&P 500 gained +5.85%, Nasdaq +6.61%. The Russell 2000 Index, which has been lagging, was the leader last week, up 7.56%.
Are you interested in learning about the stock market in the comfort of your home? Learn how to implement a powerful wealth-building mindset and simple, reliable strategies to help you Grow Your Wealth. Learn more here: https://bonniegortler.lpages.co/wealth-made-simple-ecourse/.
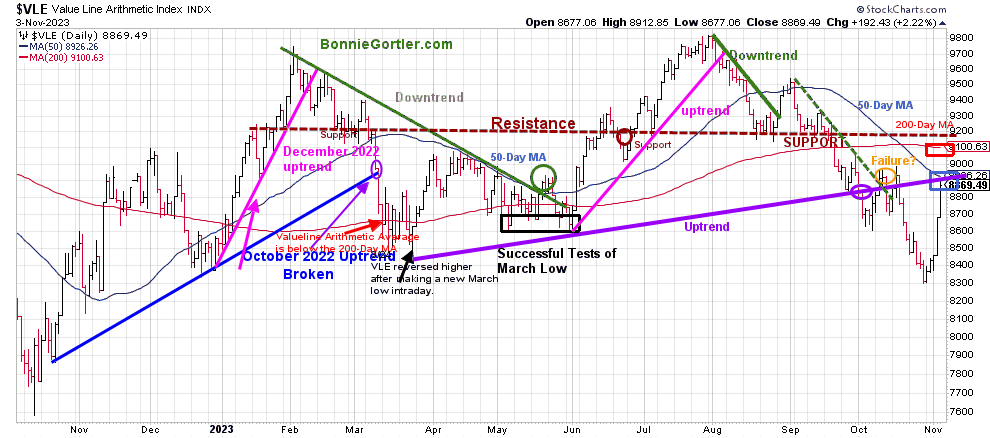
Figure 5: Value Line Arithmetic Average
110323 VLE Daily
Source: Stockcharts.com
The Value Line Arithmetic Index ($VLE) is a mix of approximately 1700 stocks. VLE broke the October 2022 uptrend in early March 2023 (blue line), and April, May, and June successfully tested the March low and ultimately made a new low in October 2023.
VLE rose sharply last week, closing at 8869.49, up +6.73%, a decisive advance, but closed slightly under the 50-day MA (blue rectangle) at 8926.26 as of 11/3/23, and below the 200-day MA (red rectangle).
Support is 8700. 8600 and 8300. Resistance is at 8900, 9100, and 9300.
VLE closed just under the uptrend line where VLE broke down (purple line). If VLE stalls now, this would be a short-term negative. However, further strength in VLE would imply a broadening of the advance and be short-term positive. A close above both Moving Averages would be favorable and lead to a potential test of September’s high.
Do you want to go deeper into charting? Learn more in the comfort of your home today with my Free 33-minute Training, Charting Strategies to Cut Risk and Trade with the Trend. Sign up here.
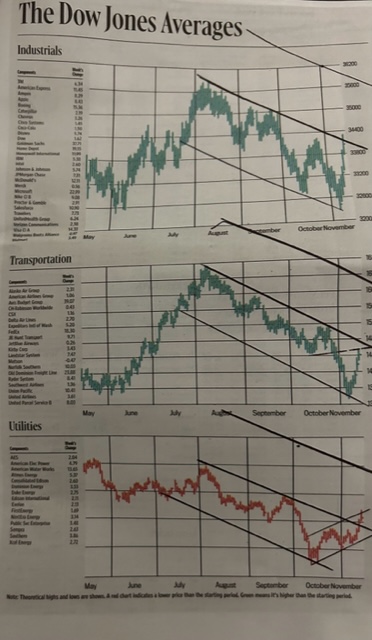
Figure 6: Barron’s 11/3/23 The Dow Jones Averages
110323 Dow Jones Averages Barrons
Source: Barron’s 11/3/23
Above are Dow Jones Averages, the Industrials, Transportation, and Utilities with trendlines using a ruler and a pen-like when I started charting in 1982.
The Industrials, Transportation, and Utilities were all in downtrends since July. It’s a positive sign the Dow and Utilities broke the downtrend last week.
Keep an eye out for the Transportation Average to break the July downtrend this week, confirming the likelihood of the advance continuing toward the top of the trading channels.
Market breadth improves
Weekly market breadth was positive on the New York Stock Exchange Index (NYSE) and for the Nasdaq. The NYSE had 2665 advances and 347 declines, with 122 new highs and 424 new lows. There were 3634 advances and 1095 declines on the Nasdaq, with 137 new highs and 858 new lows.
Daily Market breadth had more advancing stocks each day on the NYSE and Nasdaq, the best breadth seen in many months. The indicators I track generated a short-term breadth thrust, implying the potential for the rally to continue and not a time to be short the market.
If you want to go more in-depth with charts, I invite you to join my FB group, Wealth Through Market Charts.
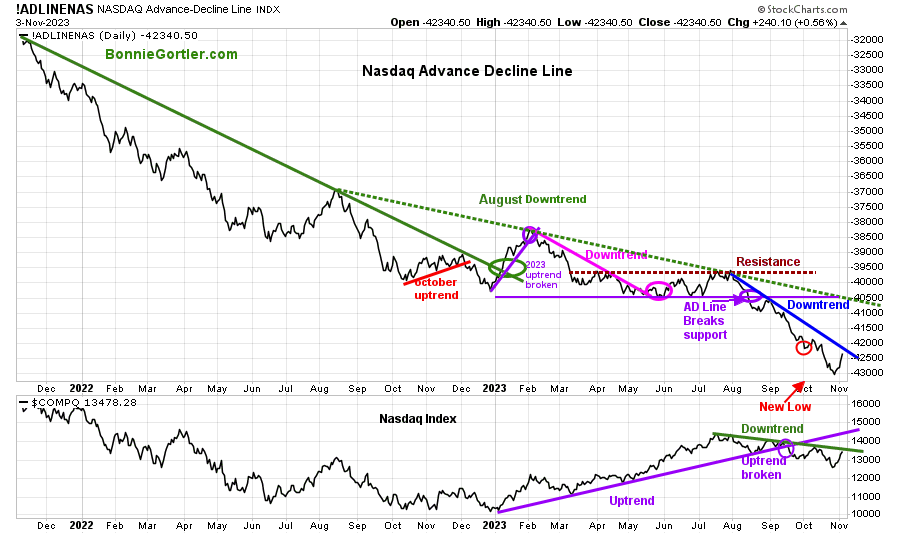
Figure 7: Nasdaq Advance Decline Line Daily (Top) and Nasdaq (Bottom)
110323 Daily Nasdaq Cumulative Advance-Decline Line (2)
Source: Stockcharts.com
The top chart is the Nasdaq Daily Advance-Decline Line, a technical indicator that plots the difference between the number of advancing and declining stocks. In January 2023, the October 2022 downtrend was broken (solid green line) but quickly reversed lower in February 2023, when most of the stock participation was the large Mega Cap Stocks.
The AD-Line (top chart) broke support (purple circle) in August, making a new low in October. The AD-Line (top chart) is positioned to break the August downtrend (blue line) if market breadth continues to improve this week, which would be favorable.
The Nasdaq (lower chart) rose sharply last week but remains in a downtrend from July (green line). Further gains in Nasdaq breaking the price downtrend and positive market breadth, breaking the AD line, would imply a likelihood of higher prices over the next several weeks.
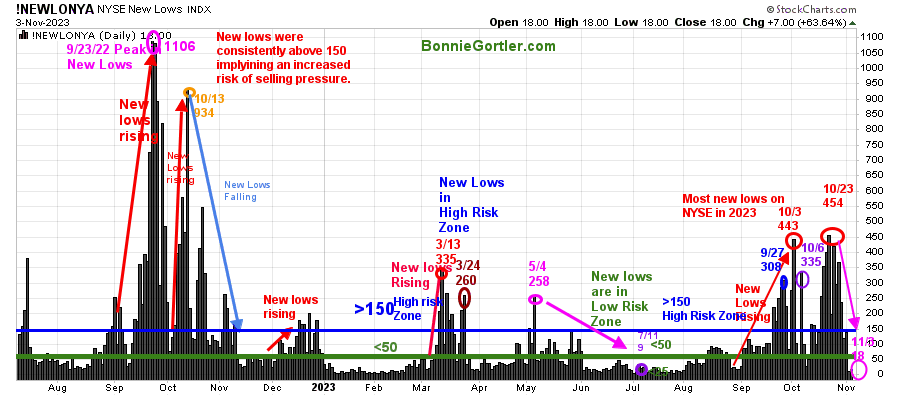
Figure 8: Daily New York Stock Exchange (NYSE) New Lows
110323 NYSE New Lows Daily
Source: Stockcharts.com
Watching New Lows on the New York Stock Exchange is a simple technical tool that helps awareness of the immediate trend’s direction. New lows warned of a potential sharp pullback, high volatility, and “panic selling” for most of 2022, closing above 150. The peak reading was 9/23/22 when New Lows made a new high of 1106 (pink circle), and New Lows expanded to their highest level in 2023 on 3/13/23 (red circle) to 335.
New Lows increased in September (red arrow on the right) toward the high-risk zone greater than 150, peaking at 443 on 10/3, the highest reading since October 2022.
New lows had stopped accelerating in early October. However, the decline was not complete until the end of the month as New Lows made only a slight new high, peaking at 454 (red circle) on 10/23.
There was a significant change in New Lows last week. New lows contracted sharply, closing Friday, 11/4, at 18 (pink circle), now in the lowest risk zone <25 after spending much of October in the highest risk zone >150.
It will be a positive sign if the New Lows remain between 25 and 50, not rising above 150, which would be a warning sign of potential weakness.
Learn more about the significance of New Lows in my book, Journey to Wealth, published on Amazon. If you would like a preview, get a free chapter here.
Small Caps look better.
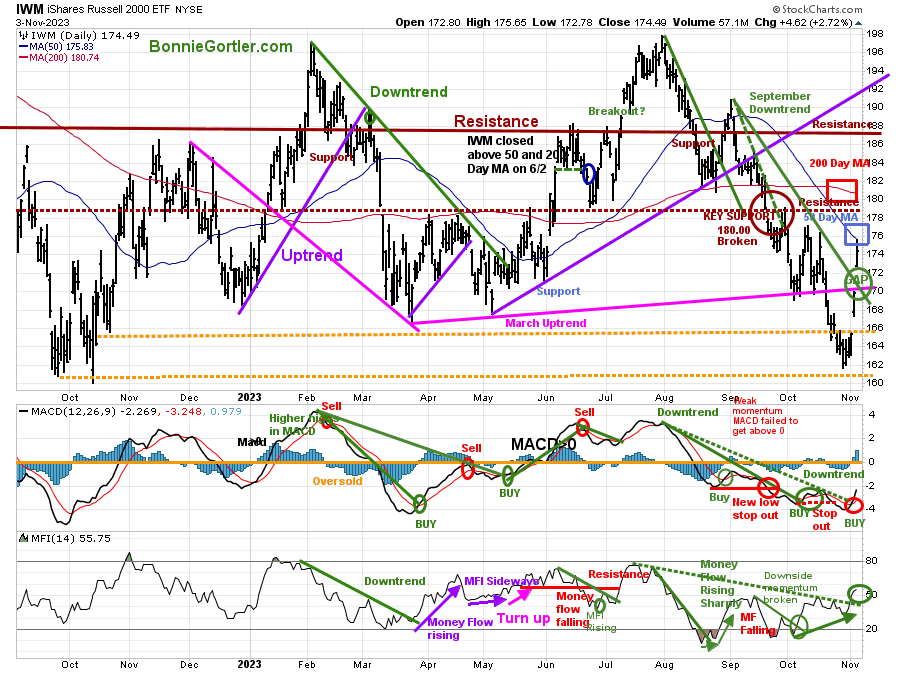
Figure 9: Daily iShares Russell 2000 (IWM) Price (Top) and 12-26-9 MACD (Middle and Money Flow (Bottom)
110323 IWM Daily
Source: Stockcharts.com
The top chart is the daily iShares Russell 2000 Index ETF (IWM), the benchmark for small-cap stocks, with a 50-Day Moving Average (MA) (blue line) and 200-Day Moving Average (MA) (red line) that traders watch and use to define trends.
IWM rocked last week, leading the broad market higher, closing at 174.49, up +7.57%, breaking the September downtrend gapping (green circle) up on Friday but closed slightly below the 50-day MA, which closed at 175.83 and below the 200-day MA (blue rectangle).
Support is at 170.00, 166.00, and 161.00. Resistance is at 176.00, 182.00, and 188.00.
MACD (middle chart generated a buy last week after two previous buys slopped out. MACD is rising and below 0. It’s positive the August downtrend was broken last week.
Money Flow (lower chart) is positive, rising, turning up after forming a positive divergence (a higher low as IWM made a lower low) and breaking the downtrend (green dotted line) since August.
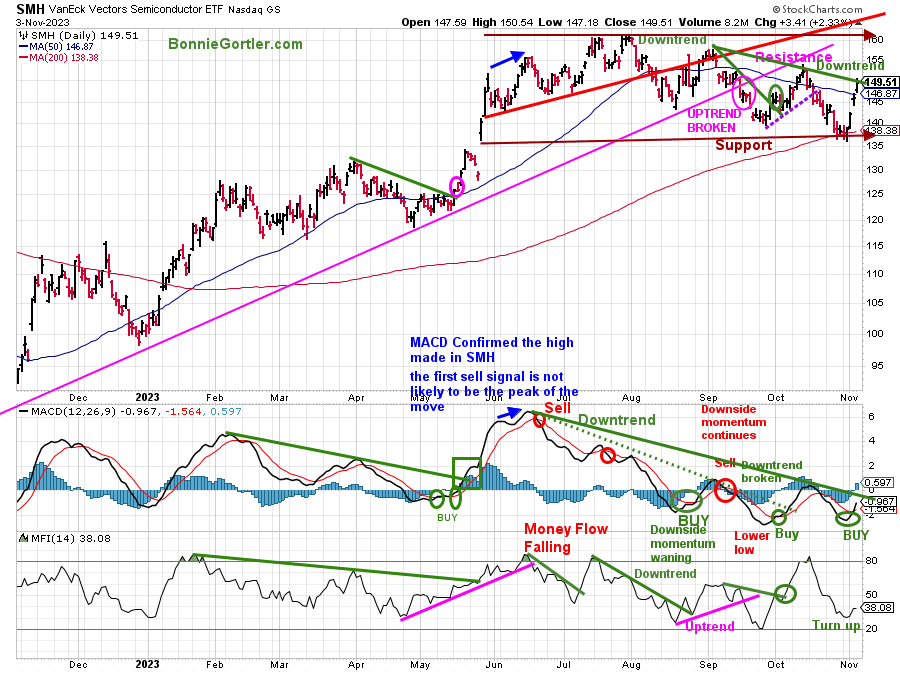
Figure 10: Daily Semiconductors (SMH) (Top) and 12-26-9 MACD (Middle) and Money Flow (Bottom)
110323 SMH Daily
Source: Stockcharts.com
The top chart shows the Daily Semiconductors (SMH) ETF, concentrated mainly in US-based Mega-Cap Semiconductors companies. SMH tends to be a lead indicator for the market when investors are willing to take on increased risk and the opposite when the market is falling.
Semiconductors (SMH) gained +8.10%, leading the market higher.
Support is at 145.00, 140.00 and 135.00. Resistance is at 151.00, 155.00, and 160.00.
MACD (middle chart) is on a buy and has broken the June downside momentum trendline (green line).
Money Flow (lower chart) is rising and breaking the July downtrend (green dotted line), confirming the MACD buy and implying strong interest in Semiconductors for the first time since early October.
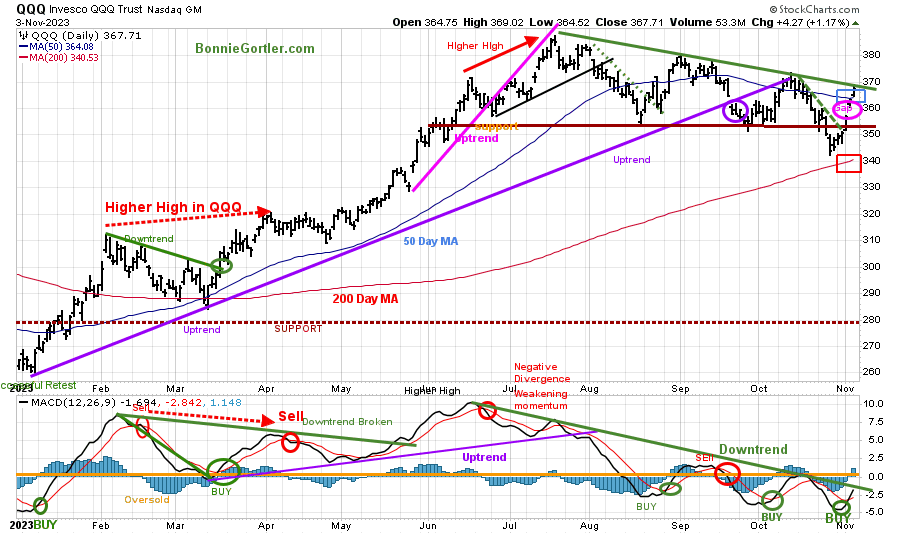
Figure 11: Daily Invesco QQQ Trust (QQQ) Price (Top) and 12-26-9 MACD (Bottom)
110323 QQQ Daily
Source: Stockcharts.com
The chart shows the daily Invesco QQQ, an exchange-traded fund based on the Nasdaq 100 Index. QQQ made a low in October 2022 (red circle), followed by a successful retest of the low in early January 2023 and the start of an uptrend.
QQQ had its first positive week in the last four, breaking its 2023 uptrend (purple circle) after a few attempts at the July high.
Last week QQQ gained +6.49% at 367.71, closing slightly below July’s downtrend (green line). However, the gains were strong enough to close above the 50-day Moving Average (blue rectangle) and remain above the 200-day Moving Average (red rectangle).
Support is 365.00, 355.00, and 340.00, with resistance at 372.00, 375.00, and 380.00.
The bottom chart, MACD (12, 26, 9), is on a buy, buy, and now close to a break of the June momentum downtrend (green line).
I would like to see the QQQ gap (pink circle) remain unfilled, and QQQ continue to rise above 372.00, with MACD breaking the June downtrend and then rising above 0.
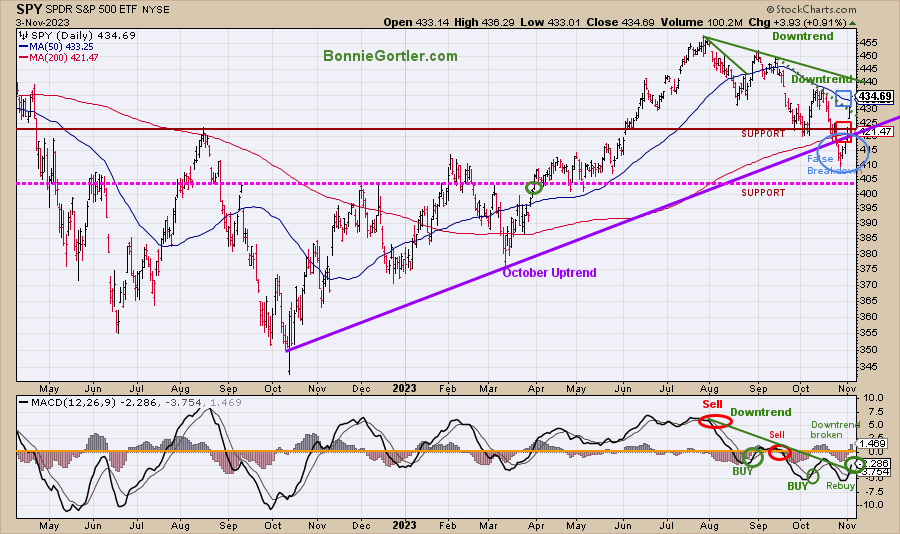
Figure 12: The S&P 500 Index (SPY) Daily (Top) and 12-26-9 MACD (Bottom)
110323 SPY Daily
Source: Stockcharts.com
The S&P 500 SPY had a false breakdown (blue circle) last month after being in an uptrend (purple line). Two downtrends were in effect, one broken last week and the other not far from being penetrated.
Last week, the SPY was explosive, up +5.85%, closing at 434.69, slightly above the 50-day Moving Average (blue rectangle) and above the 200-day Moving Average (red rectangle).
Resistance is 439.00, 446.00, and 452.00. Support is at 425.00, 418.00, 410.00 and 402.00.
MACD (bottom chart) is on a buy below 0, rising and breaking the August downtrend in momentum (green line).
Last week’s reversal after a false breakdown is bullish. Higher prices are likely if SPY moves above resistance at 439.00, making its first higher high since July.
Summing Up:
Last week, the bulls took control, a sharp reversal to the upside forcing many bears to cover their shorts. A broad rally led by small caps, all S&P SPDR sectors higher, with the major averages closing near their highs, the best week in a year. Market breadth improved substantially, generating bullish short-term upside thrusts, implying higher prices. Watch this week for favorable market breadth, the Russell 2000 outperforming the S&P 500, Semiconductors strong, and Transportation gaining strength. With the tape action improving, give the bulls the benefit of the doubt, helped by November, the second-best monthly performance historically.
Remember to manage your risk, and your wealth will grow.
Let’s talk investing. You are invited to set up your Free 30-minute Wealth and Well-Being Strategy session by clicking here or emailing me at Bonnie@BonnieGortler.com. I would love to schedule a call and connect with you.
Disclaimer: Although the information is made with a sincere effort for accuracy, it is not guaranteed that the information provided is a statement of fact. Nor can we guarantee the results of following any of the recommendations made herein. Readers are encouraged to meet with their own advisors to consider the suitability of investments for their own particular situations and for determination of their own risk levels. Past performance does not guarantee


Create more wealth in your life
with these simple strategies.
As an added bonus you will also
receive BG’s Updates and Ezine

Discover how to quickly create more well-being in your life with these simple strategies.
As an added bonus you will also
receive BG’s Updates and Ezine

As an added bonus you will receive BG’s Updates and Ezine

All work listed on BonnieGortler.com is licensed under a Creative Commons Attribution - Noncommercial - No Derivative Works 3.0 Unported License.


Free Report:
Grow and Sustain Your Wealth
Discover how to grow your money with these easy, simple steps.

