

10 Simple Tips for Financial Well-Being
07/01/2026
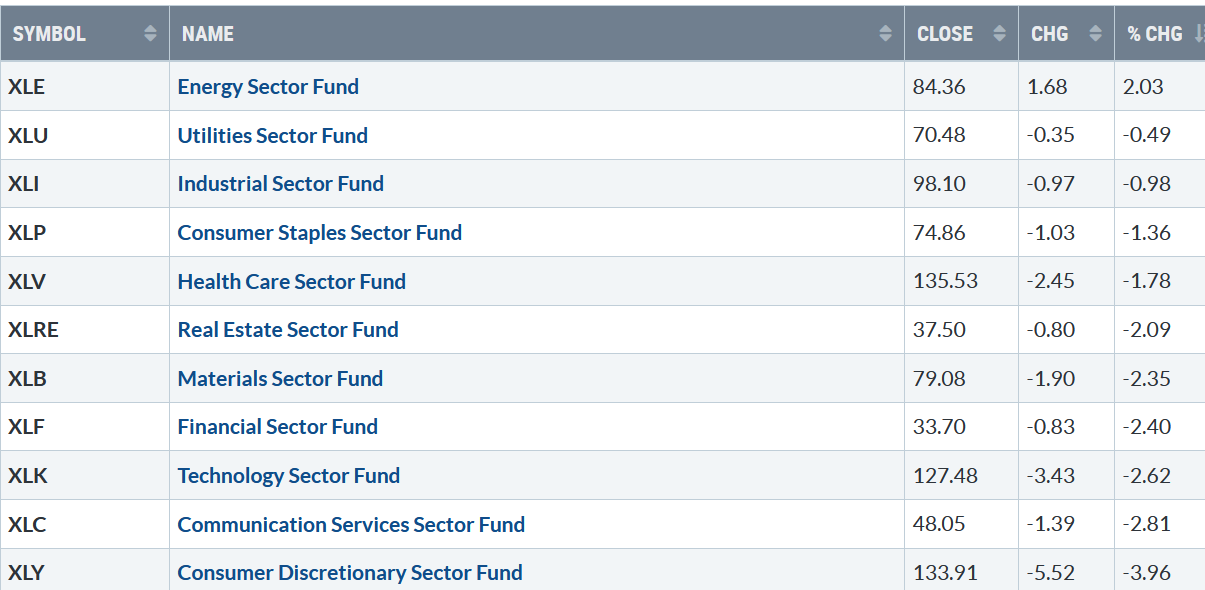
Selling continued last week. Ten of eleven S&P SPDR sectors were lower, with Energy (XLE) bucking the trend, the strongest sector, Communication Services (XLC), and Consumer Discretionary (XLY) were the weakest. The SPDR S&P 500 ETF Trust (SPY) was down -2.10%.
S&P SPDR Sector ETFs Performance Summary
12/09/22 – 12/16/22
121622 Sectors Week
Source: Stockcharts.com
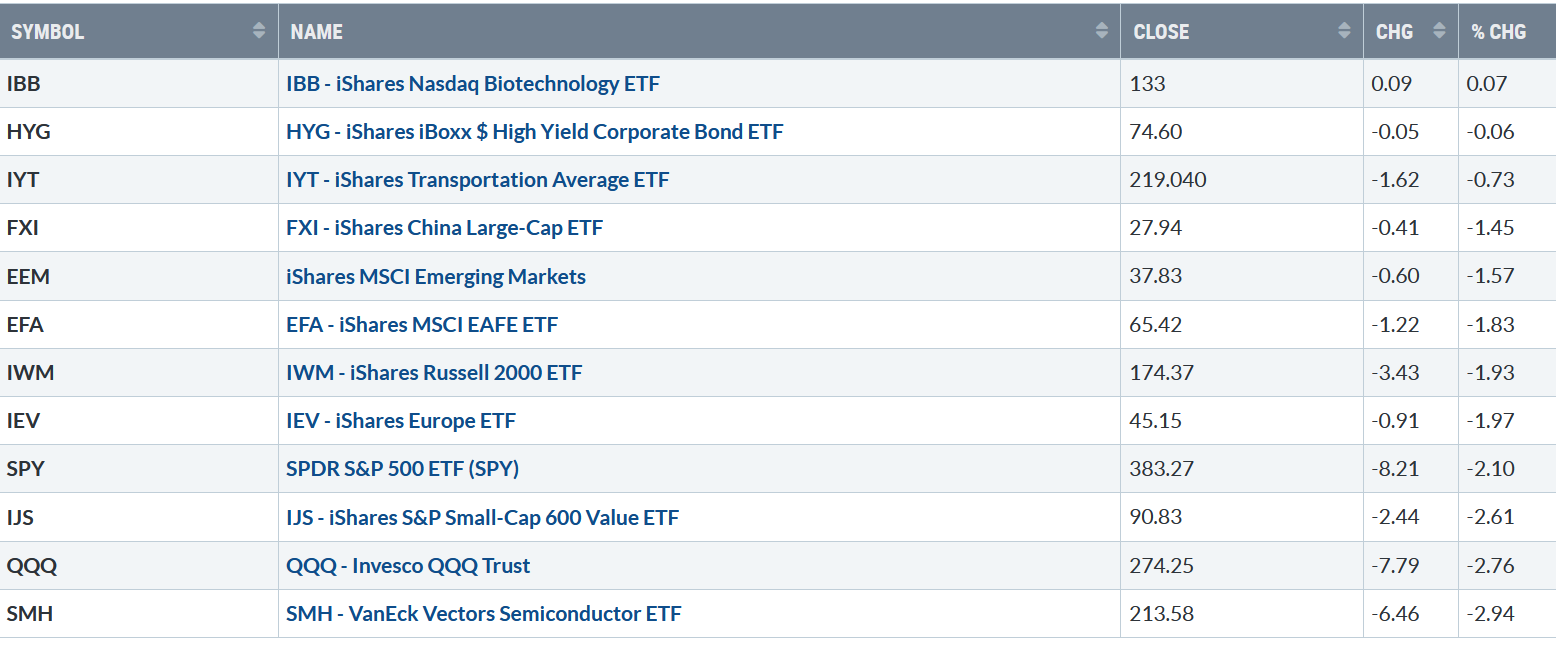
Figure 2: Bonnie’s Mix of ETFs
Performance Summary 12/09/22 – 12/16/22
121622 Week ETFs
Source: Stockcharts.com
Technology and Semiconductors were under selling pressure. International markets, which have gained relative strength vs. U.S. equities in recent weeks, joined in the decline.
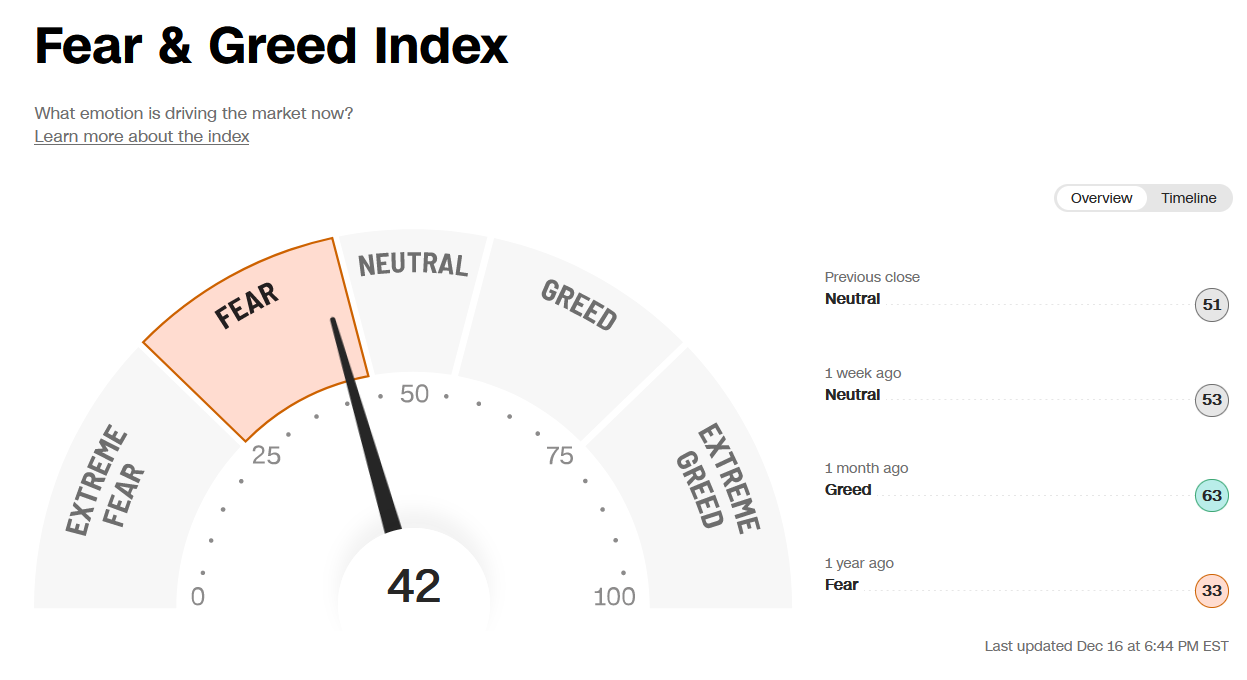
Figure 3: Fear and Greed Index
121622 Fear and Greed Index
Source: CNBC
Based on the CNBC Fear and Greed Index (a contrary indicator), market sentiment quickly fell from neutral to fear as the major averages dropped, closing at 42 last week.
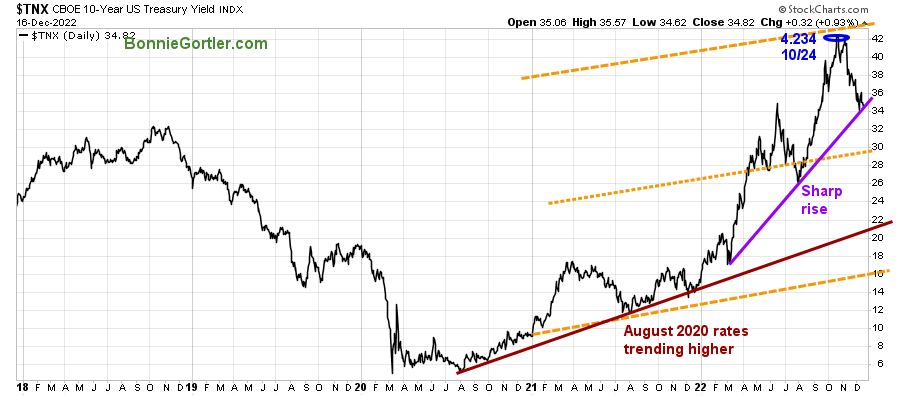
Figure 4: UST 10YR Bond Yields Daily
121622 UST 10 Yr Bond Yields Daily
Source: Stockcharts.com
The 10-Year U.S. Treasury yields fell, closing at 3.480%, remaining in an uptrend (purple line), with support at 2.90%.
Selling continued last week.
The major averages fell, with the Dow falling -1.66%, S&P 500 down -2.08%, and the Nasdaq falling -2.72%. The Russell 2000 Index was even weaker, down -1.85%, and the Value Line Arithmetic Index (a mix of approximately 1700 stocks) fell -1.87%.
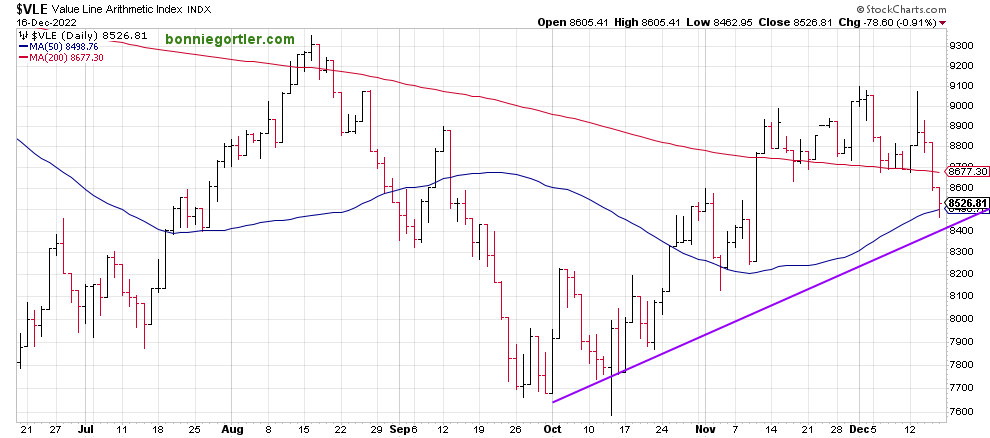
Figure 5: Value Line Arithmetic Index
121622 Valueline Arithmetic Average
Source: Stockcharts.com
It is encouraging that the Value Line Arithmetic Index remains in an uptrend. However, a close below 8400 would imply lower prices in the short term. On the other hand, a close above 8700 would indicate higher prices.
Market breadth is not improving.
Weekly market breadth was negative on the New York Stock Exchange Index (NYSE) and Nasdaq. The NYSE had 1139 advances and 2190 declines, with 187 new highs and 273 new lows. There were 1979 advances and 3251 declines on the Nasdaq, with 343 new highs and 821 new lows.
Nasdaq breadth remains in its 2022 downtrend.
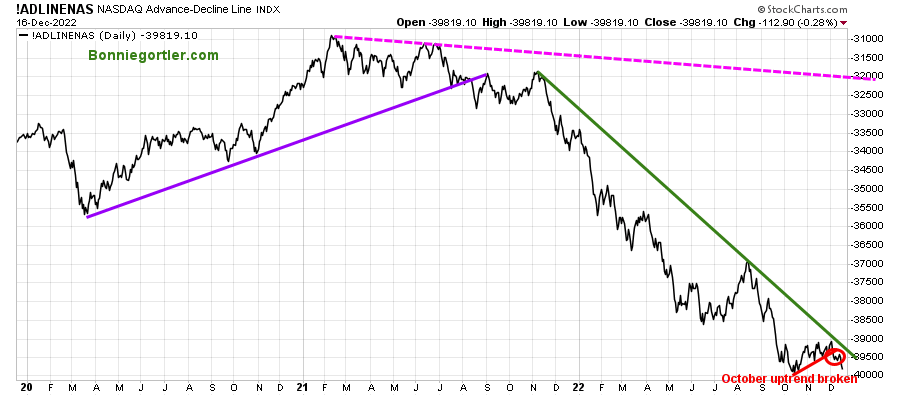
Figure 6: Nasdaq Advance Decline Line Daily
121622Nasdaq AD Line Daily
Source: Stockcharts.com
It’s negative early in December Nasdaq breadth failed to break above the 2022 downtrend and broke the October uptrend (red line).
WARNING NEW LOWS ON NYSE ARE RISING AND CLOSED ABOVE 150
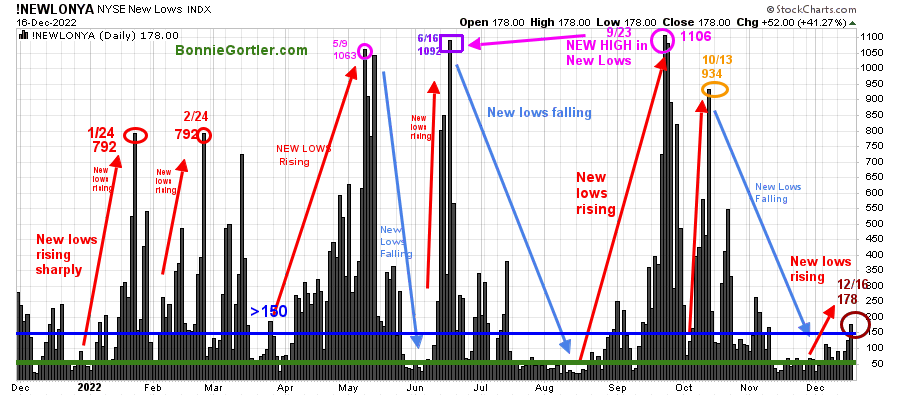
Figure 7: Daily New York Stock Exchange (NYSE) New Lows
12162222 NYSE New Lows
Source: Stockcharts.com
Watching New lows on the New York Stock Exchange is a simple technical tool that helps awareness of the immediate trend’s direction.
New lows warned of a potential sharp pullback, high volatility, and “panic selling” for most of 2022, closing above 150. The peak reading was 9/23 when New Lows made a new high of 1106 (pink circle).
With the latest decline, New Lows are rising to 178 (brown circle), the highest reading since November, no longer trending down, now above 150, in a high-risk area. If new lows remain above 150 and don’t contract, it would be unfavorable in the short term.
Learn more about the significance of New Lows in my book, Journey to Wealth, published on Amazon. If you would like a preview, get a free chapter here.
Small Caps remain weak, which is not a sign of a healthy market.
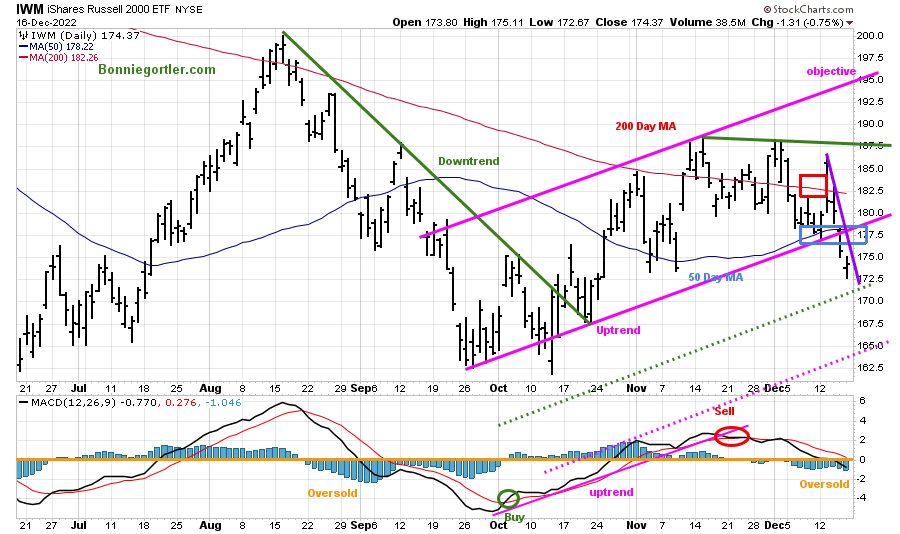
Figure 8: Daily iShares Russell 2000 (IWM) Price (Top) and 12-26-9 MACD (Bottom)
121622 IWM Daily
Source: Stockcharts.com
The top portion of the chart is the daily iShares Russell 2000 Index ETF (IWM), the benchmark for small-cap stocks, with a 50-Day Moving Average (MA) (blue line) and 200-Day Moving Average (MA) that traders watch and use to define trends.
IWM fell, closing at 174.37, down -1.93%, closing below its 200-Day Moving Average (red rectangle), its 50-Day Moving Average (blue rectangle), and closing below channel support at 177.50 (pink line) mentioned in the 12/9/22 market update.
MACD (middle chart) is on a sell, falling, and oversold below 0 (orange line).
Support is at 171.00, followed by 165.00. Short-term resistance is at 177.50, 182.50, 187.00, followed by 195.00.
A close below 165.00 would imply the decline is likely to accelerate.
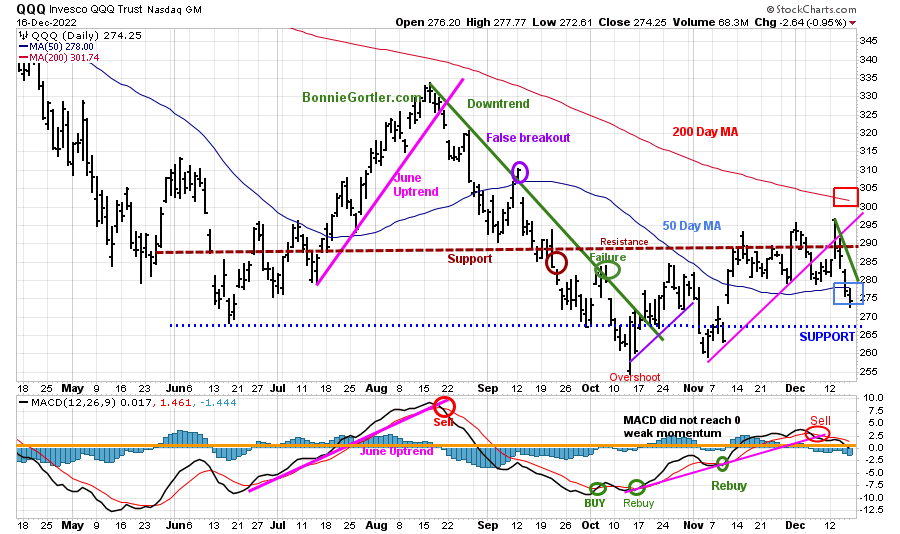
Figure 9: Daily Invesco QQQ Trust (QQQ) Price (Top) and 12-26-9 MACD (Bottom)
121622 QQQ Daily
Source: Stockcharts.com
The chart shows the daily Invesco QQQ, an exchange-traded fund based on the Nasdaq 100 Index. QQQ moved lower after a false break out (purple circle) in September of the August downtrend (green line). In November, QQQ broke its October uptrend (purple line), and the decline continued.
It was encouraging that QQQ was stronger than the Dow and S&P 500 the previous week after breaking above resistance (brown dotted line), but the rally did not last, and QQQ fell sharply -2.76%, closing at 274.25 below support at 280.00, now resistance.
QQQ support is at 266.00 and 260.00, and resistance is at 280.00, 290.00, and 300.00.
The bottom chart is MACD (12, 26, 9) on a sell, momentum weakened and broke its uptrend from October, not showing a good buy pattern yet.
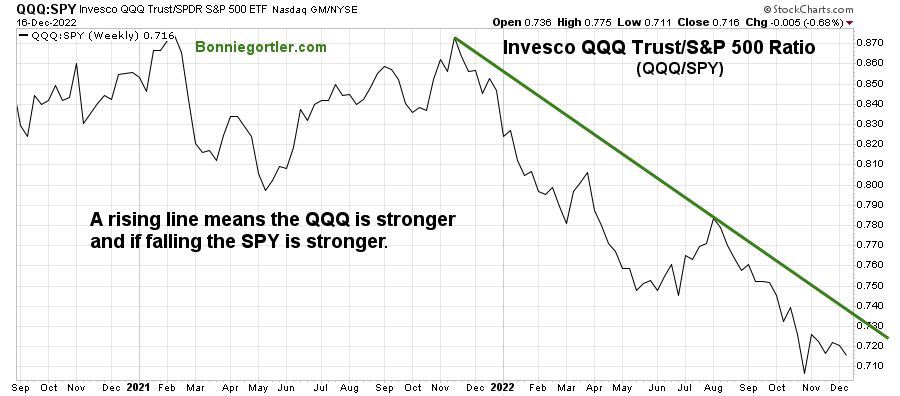
Figure 10: Invesco QQQ Trust/S&P 500 Ratio (QQQ/SPY) WEEKLY
121622 QQQ SPY Relative Strength Ratio Weekly
Source: Stockcharts.com
The top part of the chart is the weekly Invesco QQQ Trust ETF/SPDR S&P 500 (QQQ/SPY) Relative Strength Index Ratio. A rising line means the QQQ is stronger; if falling, the SPY is stronger.
The (QQQ/SPY) ratio peaked in November 2021 and remained in a downtrend. QQQ is weaker than the S&P 500. Expect this to continue over the next several weeks to months until the downtrend breaks.
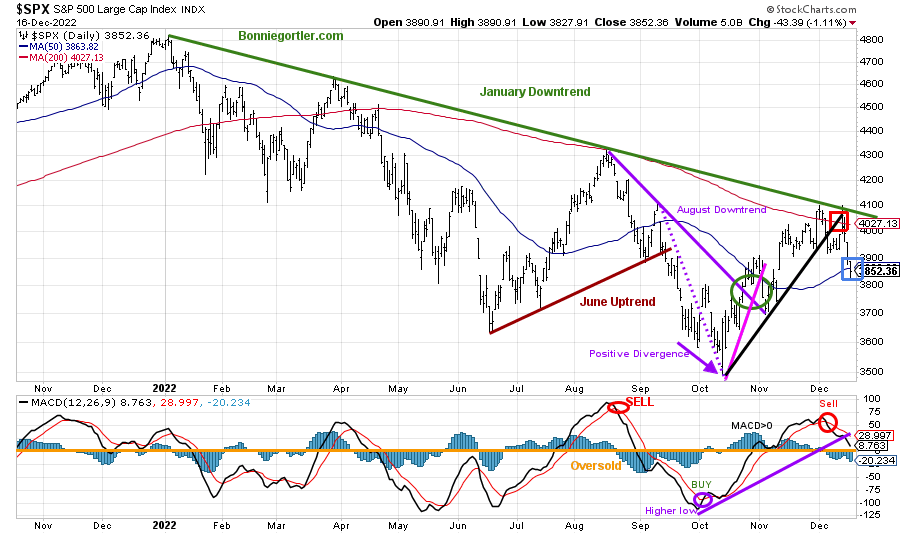
Figure 11: The S&P 500 Index ($SPX) Daily (Top) and 12-26-9 MACD (Bottom)
121622 SPX Daily
Source: Stockcharts.com
The S&P 500 (SPX) 2022 downtrend remains in effect (green line).
The S&P 500 (SPX) failed to get through resistance at 4100 and reversed lower, breaking the October uptrend, which is short-term bearish (black line).
SPX fell -2.08%, closing at 3934.38, below its 50- and 200-Day Moving Average (blue and red rectangle).
Resistance remains at 3900 and 4100, while support is at 3800 and 3700.
MACD, lower chart, remains on a sell last and is not yet oversold in a position to create a buy.
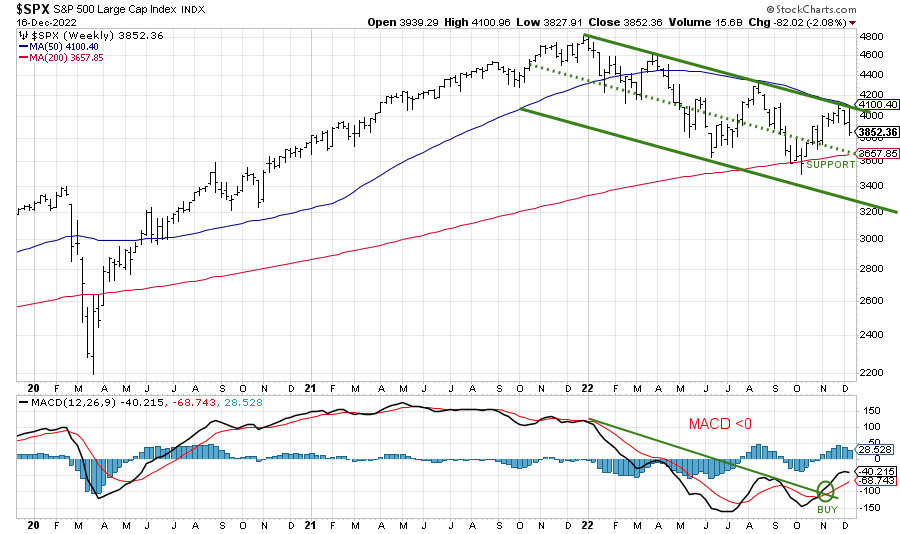
Figure 12: The S&P 500 Index ($SPX) Weekly (Top) and 12-26-9 MACD (Bottom)
Source: Stockcharts.com
The top chart shows the weekly S&P 500 Index ($SPX). SPX peaked in January 2022 and is in a downtrend.
MACD remains on a buy but has not reached 0 all of 2022, which is worrisome.
SPX 3600 is a crucial support area (green dotted line) that needs to hold the middle channel (green dotted line) or expect another leg down towards the bottom channel.
ALL SPDR S&P 500 Sectors are in a downtrend.
Figure 13: SPDR S&P 500 ETF Trust (SPY), (Top) and Materials (XLB), Financials, (XLF), Technology (XLK), and Discretionary (XLY)
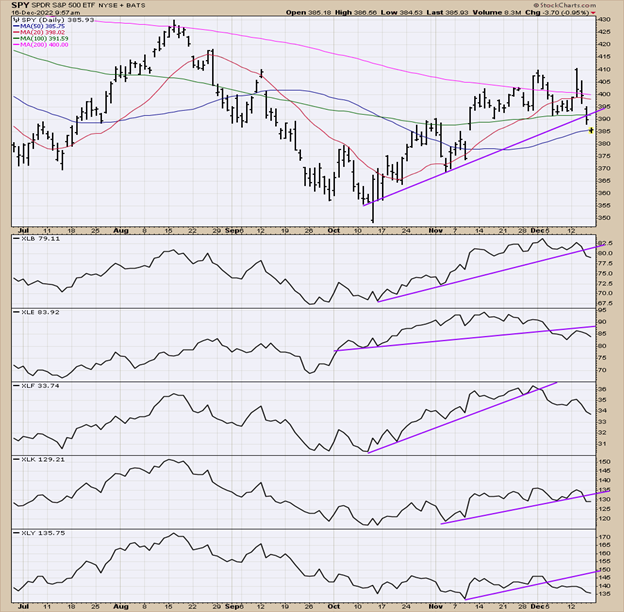
121622 S&P 500 SPDR Sectors XLB XLE XLF XLK XLY
Source: Stockcharts.com
The top chart shows the SPDR S&P 500 (SPY) with the aggressive ETFs of the SPDR sectors, Materials (XLB), Financials (XLF), Technology (XLK), and Discretionary (XLY), all are in a downtrend (purple line).
Figure 14: SPDR S&P 500 (SPY) Top with Utilities (XLU), Health Care (XLV), Staples (XLP), and Real Estate (XLRE)
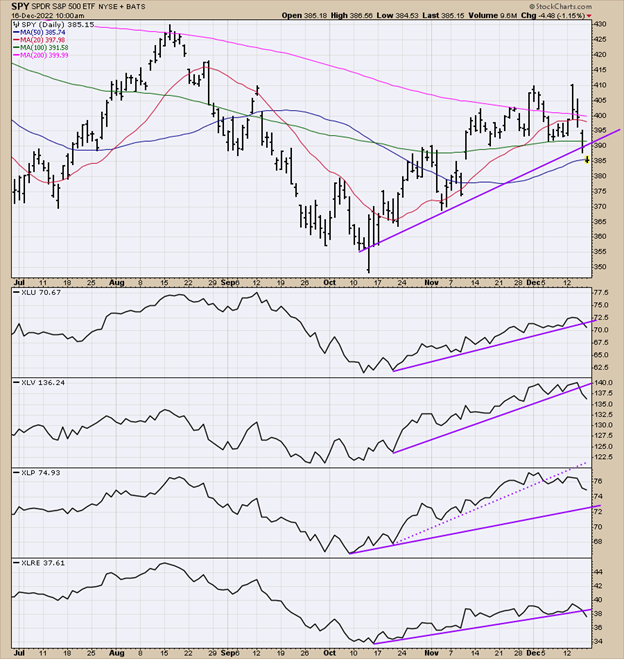
121622 S&P 500 SPDR Sectors XLU XLV XLP XLRE
Source: Stockcharts.com
The top chart shows the SPDR S&P 500 (SPY) with the defensive ETFs of the SPDR sectors, XLU, XLV, XLP, and XLRE below, all in a downtrend.
Both aggressive and defensive sectors are vulnerable to further weakness.
Update on Speculative BUY
Figure 15: SPDR Consumer Discretionary (XLY) (Top), and 12-26-9 MACD (Bottom)
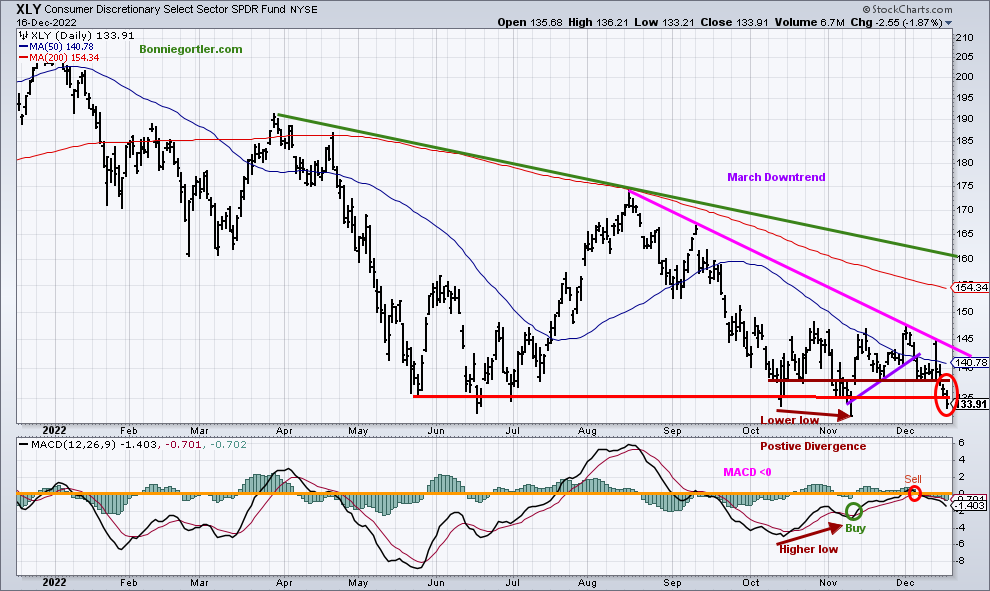
121622 XLY Daily
Source: Stockcharts.com
The SPDR Consumer Discretionary (XLY) appeared ready to break its downtrend from August but turned down, falling -3.96%, closing at 133.91, as XLY top holdings Amazon (AMZN) and Tesla Inc. (TSLA), almost 40% of the holdings fell -16.1% and -1.38%, respectively.
XLY failed at 142.00 resistance and then reversed, breaking through support at 138.00. XLY closed below 135.00, negating my positive outlook, and all positions should be closed.
Summing Up:
A disappointing week with all major averages lower. Investors continued to sell stocks with concerns over inflation and higher interest rates. Volatility is rising, market breadth is negative, and unfavorable momentum patterns. There is no leadership as all SPY SPDR sectors are in a short-term downtrend. Usually, the second half of December is a favorable time of the year. Time will tell if favorable seasonality will begin to kick in and be enough to shift the short-term trend from down to up or if the decline will accelerate.
Remember to manage your risk, and your wealth will grow.
Let’s talk about investing. Did you know I specialize in market charts? You are invited to set up your Free 15-minute Wealth and Well-Being Strategy session by emailing me at Bonnie@BonnieGortler.com. I would love to connect with you.
Disclaimer: Although the information is made with a sincere effort for accuracy, it is not guaranteed that the information provided is a statement of fact. Nor can we guarantee the results of following any of the recommendations made herein. Readers are encouraged to meet with their own advisors to consider the suitability of investments for their own particular situations and for determination of their own risk levels. Past performance does not guarantee any future results.


Create more wealth in your life
with these simple strategies.
As an added bonus you will also
receive BG’s Updates and Ezine

Discover how to quickly create more well-being in your life with these simple strategies.
As an added bonus you will also
receive BG’s Updates and Ezine

As an added bonus you will receive BG’s Updates and Ezine

All work listed on BonnieGortler.com is licensed under a Creative Commons Attribution - Noncommercial - No Derivative Works 3.0 Unported License.


Free Report:
Grow and Sustain Your Wealth
Discover how to grow your money with these easy, simple steps.

