

10 Simple Tips for Financial Well-Being
07/01/2026
Selling slowed last week, with six S&P SPDR sectors higher, led by Energy (XLE) and, Utilities (XLU), while Technology (XLK) and Consumer Discretionary (XLC), the weakest sectors, while the SPDR S&P 500 ETF Trust (SPY) was down -0.09%.
S&P SPDR Sector ETFs Performance Summary
12/16/22 – 12/23/22
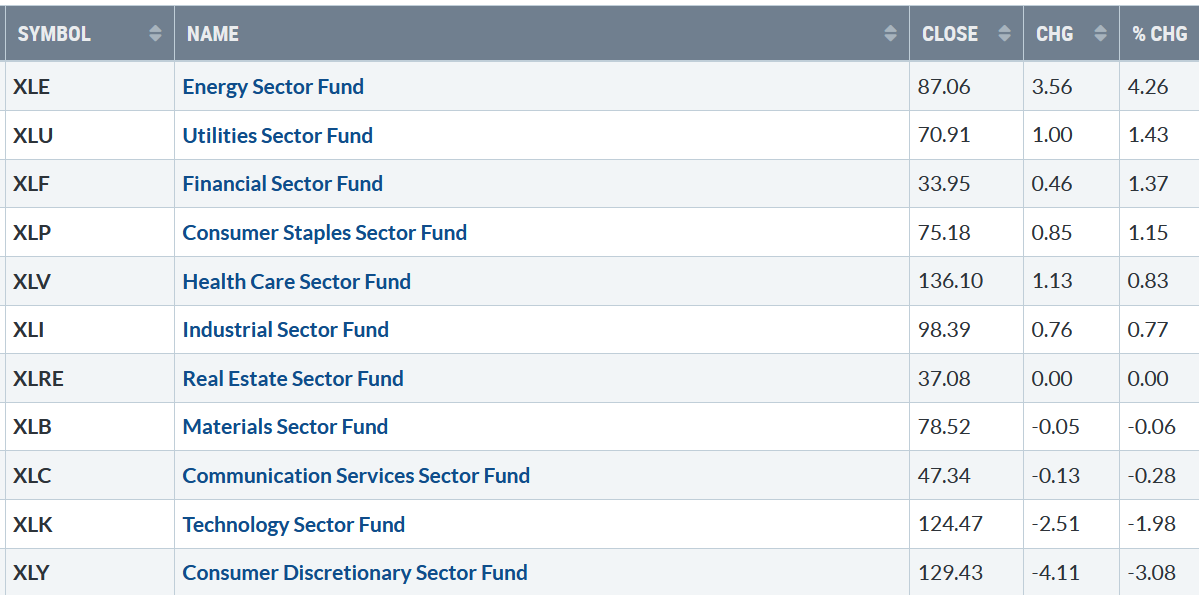
122322 Sectors Week
Source: Stockcharts.com
Figure 2: Bonnie’s ETFs Watch List
Performance Summary 12/16/22 – 12/23/22
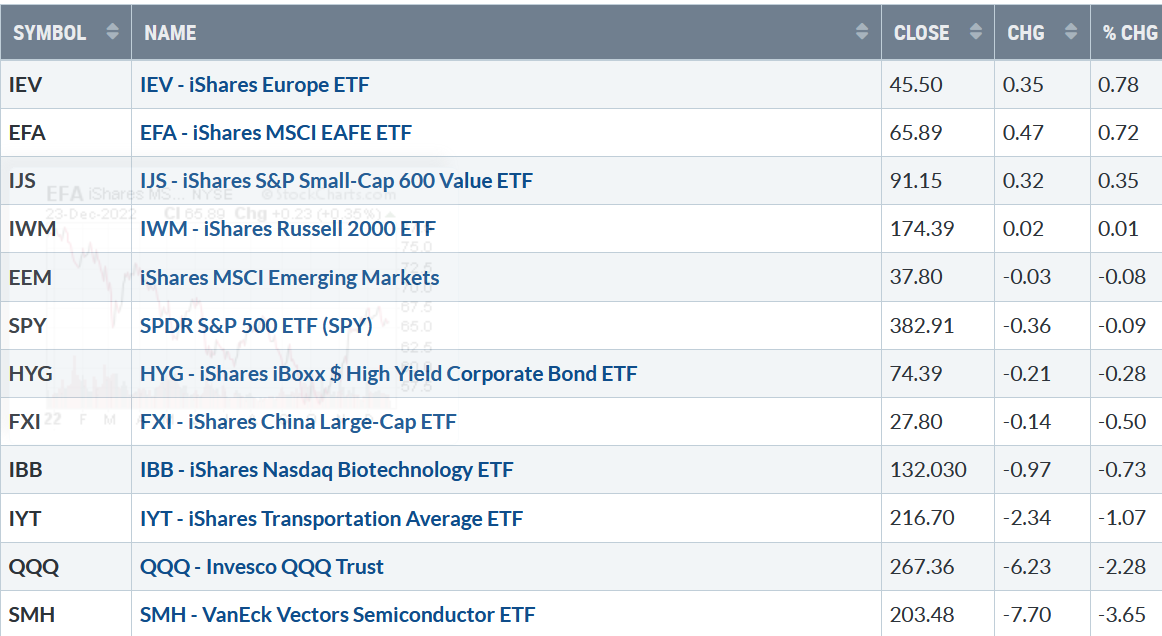
122322 Week ETFs
Source: Stockcharts.com
International markets are acting better than they have in years, leading in relative strength compared to the S&P 500 since November. Technology and Semiconductors remain under selling pressure.
Figure 3: UST 10YR Bond Yields Daily
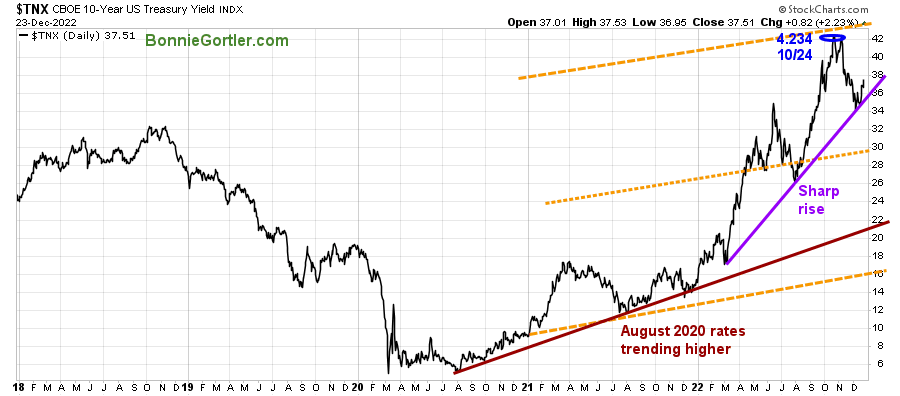
122322 UST 10 Yr Bond Yields Daily
Source: Stockcharts.com
The 10-Year U.S. Treasury yields rose, closing at 3.751%, remaining in an uptrend (purple line), with support at 3.40 and 2.90%.
The major averages were mixed, with the Dow up +0.86%, S&P 500 down -0.20%, and the Nasdaq falling -1.94%. The Russell 2000 Index was down -0.14%, and the Value Line Arithmetic Index (a mix of approximately 1700 stocks) was down -0.01%.
Weekly market breadth was negative on the New York Stock Exchange Index (NYSE) and Nasdaq. The NYSE had 1574 advances and 1764 declines, with 150 new highs and 354 new lows. There were 2148 advances and 3039 declines on the Nasdaq, with 138 new highs and 1032 new lows.
Nasdaq breadth remains in its 2022 downtrend.
Figure 4: Nasdaq Advance Decline Line Daily
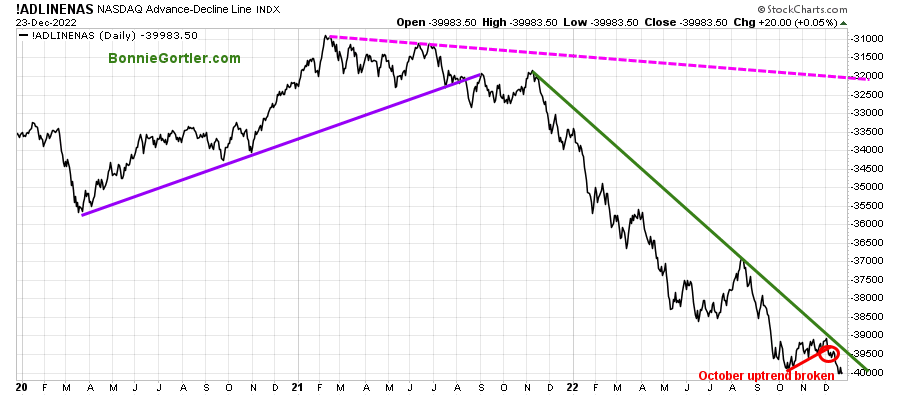
122322 Nasdaq Ad line Daily
Source: Stockcharts.com
It’s unfavorable that early in December, Nasdaq breadth failed to break above the 2022 downtrend and turned lower, breaking the October uptrend (red line).
Figure 5: Daily New York Stock Exchange (NYSE) New Lows
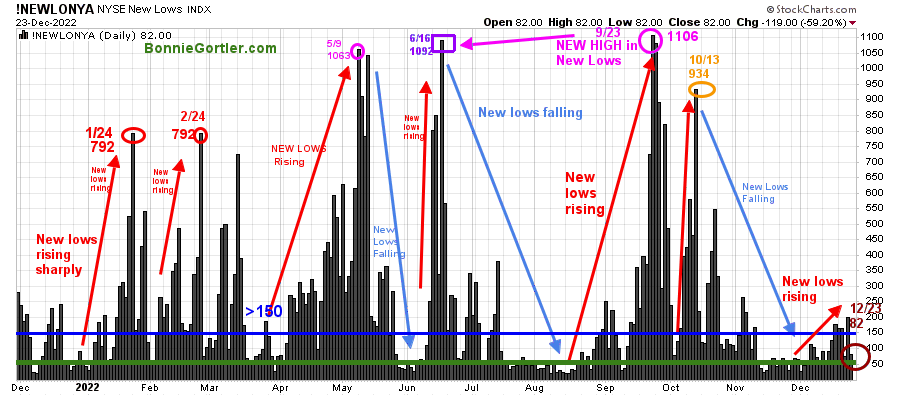
122322 NYSE New Lows Daily
Source: Stockcharts.com
Watching New lows on the New York Stock Exchange is a simple technical tool that helps awareness of the immediate trend’s direction.
New lows warned of a potential sharp pullback, high volatility, and “panic selling” for most of 2022, closing above 150. The peak reading was 9/23 when New Lows made a new high of 1106 (pink circle).
It is a positive sign that New Lows contracted last week, closing at 82 (brown circle), falling from 178 to below 150, and no longer in a high-risk zone. If new lows remain below 150 and fall between 25 and 50, that would be positive. On the other hand, New Lows rising above 150 would be unfavorable in the short term.
Learn more about the significance of New Lows in my book, Journey to Wealth, published on Amazon. If you would like a preview, get a free chapter here.
Figure 6: Daily iShares Russell 2000 (IWM) Price (Top) and 12-26-9 MACD (Bottom)
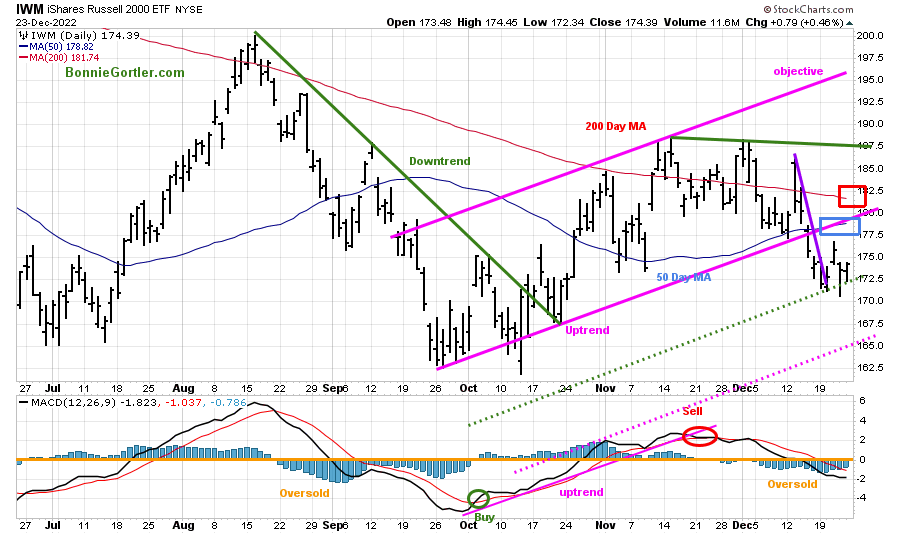
122322 IWM Daily
Source: Stockcharts.com
The top portion of the chart is the daily iShares Russell 2000 Index ETF (IWM), the benchmark for small-cap stocks, with a 50-Day Moving Average (MA) (blue line) and 200-Day Moving Average (MA) that traders watch and use to define trends.
IWM, closing at 174.39 +0.02%, is below its 200-Day Moving Average (red rectangle) and 50-Day Moving Average (blue rectangle) and closed below channel support at 177.50 (pink line).
MACD (middle chart) is on a sell, oversold below 0 (orange line), but its positive momentum is no longer accelerating down, and it can generate a buy if IWM gains strength. Short-term resistance is at 177.50, 182.50, 187.00, followed by 195.00.
Support is at 171.00, followed by 165.00.
A close below 165.00 would imply the decline is likely to accelerate.
Figure 7: Daily Invesco QQQ Trust (QQQ) Price (Top) and 12-26-9 MACD (Bottom)
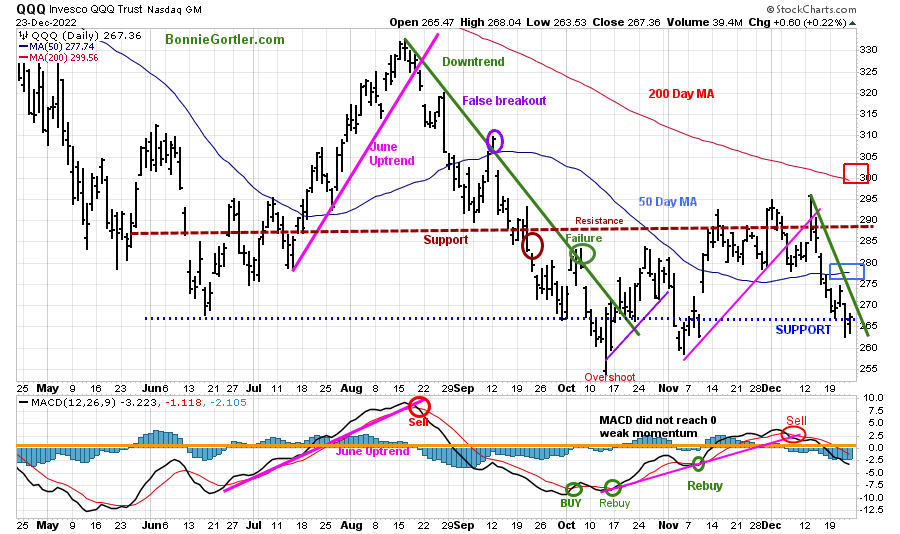
122322 QQQ Daily
Source: Stockcharts.com
The chart shows the daily Invesco QQQ, an exchange-traded fund based on the Nasdaq 100 Index. QQQ moved lower after a false break out (purple circle) in September of the August downtrend (green line). In November, QQQ broke its October uptrend (purple line), and the decline continued.
QQQ fell again -2.28%, closing at 267.36, continuing to be a vulnerable sector as the end-of-year tax selling continued with weakness in Mega Cap Technology.
QQQ support is at 266.00 and 260.00, with resistance at 277.00, 280.00, 290.00, and 300.00.
The bottom chart is MACD (12, 26, 9) on a sell, weak momentum, oversold but not showing a low-risk buy pattern yet.
Figure 8: Nasdaq 100 Index (NDX) Daily Top and NDX/SPY Bottom
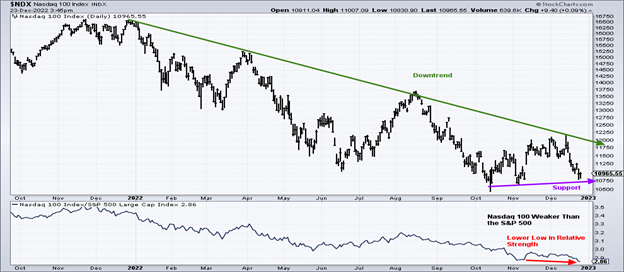
122322 Nasdaq 100 and Rel Strength vs. S&P 500
The Nasdaq-100 (NDX) (top chart) is a stock market index that includes 101 of the largest domestic and international non-financial companies listed on the Nasdaq Stock Market based on market capitalization. The Nasdaq 100 remains weaker than the S&P 500, continuing to make a lower low based on the relative strength (lower chart).
Figure 9: Components of Nasdaq 100 Index (NDX)
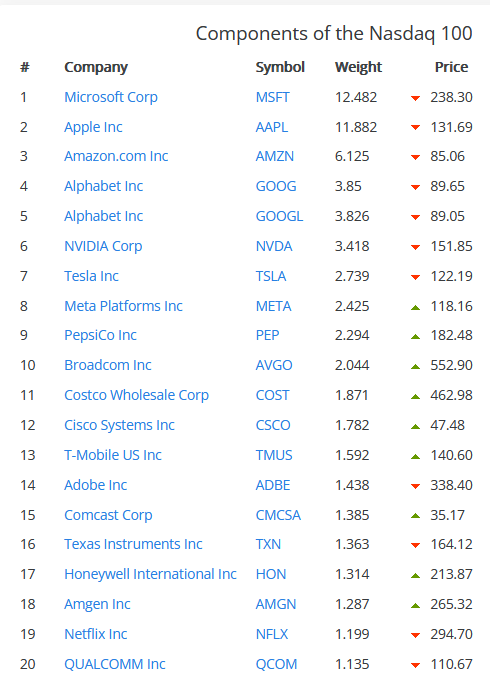
122322 NDX Top Holdings
Source: slickcharts.com/nasdaq100 index weights as of 12/23/2022
Keep an eye on Apple (AAPL) and Microsoft, 24.36% combined, which will impact the performance of the Nasdaq 100.
Figure 10: The S&P 500 Index ($SPX) Daily (Top) and 12-26-9 MACD (Bottom)
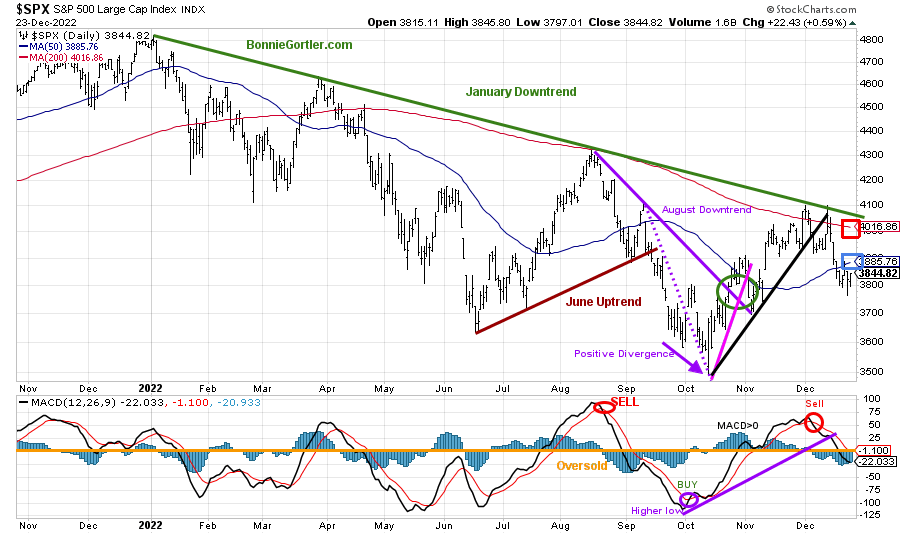
Source: Stockcharts.com
The S&P 500 (SPX) 2022 downtrend remains in effect (green line).
The S&P 500 (SPX) failed to get through resistance at 4100 and reversed lower, breaking the October uptrend, which is short-term bearish (black line).
Last week, SPX was slightly down -0.20%, closing at 3844.38, remaining below its 50- and 200-Day Moving Average (blue and red rectangle), implying weakness.
Resistance remains at 3900 and 4100, while support is at 3800 and 3700.
MACD (lower chart) remains on a sell, oversold below 0, in a position to create a buy if the SPX gains momentum in the near term.
S&P 500 remains above 200-Week Moving Average
Figure 11: The S&P 500 Index ($SPX) Weekly (Top) and 12-26-9 MACD (Bottom)
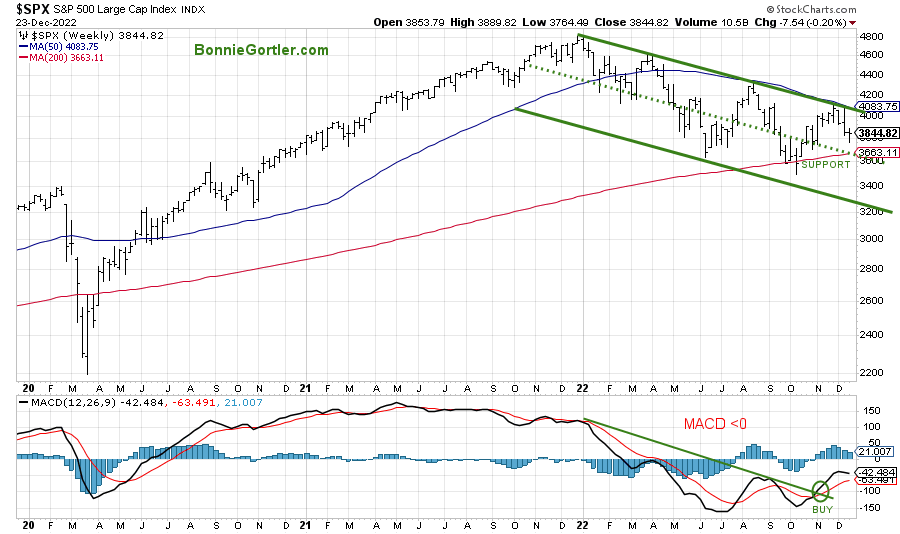
Source: Stockcharts.com
The top chart shows the weekly S&P 500 Index ($SPX). SPX peaked in January 2022 and is in a downtrend.
It remains worrisome that MACD has not reached 0 all of 2022, implying weak momentum even though it’s on a buy.
SPX 3600 remains a crucial support area (green dotted line) that needs to hold the middle channel (green dotted line) or expect another leg down towards 3200.
Many hourly charts are oversold and due for a bounce.
Figure 12: Apple (AAPL) 60-minute chart (Top) and MACD (middle) and Money Flow (Bottom)
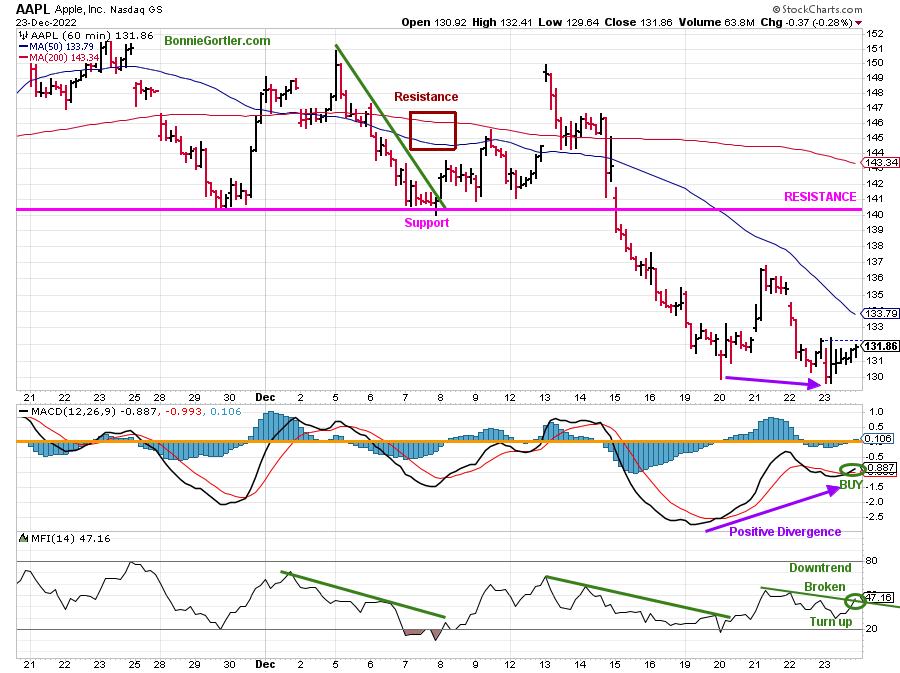
122322 AAPL 60 minute
Source: Stockcharts.com
Apple (AAPL), under heavy selling pressure, has remained in an hourly downtrend since December 13th.
However, the trend can soon change. Notice the positive divergence that has formed (a lower in price and a higher low in MACD) at Friday’s close.
MACD is on a buy, with Money Flow turning up (bottom chart), breaking the downtrend (green circle), which is short-term positive.
Short-term resistance is 134.00, followed by 136.00 and 141.00. It will be short-term bullish if AAPL closes above 141.00. and could help the technology sector.
On the other hand, continued weakness in AAPL would be bearish for the Technology Sector and a potential fall for AAPL to 117.00 below the June low.
Figure 13: Apple (AAPL) Weekly and MACD (Bottom)
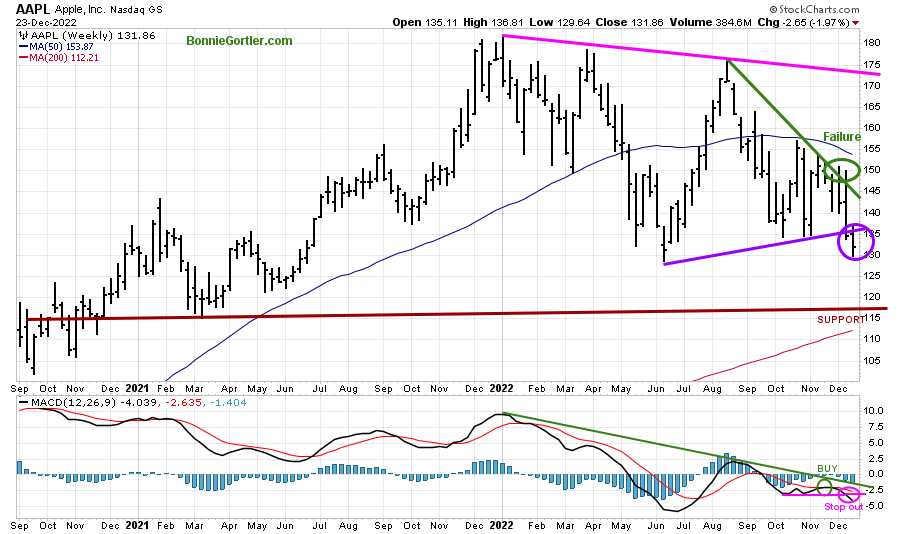
122322 AAPl Weekly
Source: Stockcharts.com
The Intermediate trend is down in Apple (AAPL).
APPL on the weekly chart is not favorable after failing to get above the 50-Week Moving Average in October and turning down. Rally attempts failed in October and November.
AAPL closed below its June uptrend (purple circle), with support at 117.00 while resistance is at 135.00.
MACD had generated a buy but was stopped out, now on a sell as MACD after making a new momentum low.
Time will tell if the buyers are in the holiday spirit and go shopping, buying APPL and other Mega Cap companies to the end of 2022.
Figure 14: SPDR Energy (XLE) (Top) and 12-26-9 MACD (Bottom)
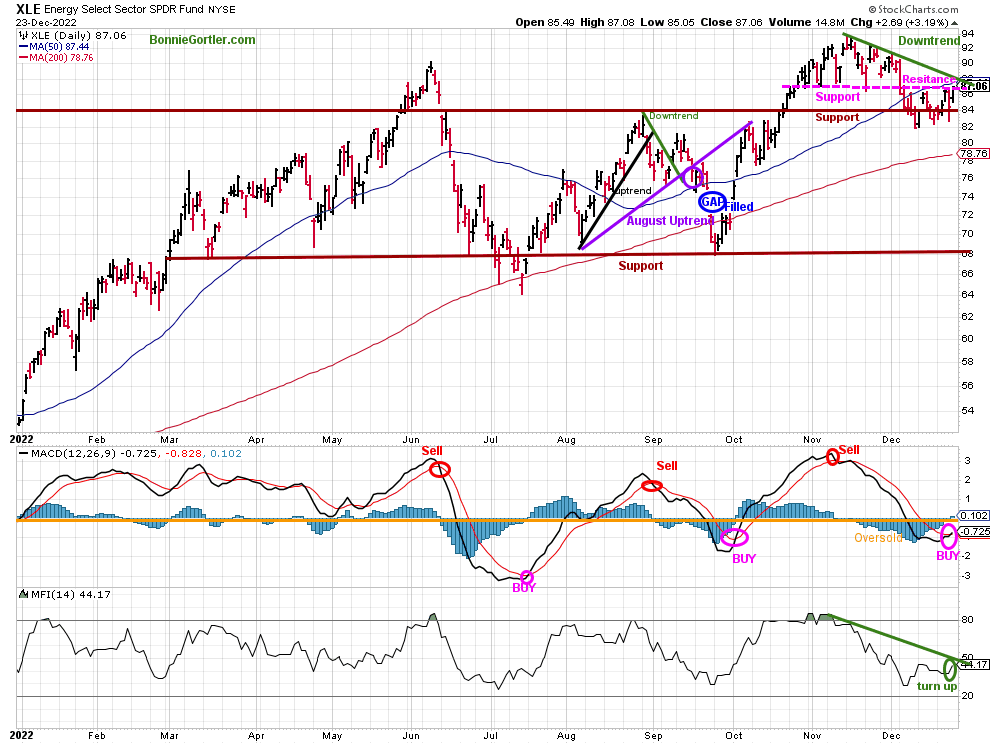
122322 XLE Daily
Energy (XLE), the best-performing sector of 2022, peaked in November and has lower highs. Last week investors bought energy stocks with XLE, the best sector for the week, and 2022.
XLE gained +4.26%, closing at 87.06 but remains in a downtrend (green line) and closed slightly under the 50-Day Moving Average. Support is at 84.00, 81.00, and 78.00, and resistance is at 87.00 and 92.00.
It’s positive MACD generated a buy, with excellent entries in July and October.
Money Flow has turned up, which is also positive, but not yet breaking the November downtrend.
If the downtrend break in XLE, watch for more buying, as portfolio managers will want to show winners in their portfolios at year-end. On the other hand, it would be negative if XLE closes below 81.00.
Summing Up:
Inflation and higher interest rates concerns remain. Tax loss selling continued in Technology and Semiconductors. Market breadth remains negative, and short-term downtrends remain in effect, which is concerning. However, its positive New Lows did not expand on the NYSE and Nasdaq last week. Momentum patterns have stopped accelerating to the downside, now short-term oversold and in a more favorable position where rallies begin. Most say the market is going lower. When the subject of the stock market comes up, the conversation quickly changes. Time will tell if there will be an upside surprise with the bulls taking control and the short-term trend shifts from down to up or if the decline will accelerate.
Remember to manage your risk, and your wealth will grow.

Let’s talk investing. You are invited to set up your Free 30-minute Wealth and Well-Being Strategy session by clicking here or emailing me at Bonnie@BonnieGortler.com. I would love to connect with you.
Disclaimer: Although the information is made with a sincere effort for accuracy, it is not guaranteed that the information provided is a statement of fact. Nor can we guarantee the results of following any of the recommendations made herein. Readers are encouraged to meet with their own advisors to consider the suitability of investments for their own particular situations and for determination of their own risk levels. Past performance does not guarantee any future results.


Create more wealth in your life
with these simple strategies.
As an added bonus you will also
receive BG’s Updates and Ezine

Discover how to quickly create more well-being in your life with these simple strategies.
As an added bonus you will also
receive BG’s Updates and Ezine

As an added bonus you will receive BG’s Updates and Ezine

All work listed on BonnieGortler.com is licensed under a Creative Commons Attribution - Noncommercial - No Derivative Works 3.0 Unported License.


Free Report:
Grow and Sustain Your Wealth
Discover how to grow your money with these easy, simple steps.

