

10 Simple Tips for Financial Well-Being
07/01/2026
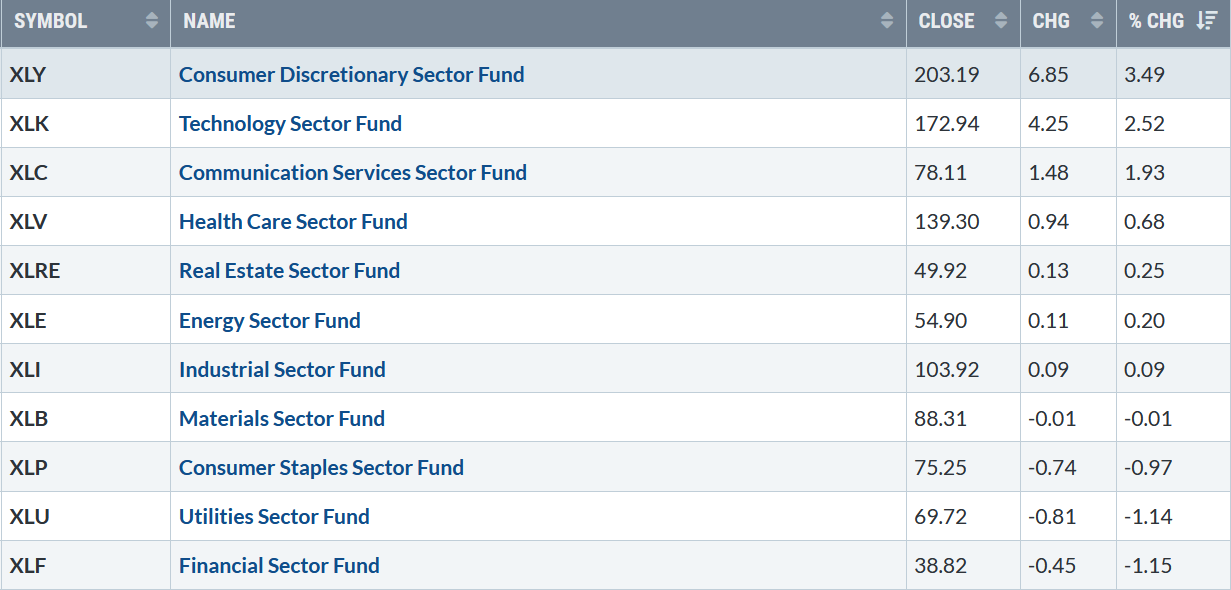
Seven of the eleven sectors rose, with three stronger than the SPDR S&P 500 ETF Trust (SPY) up +1.24%. Consumer Discretionary (XLY) and Technology (XLK) were the strongest sectors, while Utilities (XLU) and Financials (XLF) were the weakest.
S&P SPDR Sector ETFs Performance Summary
12/17/21 – 12/23/21
 Source: Stockcharts.com
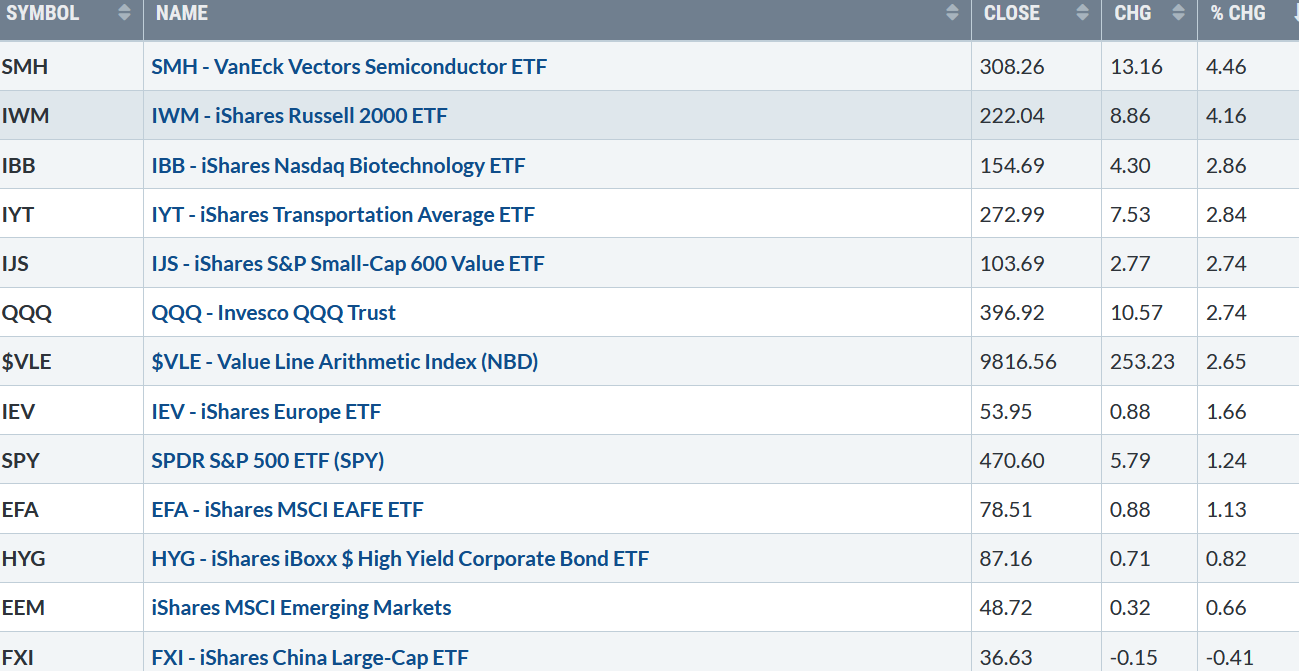
Figure 2: Bonnie’s Mix of ETFs To Monitor
Summary 12/17/21– 12/23/21
 Source: Stockcharts.com
Investors were in the holiday spirit, in risk-on mode. Semiconductor and Small-Cap stocks led the market higher. Biotechnology, which was out of favor, showed strength for the second week in a row, while international markets continued to be weaker than the U.S.
All major averages finished the week higher. The Dow rose +1.65%, the S&P 500 gained +2.28%, and the Nasdaq was up +3.19%.
The Russell 2000 Index gained +3.11%, and the Value Line Arithmetic Index (a mix of approximately 1700 stocks) up 2.58%.10 – Year U.S. Treasury yields rose, closing at 1.493, remaining in a trading range above support at 1.25, and below resistance between 1.65% and 1.80%.
Weekly market breadth improved on both the NYSE and Nasdaq. The New York Stock Exchange Index (NYSE) had 2531 advances and 1001 declines. Nasdaq had 3275 advances and 1775 declines. There were 132 New Highs and 334 New Lows on the NYSE and 170 New Highs, and 666 New Lows on the Nasdaq. Market breadth needs to show consistent improvement for the rally to be sustainable.
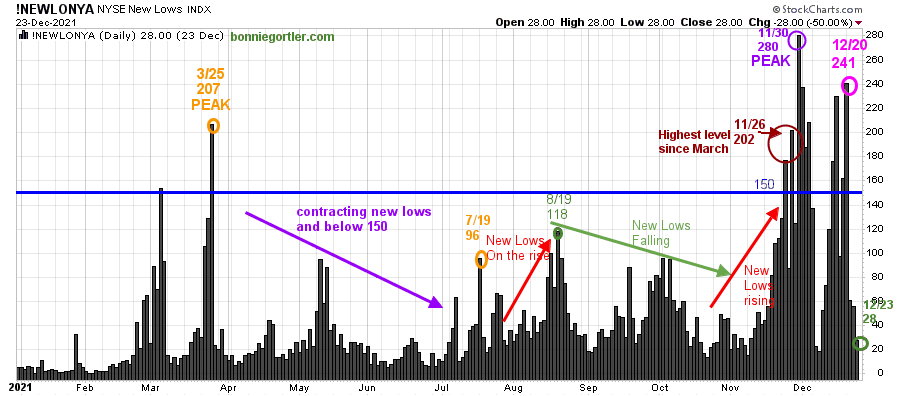
Figure 3: Daily New York Stock Exchange (NYSE) New Lows
122321 NYSE New Lows
Source: Stockcharts.com
Watching New lows on the New York Stock Exchange is a simple technical tool that helps awareness about the immediate trend’s direction.
Learn more in my book, Journey to Wealth. Here is an excerpt, If the New Lows are above 150, it is an alert or warning of possible market weakness or a change in market tone. Be aware, it’s a good idea to make sure you are happy and comfortable with your portfolio. It is best not to have more volatile investments than you can handle where you feel uncomfortable. If the selling continues, you could have serious losses if the market falls further. When new lows are above 150, the market is negative, higher risk, selling is taking place. Sometimes it could be severe, and sometimes on a very nasty day, you can have “panic selling,” and big wild swings (high volatility) to the downside may occur.
New lows peaked on 11/30 at 280 (purple circle) and then made a lower peak of 241(pink circle) on 12/20.
Last week, New Lows contracted sharply during the rise, closing at 28 on 12/23, no longer in a high-risk zone. However, if New Lows stay between 25 and 50, it would be favorable for the near term. On the other hand, News lows closing above 150 would signify this latest rally is complete and more weakness is likely.
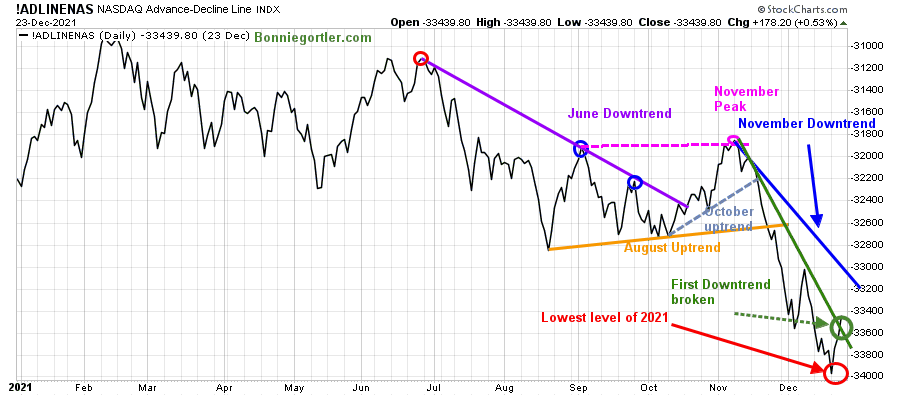
Figure 4: Daily Nasdaq Advance-Decline Line
122321 NASDAQ Daily AD LIne
Source: Stockcharts.com
The daily Nasdaq AD-Line broke the June downtrend (purple line), peaking in early November then turned down, breaking the October uptrend (blue dotted line), an advanced warning a decline was forthcoming.
After the August uptrend broke (orange line), a series of new lows in December occurred.
The first downtrend was broken (green line) last week. However, it would be positive to confirm the rise in the Nasdaq will continue if the November downtrend is penetrated this week.
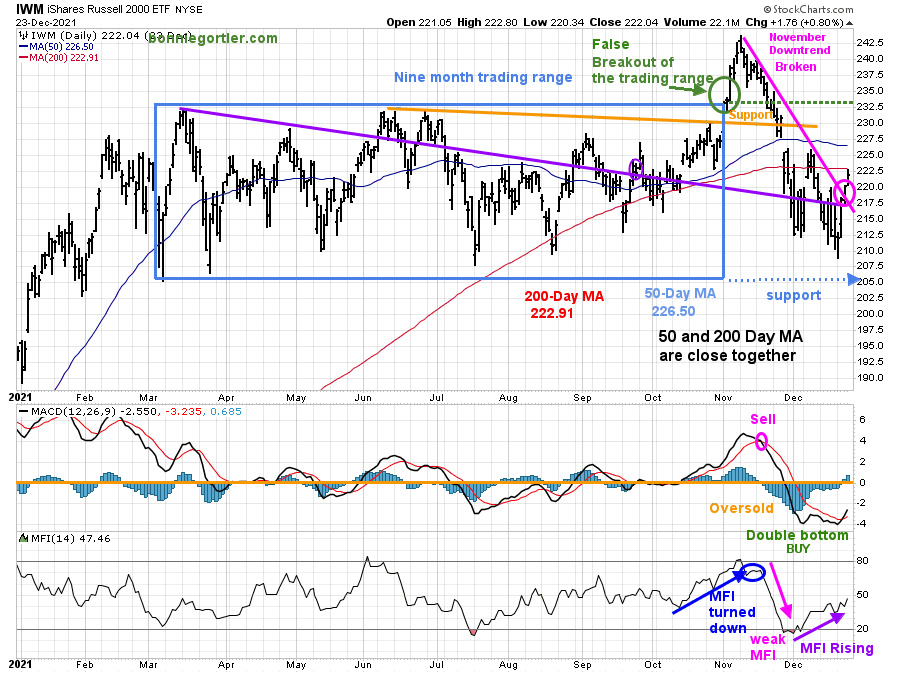
Figure 5: Daily iShares Russell 2000 (IWM) Price (Top) and 12-26-9 MACD (Middle and Money Flow (Bottom)
122321 IWM Daily
Source: Stockcharts.com
The top portion of the chart is the daily iShares Russell 2000 Index ETF (IWM), the benchmark for small-cap stocks, with a 50-Day Moving Average (MA) (blue line) and 200-Day Moving Average (MA), that traders watch and use to define trends.
A false breakout occurred in IWM after being in a nine-month trading range.
Last week IWM broke the November downtrend, up +1.24 %, closing at 222.04. IWM continues to close below its 50-and 200-Day Moving Average. Further gains above the 50 and 200 Day Moving Averages would likely trip the stops and excite the bulls.
Support is 220.00, 210.00, and 205.00. Resistance is at 227, followed by 232.50.
MACD (middle chart) is on a buy with a favorable double bottom, a positive sign for a potential short-term rally.
Money Flow (lower chart) is rising, a sign that investors are stepping into small caps.
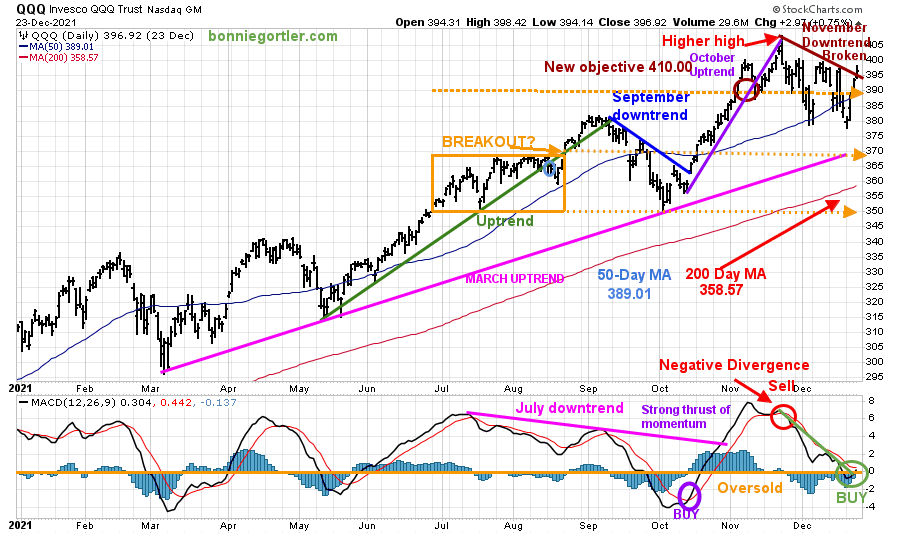
Figure 6: Daily Invesco QQQ Trust (QQQ) Price (Top), Money Flow Middle), and 12-26-9 MACD (Bottom)
122321 QQQ Daily
Source: Stockcharts.com
The chart shows the daily Invesco QQQ, an exchange-traded fund based on the Nasdaq 100 Index with its 50-Day Moving Average and 200-Day Moving Average. In June, QQQ was in a trading range (orange rectangle) and then broke out above 370.00 in August, which failed. A decline followed to 350.00 support in late September. After breaking the short-term downtrend 10/7 (blue line), QQQ continued to climb in November, close to its upside target of 410.00 on 11/22 with a high of 408.71 before reversing lower.
QQQ broke the November downtrend QQQ last week. After being under pressure falling below 390.00 support, QQQ reversed closing at 396.92, up +2.74%, led by Apple up +3.00% and Microsoft up +3.36%. Both stocks combine for over 20% of QQQ and will continue to impact QQQ performance.
It remains positive the March uptrend (top chart) remains intact (pink line).
The lower chart is MACD (12, 26, 9), a measure of momentum that generated a new buy last week.
Support is 390.00 followed by 380.00 and 370.00, a vital area that needs to hold. Resistance is 400.00 with an upside objective to 410.00. A close below 370.00 would shift the trend to down, make it harder to make money, and likely fuel more selling in Nasdaq.
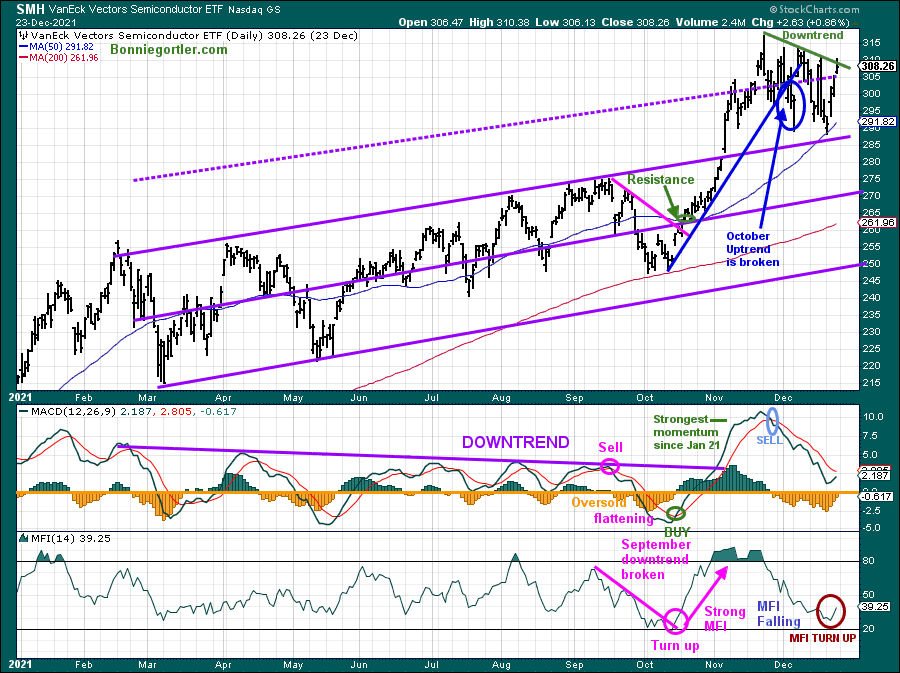
Figure 7: Van Eck Semiconductors (SMH) Daily Price (Top), Money Flow (Middle), and 12-26-9 MACD (Bottom)
122321 SMH Daily
Source: Stockcharts.com
Semiconductors had a great run in October, leading the technology sector higher. The October uptrend was broken (blue line), and the easy money is over.
Semiconductors rose +4.46%, closing at 308.26, slightly below the November downtrend.
Support is at 295.00 and 289.00. Resistance is at 312.00 followed by 321.00.
MACD (middle chart) remains on a sell after very strong momentum. Its favorable MACD stopped falling and has begun to rise, but more time is needed for MACD to reset and go below 0 for a safe entry.
Money flow (lower chart) turned up a favorable sign; another rally is underway and sustainable.
Keep an eye on NYSE Market breadth
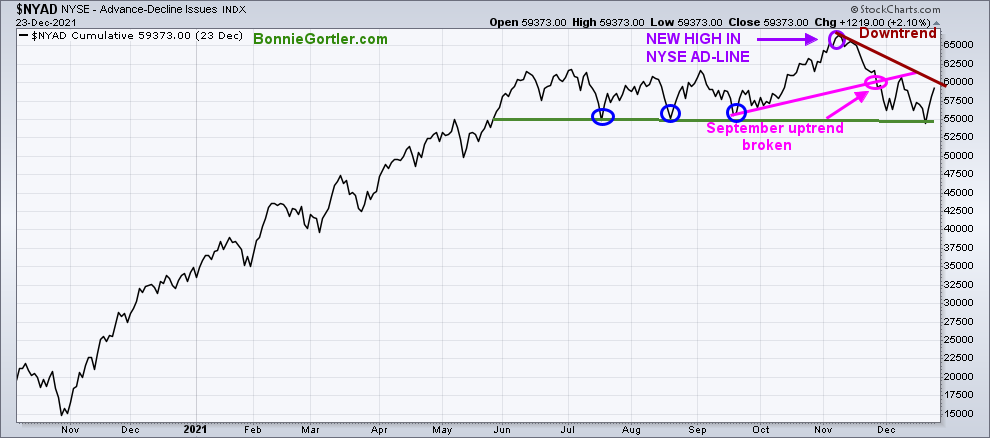
Figure 8: New York Stock Exchange AD-Line
122321 NYSE Daily AD Line
Source: Stockcharts.com
In the top portion of the chart (Figure:11), The NYSE A/D line made a new high on 11/8/21, but it has trended down since then. As a result, it’s harder to make money with market breadth negative.
Last week, there was better action in the AD line, but the November downtrend remains in effect (brown line). Continued strength is needed for the downtrend to break and the rally to be sustainable into early 2022.
The lows made in July, August, and September are essential to hold (blue circles), or a more severe correction is likely.
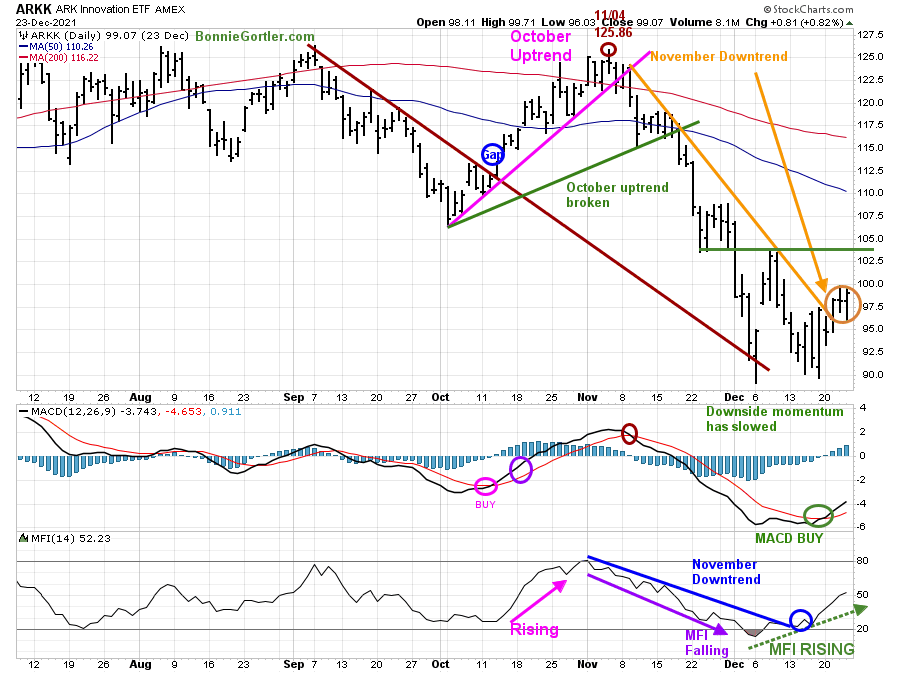
Figure 9: ARKK Innovation
122321 ARKK Daily
Source: Stockcharts.com
ARKK, an actively managed ETF by Cathie Wood that seeks long-term growth.
ARKK broke its September short-term downtrend (brown line) in October and gapped up, followed by a failed rally. ARKK has sold off sharply since its peak at 125.86 on 11/04 to its low at 89.03, a decline of -29.30%
ARKK gained +1.92% last week, closing at 99.07. MACD gave a new buy, and its encouraging MACD is rising.
Money flow (lower chart) trended lower until ARKK broke the November downtrend. Now Money Flow continues to rise, implying more room to the upside.
Short-term resistance is 100.00, 103.00, followed by 108.00. Support is at 94.00 and 90.00. A close below 90.00 would imply another leg down is possible.
Summing Up:
All three major averages rose last week, with market breadth improving as the bulls gained control in a holiday-shortened week. Semiconductor, technology, and small-cap stocks rebounded sharply, alleviating the short-term oversold condition stabilizing early in the week. However, short-term momentum patterns imply the latest rally is likely to continue. Watch this week if the Russell 2000 gains momentum and is stronger than the S&P 500. Keep an eye on the NYSE and Nasdaq market breadth if there are more issues up than down. The bulls regained control for now, but it could change quickly. Have an exit plan ready if the bears come out of hiding with the intermediate-term trend questionable, with many momentum oscillators weakening.
Remember to manage your risk, and your wealth will grow.
If you liked this article, you will love my Free Charting Master Class. Get it here:
See more charts in my FB group Wealth Through Market Charts.
I would love to hear from you. If you have any questions or comments or would like to talk about the market, click here.
Disclaimer: Although the information is made with a sincere effort for accuracy, it is not guaranteed that the information provided is a statement of fact. Nor can we guarantee the results of following any of the recommendations made herein. Readers are encouraged to meet with their own advisors to consider the suitability of investments for their own particular situations and for determination of their own risk levels. Past performance does not guarantee any future results.


Create more wealth in your life
with these simple strategies.
As an added bonus you will also
receive BG’s Updates and Ezine

Discover how to quickly create more well-being in your life with these simple strategies.
As an added bonus you will also
receive BG’s Updates and Ezine

As an added bonus you will receive BG’s Updates and Ezine

All work listed on BonnieGortler.com is licensed under a Creative Commons Attribution - Noncommercial - No Derivative Works 3.0 Unported License.


Free Report:
Grow and Sustain Your Wealth
Discover how to grow your money with these easy, simple steps.

