

10 Simple Tips for Financial Well-Being
07/01/2026
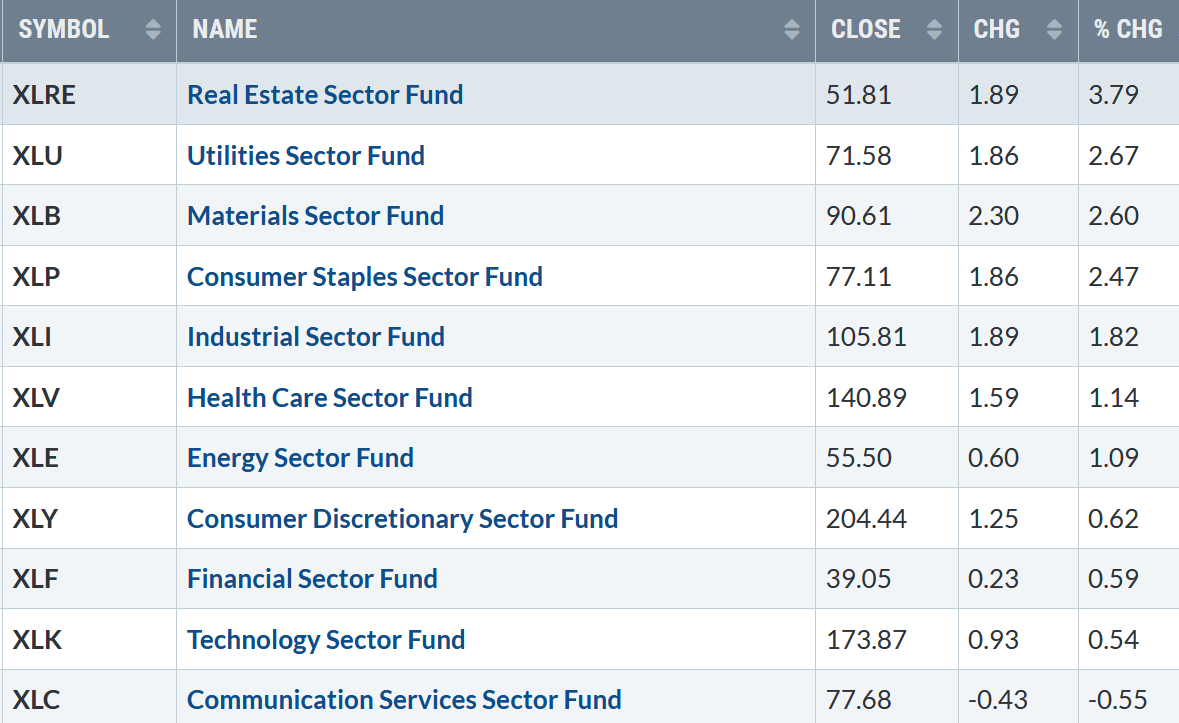
Ten of the eleven sectors rose, with seven stronger than the SPDR S&P 500 ETF Trust (SPY) up +0.93%. Defensive sectors were the big winners, with Real Estate (XLRE) and Utilities (XLU) the strongest sectors, while Technology (XLK) and Communications (XLC) were the weakest.
S&P SPDR Sector ETFs Performance Summary
12/23/21 – 12/31/21
123121 Week Sectors
Source: Stockcharts.com
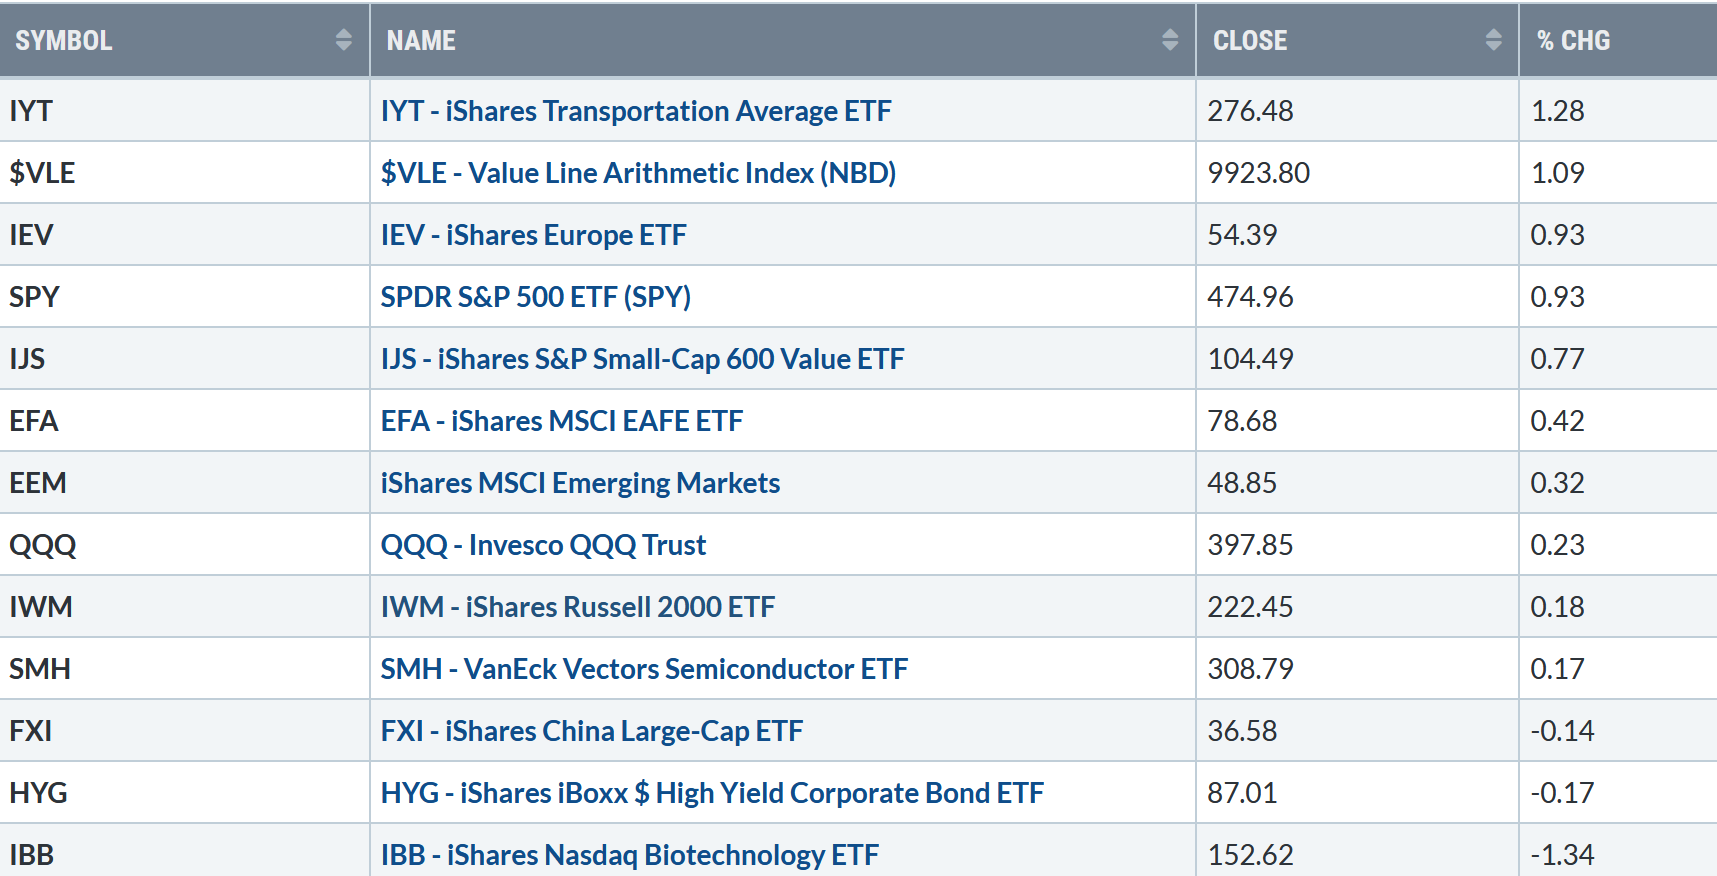
Figure 2: Bonnie’s Mix of ETFs To Monitor
Summary 12/23/21– 12/31/21
123121 Week ETFs
Source: Stockcharts.com
Investors were cautious regarding Technology stocks as defensive sectors led. International markets advanced, but relative strength remains weaker than the U.S.
The Dow’s six-day winning streak ended on Friday after making a new intraday record high, finishing +1.08 % for the week along with the S&P 500 up +0.85%. The Nasdaq finished lower, closed down slightly -0.05%.
The Russell 2000 Index eked out a gain of +0.18%, and the Value Line Arithmetic Index (a mix of approximately 1700 stocks) rose +1.09%.10-Year U.S. Treasury yields rose, closing at 1.512%, remaining in a trading range above support at 1.25%, and below resistance between 1.65% and 1.80%.
Weekly market breadth was stronger on the NYSE compared to Nasdaq. The New York Stock Exchange Index (NYSE) had 3651 advances and 2331 declines. Nasdaq had 2396 advances and 2690 declines. There were 322 New Highs and 189 New Lows on the NYSE and 325 New Highs, and 768 New Lows on the Nasdaq. Market breadth needs to improve in the near term for the major averages to continue higher.
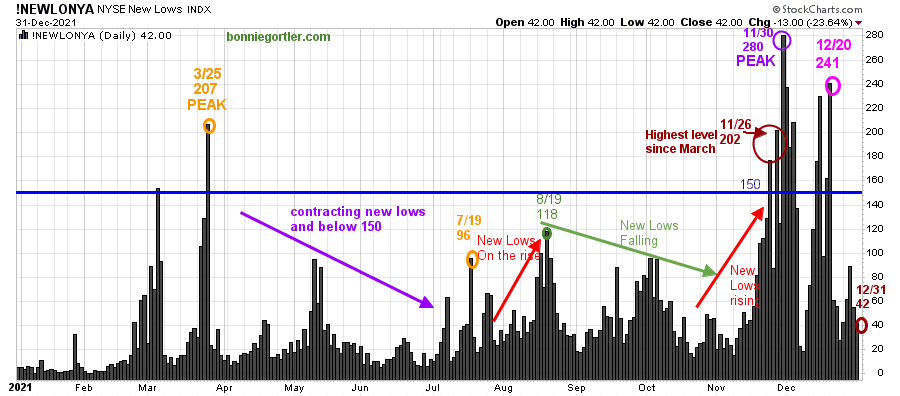
Figure 3: Daily New York Stock Exchange (NYSE) New Lows
123121 NYSE New Lows
Source: Stockcharts.com
Watching New lows on the New York Stock Exchange is a simple technical tool that helps awareness about the immediate trend’s direction.
Learn more in my book, Journey to Wealth. The market is very strong when the New Lows are below 25 (Very Low Risk, and prices tend to rise). When New Lows are between 25 and 50, the risk is low, and prices tend to rise.
New lows inched up last week but have stabilized and are well below their peak of 280 on 11/30 (purple circle). New Lows closed at 42 (brown circle) but remain in the low-risk zone, where prices tend to rise. Watch if New Lows stay between 25 and 50, or if they close above 150, signifying potential weakness in the near term.
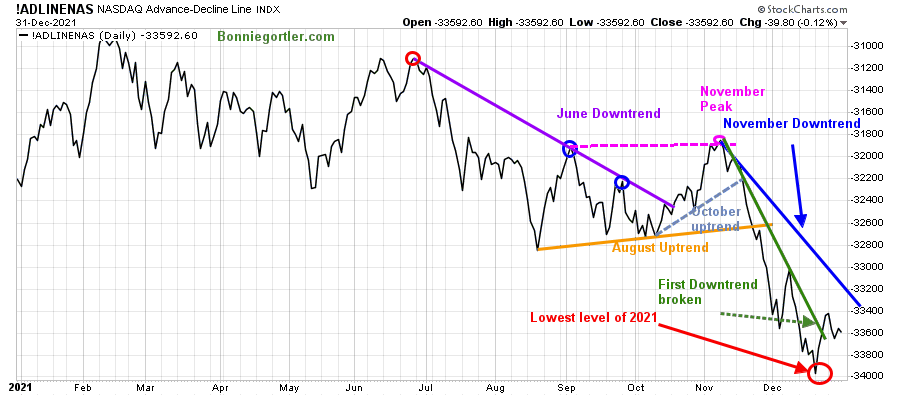
Figure 4: Daily Nasdaq Advance-Decline Line
123121 NASDAQ Daily AD Line
Source: Stockcharts.com
The daily Nasdaq AD-Line broke the June downtrend (purple line), peaking in early November, then broke the October uptrend (blue dotted line), an advanced warning a decline was forthcoming. After the August uptrend broke (orange line), a string of new lows continued through December.
The first downtrend was broken (green line) in late December. However, with last week’s negative breadth on Nasdaq, the November downtrend remains in effect. Until broken, the risk in growth stocks with no earnings is high. On the other hand, a turn up that is strong enough to break the downtrend would favor short-term strength early in January.
Figure 5: Weekly Nasdaq Advance-Decline Line
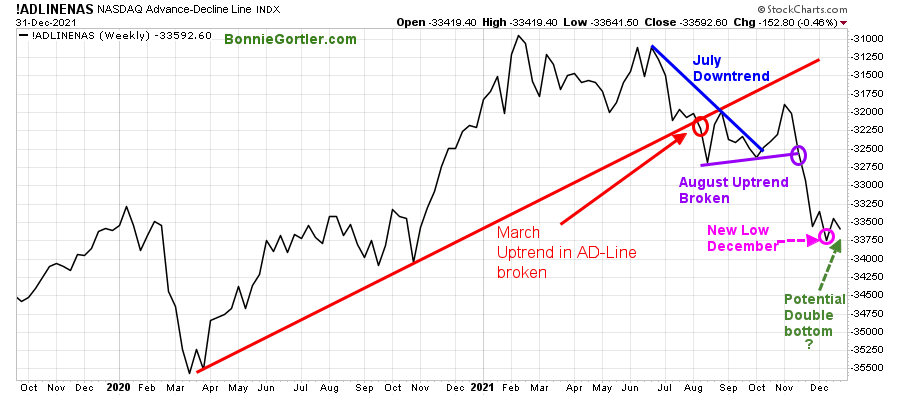
123121 NASDAQ Weekly AD LIne
Source: Stockcharts.com
The Nasdaq Weekly AD-Line is not yet favorable, only slightly above its December low (pink circle) after breaking down in August.
A turn-up is needed to form a potential double bottom. On the positive side, year-end tax selling is over, and many stocks are extended to the downside and have begun to stabilize.
On the other hand, more weakness is likely if market breadth weakens and takes out the December low.
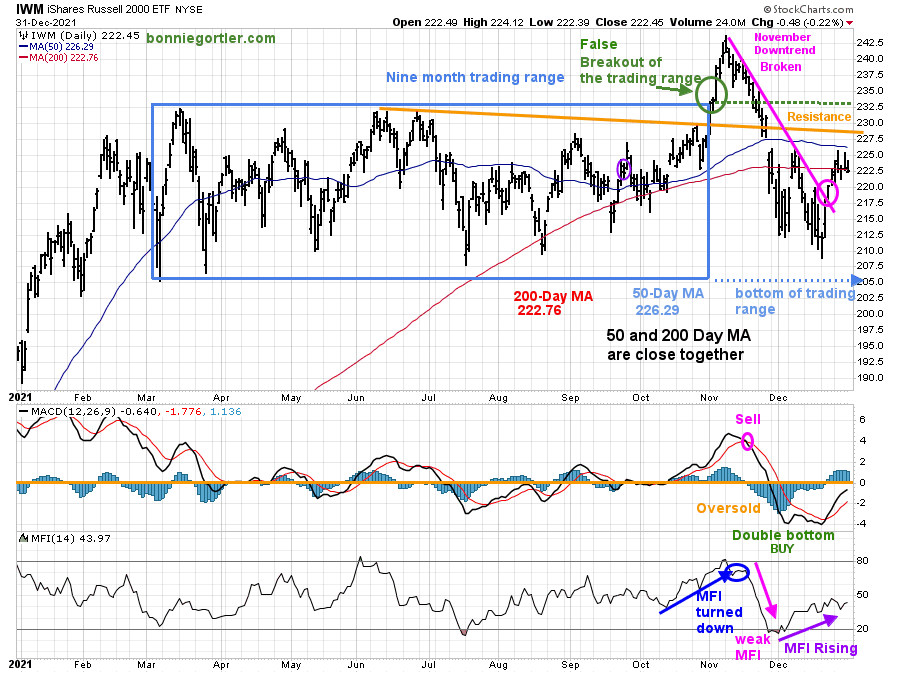
Figure 6: Daily iShares Russell 2000 (IWM) Price (Top) and 12-26-9 MACD (Middle and Money Flow (Bottom)
IWM Daily123121
Source: Stockcharts.com
The top portion of the chart is the daily iShares Russell 2000 Index ETF (IWM), the benchmark for small-cap stocks, with a 50-Day Moving Average (MA) (blue line) and 200-Day Moving Average (MA), that traders watch and use to define trends. A false breakout occurred in November in IWM after being in a nine-month trading range.
IWM broke the November downtrend the previous week but only rose 0.23 %, closing at 222.45. IWM continues to close below its 50-and 200-Day Moving Average. A close above the 50-and 200-Day Moving Averages would likely trip the stops and excite the bulls.
Support is 220.00, 210.00, and 205.00. Resistance is at 228, followed by 232.50.
MACD (middle chart) remains on a buy with a favorable double bottom in place, implying potential further gains.
Money Flow (lower chart) is rising, a sign that investors are stepping into small caps. Further rise in money flow could fuel additional buying.
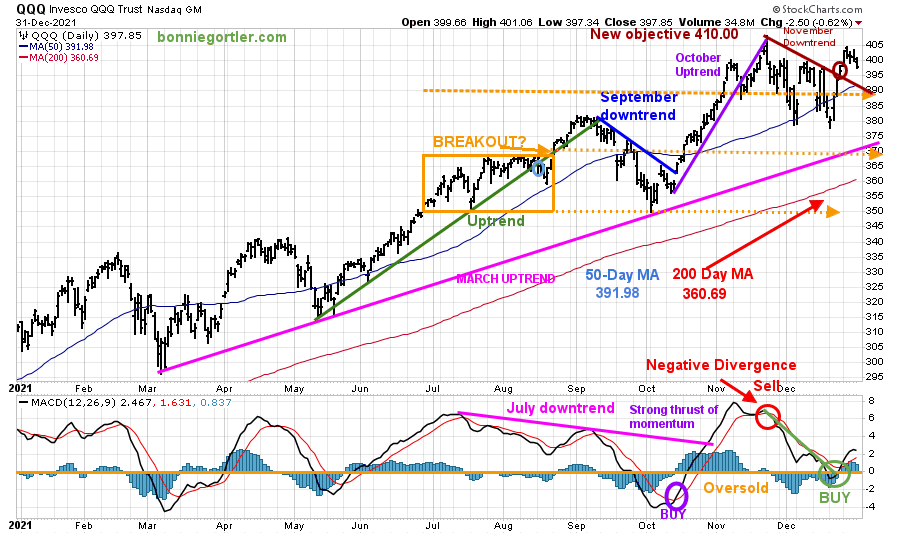
Figure 7: Daily Invesco QQQ Trust (QQQ) Price (Top), Money Flow Middle), and 12-26-9 MACD (Bottom)
123121 QQQ Daily
Source: Stockcharts.com
The chart shows the daily Invesco QQQ, an exchange-traded fund based on the Nasdaq 100 Index with its 50-Day Moving Average and 200-Day Moving Average. In June, QQQ was in a trading range (orange rectangle) and then broke out above 370.00 in August, which failed. A decline followed to 350.00 support in late September. After breaking the short-term downtrend 10/7 (blue line), QQQ continued to climb in November, close to its upside target of 410.00 on 11/22 with a high of 408.71 before reversing lower.
It remains positive the March uptrend (top chart) remains intact (pink line).
QQQ broke the November downtrend the previous week and then extended its gains early in the week but then stalled, only gaining 0.23%, closing at 397.85.
The lower chart is MACD (12, 26, 9), a measure of momentum, remains on a buy.
Resistance is at 400.00 with an upside objective to 410.00. Support is 390.00 followed by 380.00 and 370.00, a vital area that needs to hold for the uptrend to remain. A close below 370.00 would shift the trend to down, make it harder to make money, and likely fuel more selling in Nasdaq.
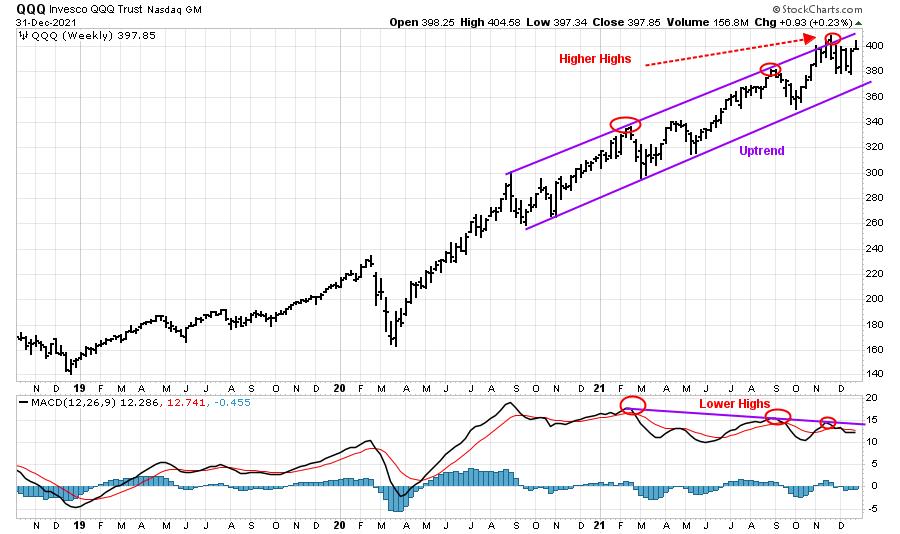
Figure 8: Weekly Invesco QQQ Trust (QQQ) Price (Top), and 12-26-9 MACD (Bottom)
123121 QQQ Weekly
Source: Stockcharts.com
The top chart shows the weekly Invesco QQQ Trust (QQQ) has remained in a weekly uptrend since September 2020.
Notice how QQQ made higher highs as the uptrend continued (red circles), peaking in November. Last week QQQ closed near its low, unable to sustain any upside momentum.
MACD (lower chart) remains on a sell, with lower highs, weakening momentum, forming a negative divergence implying risk is high for the intermediate-term.
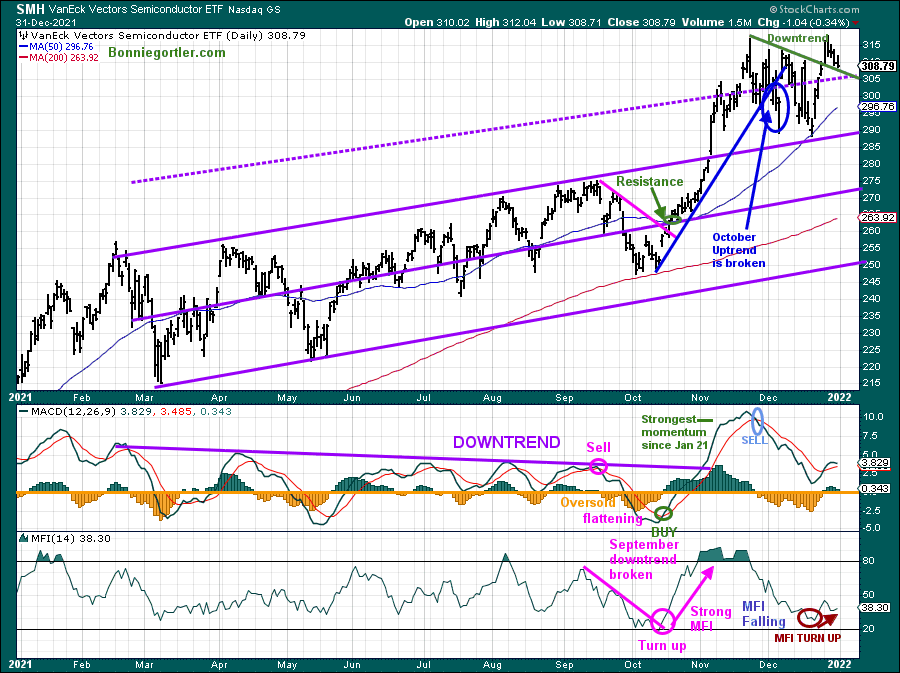
Figure 9: Van Eck Semiconductors (SMH) Daily Price (Top), Money Flow (Middle), and 12-26-9 MACD (Bottom)
123121 SMH Daily
Source: Stockcharts.com
Semiconductors had a great run in October, leading the technology sector higher. The October uptrend was broken (blue line), and the easy money is over.
Semiconductors rose +0.17%, closing at 308.79, holding slightly above the November downtrend as investors took profits ending 2021
Support is at 305.00 followed by 290.00. Resistance is at 315.00, followed by 321.00.
MACD (middle chart) remains on a sell, but its favorable MACD stopped falling and is rising yet not fallen enough to reset and go below 0 for a buy to be generated.
Money flow (lower chart) turned up, but no big thrust yet.
If you buy into Semiconductors, it’s a good idea to place a close stop, so if prices reverse lower, you will manage your risk.
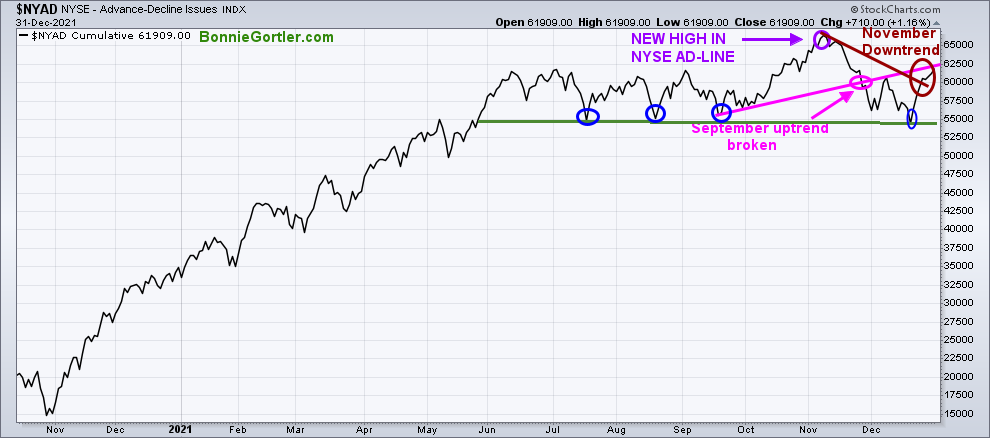
Figure 10: New York Stock Exchange AD-Line
123121 NYSE Daily AD Line
Source: Stockcharts.com
In the top portion of the chart (Figure:11), The NYSE A/D line made a new high on 11/8/21.
Last week, there was better action in the AD line, breaking the November downtrend (brown line). Continued strength is needed for the rally to be sustainable into early 2022.
The lows made in July, August, September, and December are essential to hold (blue circles), or a more severe correction is likely.
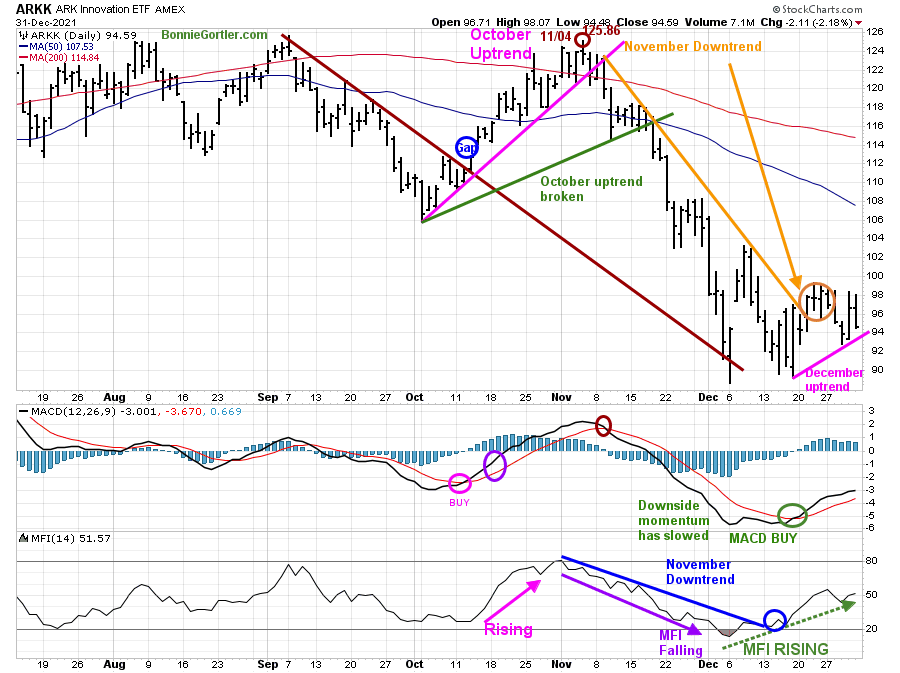
Intraday traders of growth stocks monitor ARKK ETF for a clue to short-term direction if it shows strength and outperforms Nasdaq and the S&P 500.
Figure 11: ARKK Innovation
 Source: Stockcharts.com
ARKK, an actively managed ETF by Cathie Wood, seeks long-term growth with high volatility and risk.
ARKK broke its September short-term downtrend (brown line) in October and gapped up, followed by a failed rally. ARKK then sold off sharply since its peak at 125.86.
ARKK failed to follow through to the upside as investors continued tax selling. ARKK fell -4.00% last week, closing at 94.59. The December uptrend (pink line) remains in effect, but further weakness and a close below would imply the short-term rally is over, and more downside is likely in the short term.
MACD remains on a buy.
Money flow (lower chart) broke the November downtrend and continues to rise, implying investors are buying despite the pullback in late December.
Short-term resistance is 100.00, 103.00, followed by 108.00. Support is at 94.00 and 90.00. A close below 90.00 would imply another leg down is possible.
Summing Up:
Technology, Semiconductors, and Small Caps underperform while defensive sectors led the market higher last week. Market breadth on the NYSE improved. However, Nasdaq’s breadth continues to be concerning, with growth and momentum stocks under selling pressure remaining in a downtrend. The good news is tax-loss selling is over for 2021. Momentum and volume patterns are not favorable. The short-term sentiment (a contrary indicator) shows greed instead of fear. Although the major averages are near new highs, caution is prudent to begin the year. Watch early in the week if the Russell 2000 gains momentum and if Technology and Semiconductors become leaders again to ignite the market higher. However, if the major averages falter and market breadth is negative on the NYSE and Nasdaq with more new lows than highs, prepare an exit strategy to cut your risk as day-to-day volatility could increase quickly with a potential sharp move lower.
Remember to manage your risk, and your wealth will grow.
If you liked this article, you will love my Free Charting Master Class. Get it here:
See more charts in my FB group Wealth Through Market Charts.
I would love to hear from you. If you have any questions or comments or would like to talk about the market, click here.
Disclaimer: Although the information is made with a sincere effort for accuracy, it is not guaranteed that the information provided is a statement of fact. Nor can we guarantee the results of following any of the recommendations made herein. Readers are encouraged to meet with their own advisors to consider the suitability of investments for their own particular situations and for determination of their own risk levels. Past performance does not guarantee any future results.


Create more wealth in your life
with these simple strategies.
As an added bonus you will also
receive BG’s Updates and Ezine

Discover how to quickly create more well-being in your life with these simple strategies.
As an added bonus you will also
receive BG’s Updates and Ezine

As an added bonus you will receive BG’s Updates and Ezine

All work listed on BonnieGortler.com is licensed under a Creative Commons Attribution - Noncommercial - No Derivative Works 3.0 Unported License.


Free Report:
Grow and Sustain Your Wealth
Discover how to grow your money with these easy, simple steps.

