

10 Simple Tips for Financial Well-Being
07/01/2026
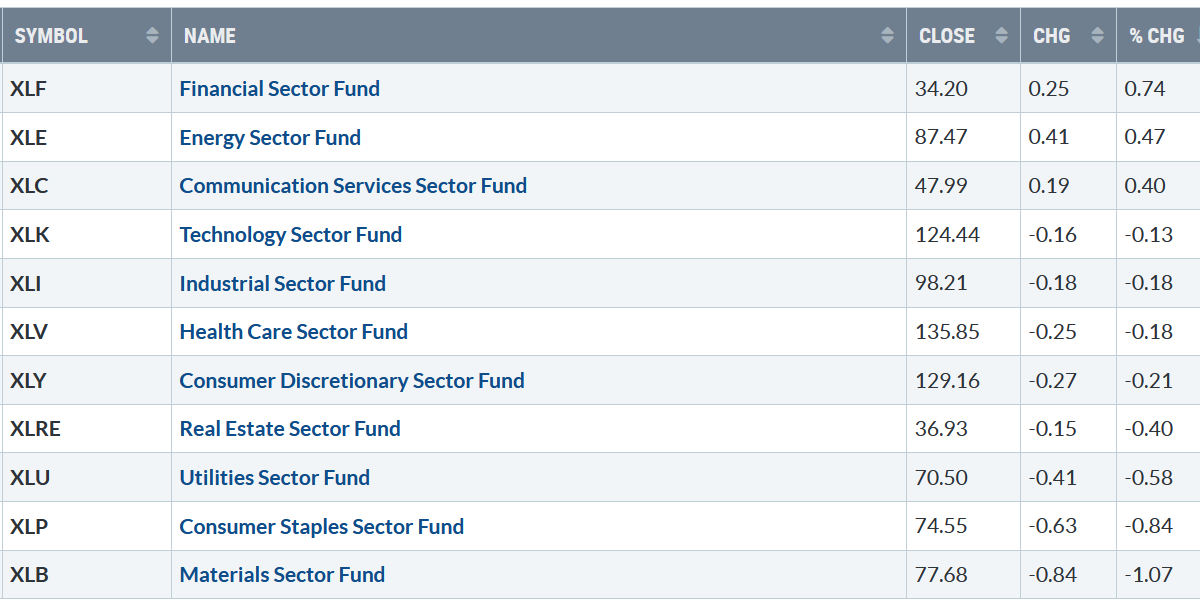
Happy New Year. A fresh start with new opportunities as 2022 comes to an end. Three S&P SPDR sectors were higher for the week, led by the Financials (XLF) and Energy (XLE), Consumer Staples (XLP), and Materials (XLB) were the weakest sectors, with the SPDR S&P 500 ETF Trust (SPY) down -0.26%.
S&P SPDR Sector ETFs Performance Summary
12/23/22 – 12/30/22
123022 SPDR Sectors
Source: Stockcharts.com
Figure 2: Bonnie’s ETFs Watch List
Performance 12/23/22 – 12/30/22
123022 SPDR Sectors 2022 YTD
Source: Stockcharts.com
International markets lagged behind the U.S., although still showing favorable relative strength. US Technology and Semiconductors were lower, but the downside subsided.
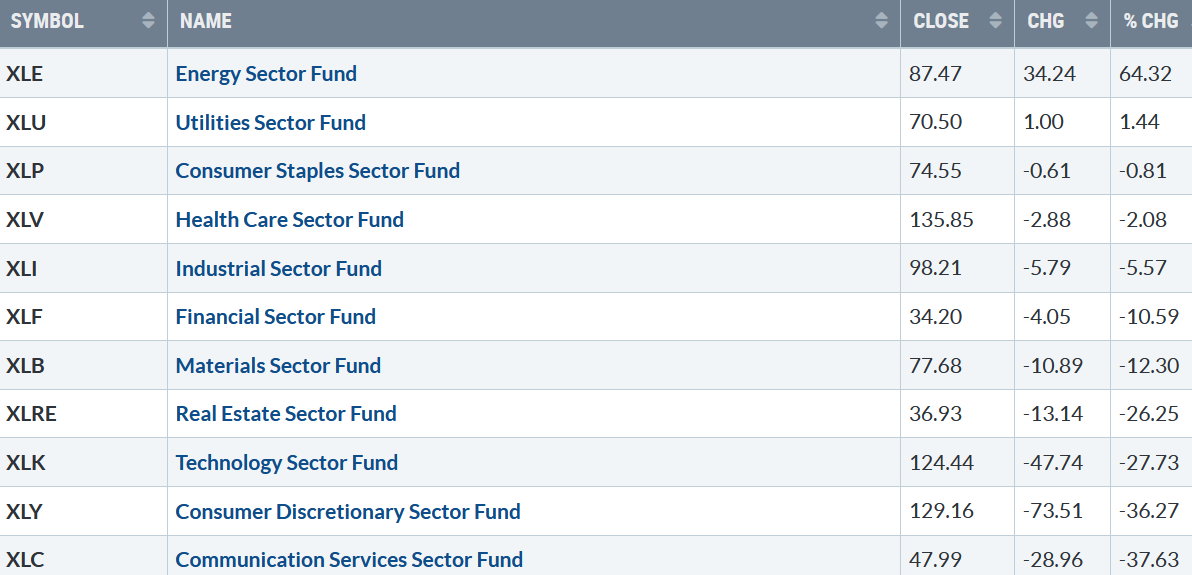
Figure 3: S&P SPDR Sector ETFs Year-End Performance Summary 2022
123022 SPDR Sectors 2022 YTD
Source: Stockcharts.com
The Energy sector was by far the best performer for 2022, Real Estate, Technology, Consumer Discretionary, and Communications Services were the weakest sectors.
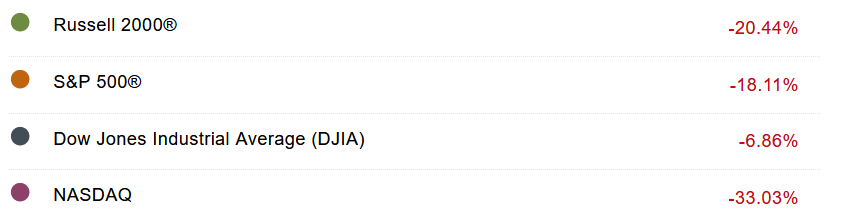
Figure 4: Year-End Performance 2022
123122 averages YTD 2022
Source Schwab
All indices were down for the year, the worst year since 2008.
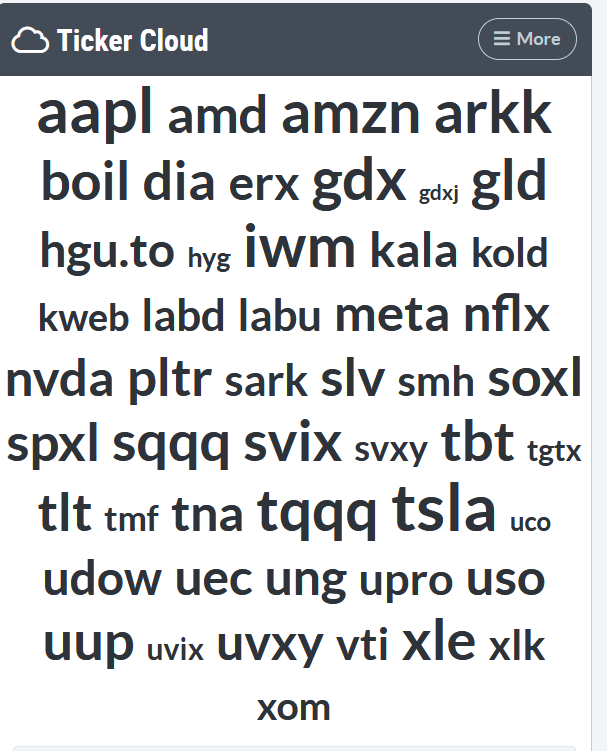
Figure 5: Popular Ticker Symbols 12/30/22
123022 Popular Ticker Symbols
Source: Stockcharts.com
The above is a list of popular symbols of stocks and ETFs among investors.
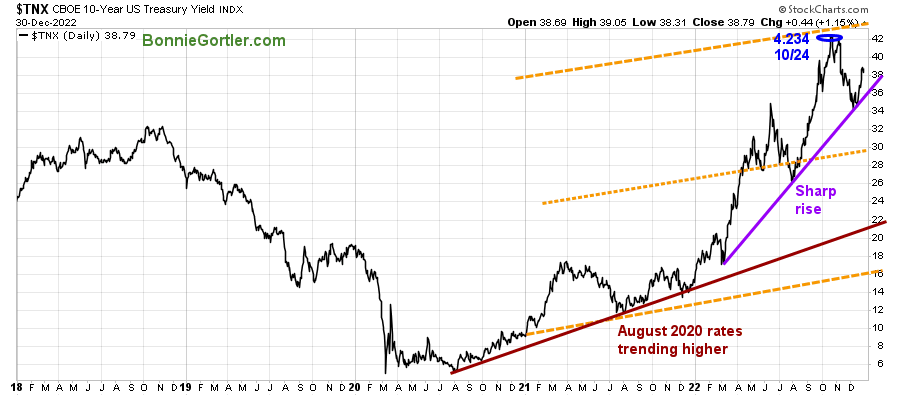
Bond Yields remain in an uptrend
Figure 6: UST 10YR Bond Yields Daily
UST 10 Yr Bond Yields Daily
Source: Stockcharts.com
The 10-Year U.S. Treasury yields rose, closing at 3.879 %, remaining in an uptrend (purple line), with support at 3.60 and 3.00%.
A quiet week ending the year for the major averages, Dow fell -0.17%, S&P 500 down -0.14%, and the Nasdaq lower by -0.30%. The Russell 2000 Index gained +0.02%, and the Value Line Arithmetic Index (a mix of approximately 1700 stocks) was up 0.05%.
Weekly market breadth was negative on the New York Stock Exchange Index (NYSE) and slightly positive for Nasdaq. The NYSE had 1600 advances and 1710 declines, with 165 new highs and 296 new lows. There were 2693 advances and 2432 declines on the Nasdaq, with 279 new highs and 892 new lows.
Market breadth remains worrisome.
New Lows continue to be more than New Highs weekly on the NYSE and Nasdaq.
Nasdaq breadth remains in its 2022 downtrend.
Learn about coaching with Bonnie. Ask questions. Discover more about the coaching processes in this 15-minute call by emailing me at Bonnie@BonnieGortler.com. I would love to connect with you.
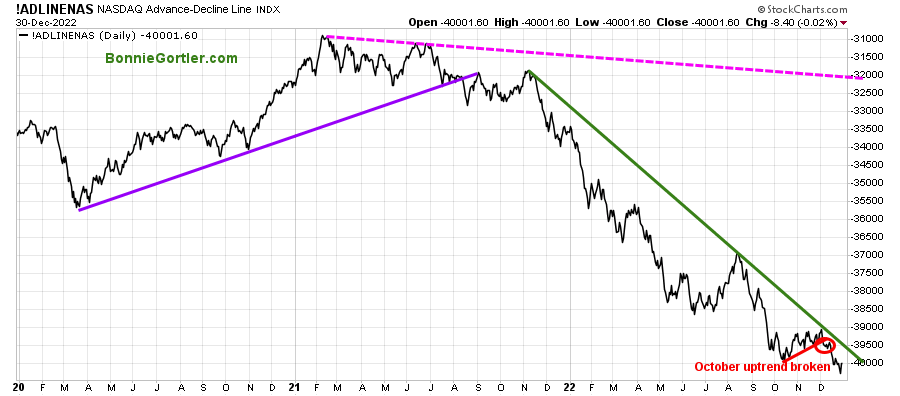
Figure 7: Nasdaq Advance Decline Line Daily
123022 Nasdaq Ad Line Daily
Source: Stockcharts.com
Early in December 2022, Nasdaq breadth failed to break above the 2022 downtrend and turned lower, breaking the October uptrend (red line).
It will continue to be challenging to make money in 2023 in Nasdaq stocks, with stock selection as key as long as the 2022 downtrend remains in effect.
Watch for successive days of more advances than declines, with New lows contracting on the Nasdaq for a potential shift of trend. On Friday, 12/30, the Nasdaq had the fewest stocks making new lows since 12/5/22.
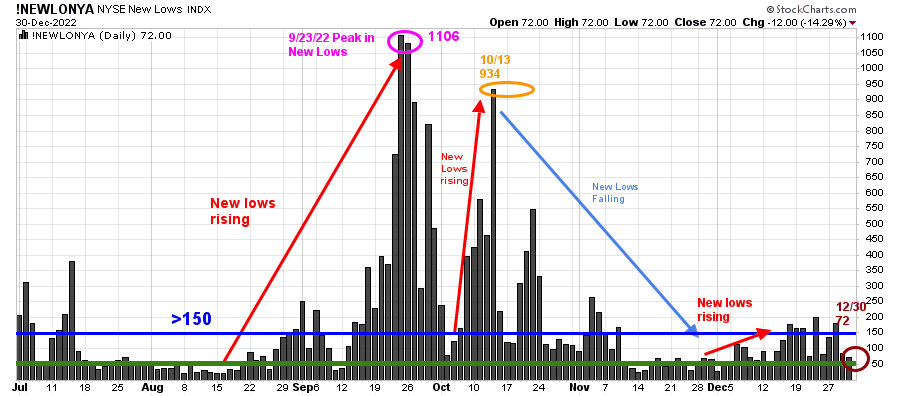
Figure 8: Daily New York Stock Exchange (NYSE) New Lows
123022 NYSE New Lows Daily
Source: Stockcharts.com
Watching New lows on the New York Stock Exchange is a simple technical tool that helps awareness of the immediate trend’s direction.
New lows warned of a potential sharp pullback, high volatility, and “panic selling” for most of 2022, closing above 150. The peak reading was 9/23/22 when New Lows made a new high of 1106 (pink circle).
It remains a positive sign that New Lows have fallen out of the high-risk zone >150.
New Lows closed at 72 (brown circle). If new lows remain below 150 and fall between 25 and 50, that will imply low risk and short-term positive for the market. On the other hand, New Lows rising above 150 would be unfavorable and imply weakness forthcoming.
Learn more about the significance of New Lows in my book, Journey to Wealth, published on Amazon. If you would like a preview, get a free chapter here.
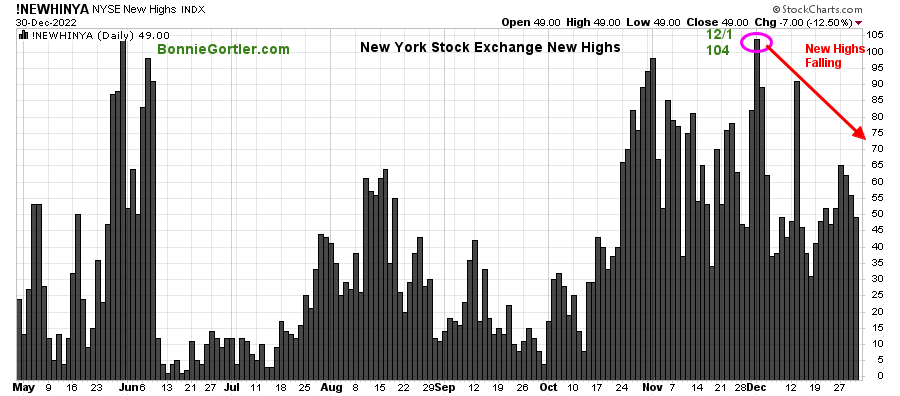
Figure 9: Daily New York Stock Exchange (NYSE) New Highs
123022 NYSE New Highs Daily
Source: Stockcharts.com
A positive sign in the near term will be if New Highs on the NYSE begin to expand, surpassing the December high of 104.
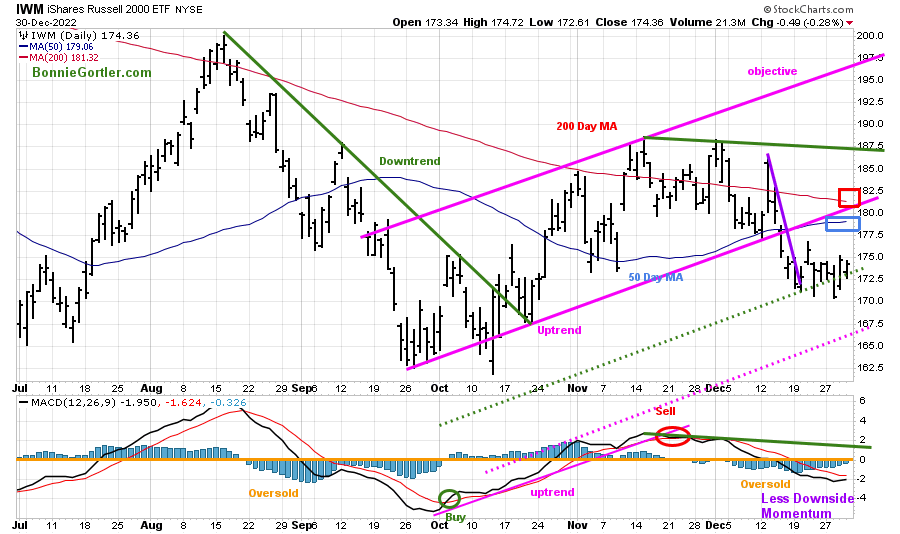
Figure 10: Daily iShares Russell 2000 (IWM) Price (Top) and 12-26-9 MACD (Bottom)
123022 IWM Daily
Source: Stockcharts.com
The top portion of the chart is the daily iShares Russell 2000 Index ETF (IWM), the benchmark for small-cap stocks, with a 50-Day Moving Average (MA) (blue line) and 200-Day Moving Average (MA) that traders watch and use to define trends.
IWM, closing at 174.36 -0.28%, remains below its 200-Day Moving Average (red rectangle) and 50-Day Moving Average (blue rectangle) and remains the channel where it broke down (pink line), which is now resistance.
MACD (middle chart) is on a sell, oversold below 0 (orange line), but its positive momentum is no longer accelerating down, and it can generate a buy if IWM gains strength. Time will tell if the January effect leads to a small cap rally to begin 2023.
Short-term resistance is at 182.50, 187.50, followed by 197.50. Support is at 170.00, followed by 165.00.
A close below 165.00 would imply the decline is likely to accelerate.
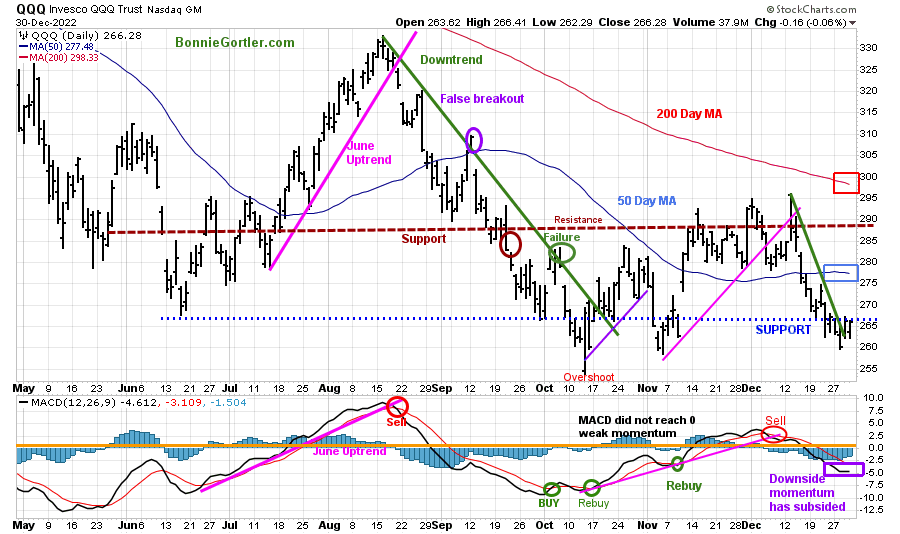
Figure 11: Daily Invesco QQQ Trust (QQQ) Price (Top) and 12-26-9 MACD (Bottom)
123022 QQQ Daily
Source: Stockcharts.com
The chart shows the daily Invesco QQQ, an exchange-traded fund based on the Nasdaq 100 Index. QQQ moved lower after a false break out (purple circle) in September of the August downtrend (green line). In November, QQQ broke its October uptrend (purple line), and the decline continued.
QQQ fell -0.06%, closing at 266.28 as selling pressure subsided.
QQQ support is at 260.00, with resistance at 277.00, 280.00, 290.00, and 300.00.
The bottom chart is MACD (12, 26, 9) on a sell, oversold below 0, with downside momentum slowing, which is a positive sign, but no confirmation of a MACD buy.
Keep an eye on Apple (AAPL) and Microsoft, over 20% combined, which will impact the performance of QQQ if they show strength or drag down QQQ to start 2023.
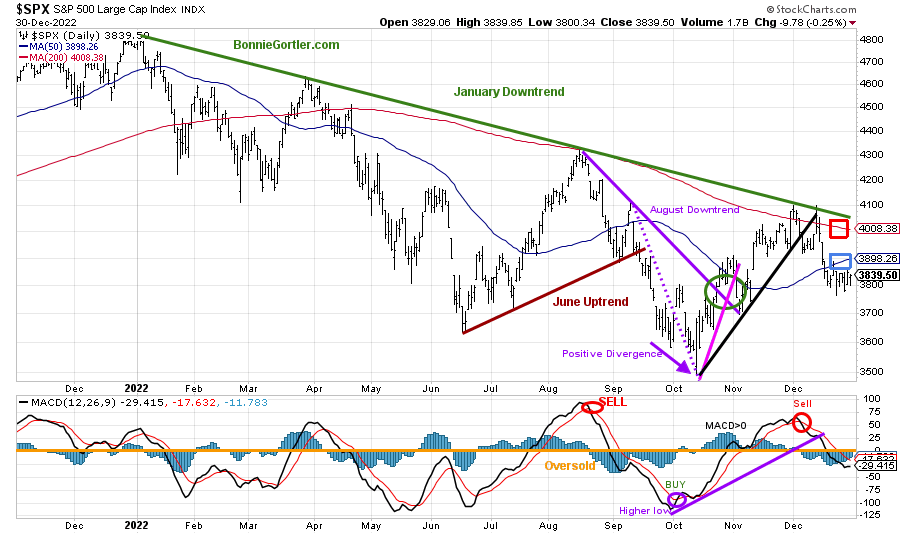
Figure 12: The S&P 500 Index ($SPX) Daily (Top) and 12-26-9 MACD (Bottom)
123022 SPX Daily
Source: Stockcharts.com
The S&P 500 (SPX) 2022 downtrend remains in effect (green line).
The S&P 500 (SPX) failed to get through resistance at 4100 and reversed lower, breaking the October uptrend, which is short-term bearish (black line).
Last week, SPX was slightly down -0.14%, closing at 3839.59, trading in a small range below its 50- and 200-Day Moving Average (blue and red rectangle).
Resistance remains at 3900 and 4100, while support is at 3800 and 3700.
MACD (lower chart) remains on a sell, oversold below 0, in a position to create a buy if the SPX gains momentum in the near term.
Watch for SPX if it can close above resistance at 3900 for a rally or close below support at 3800, and the decline accelerates lower.
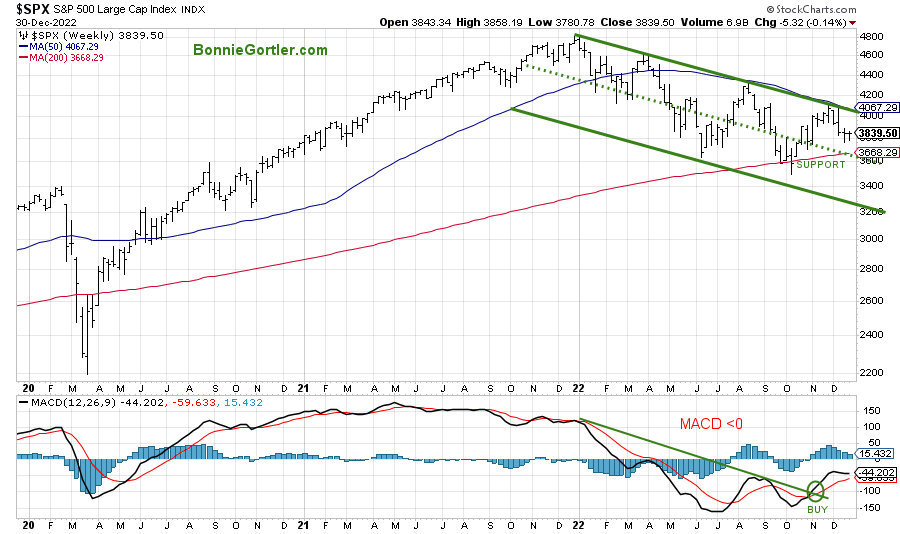
Figure 13: The S&P 500 Index ($SPX) Weekly (Top) and 12-26-9 MACD (Bottom)
123022 SPX Weekly
Source: Stockcharts.com
The top chart shows the weekly S&P 500 Index ($SPX). SPX peaked in January 2022 and is in a downtrend.
MACD is on a buy and has broken the 2022 downtrend, which is favorable, but it remains worrisome that MACD has stopped rising and turned down, not reaching 0 all of 2022, implying weak momentum.
SPX 3600 remains a crucial support area (green dotted line) for the intermediate term that needs to hold the middle channel (green dotted line) or expect another leg down towards 3200. On the other hand, a close above 4100 would excite the bulls.
A buying opportunity ahead in Technology in the short term?
Technology hourly charts are looking better and in position for a rally.
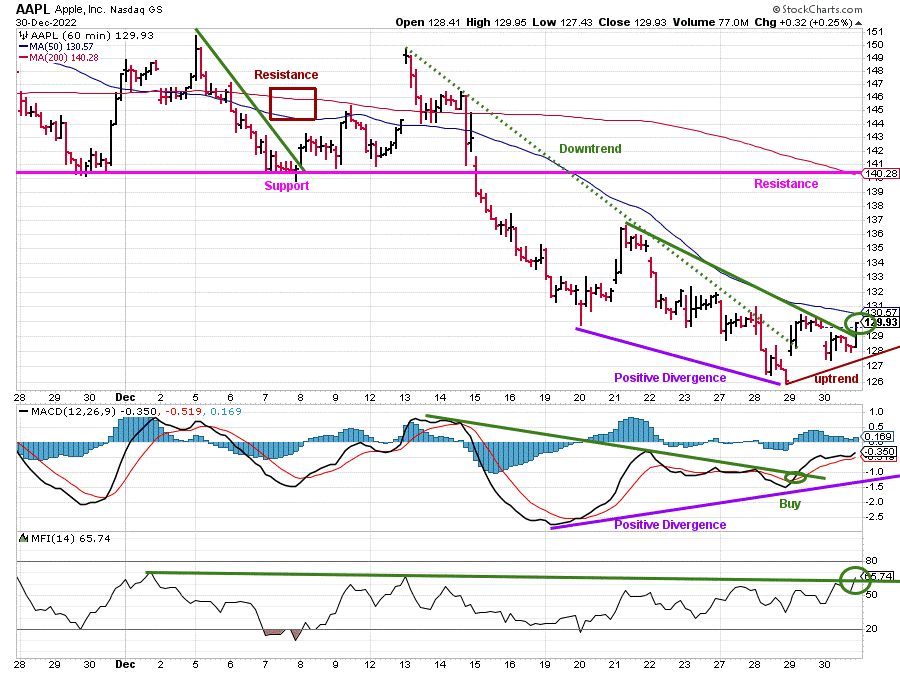
Figure 14: Apple (AAPL) 60-minute (Top) and MACD (Middle) and Money Flow (Bottom)
123022 AAPL 60 Minute
Source: Stockcharts.com
Apple (AAPL), under heavy selling pressure, has remained in an hourly downtrend since December 13.
However, the trend can soon change. Notice the positive divergence (purple line) that has formed (a lower in price and a higher low in MACD) at Friday’s close and the new hourly uptrend from 12/29 (brown line).
MACD is on a buy, with Money Flow turning up (bottom chart), breaking the downtrend (green circle), which is short-term positive.
Short-term resistance is 134.00, followed by 136.00 and 141.00. It will be short-term bullish if AAPL closes above 134.00, helping lead the technology sector higher.
On the other hand, weakness in AAPL below 127.00 would be unfavorable and put pressure on the technology sector.
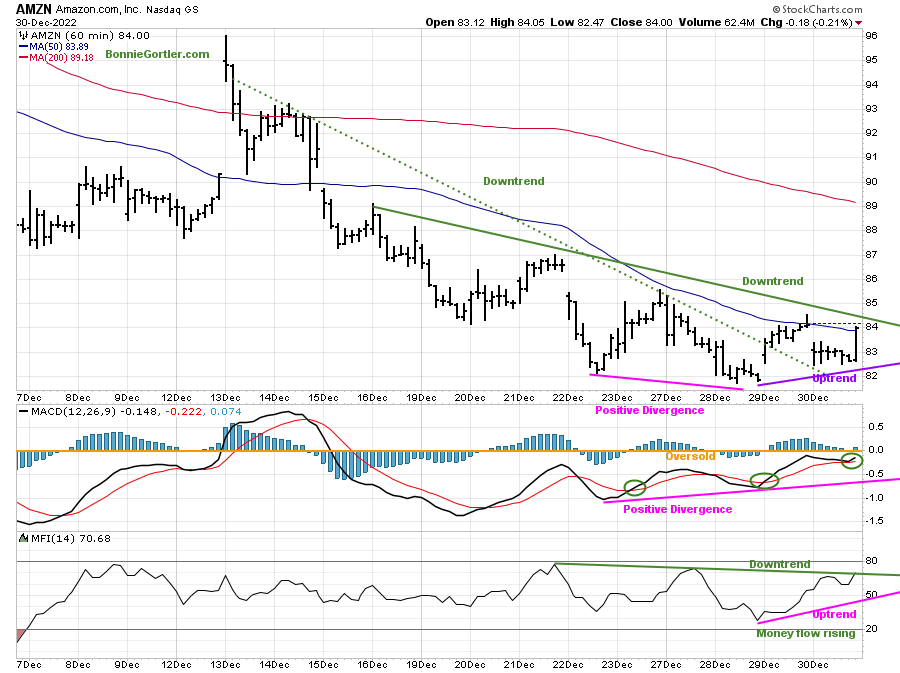
Figure 15: Amazon (AMZN) 60-minute (Top) and MACD (Middle) and Money Flow (Bottom)
123022 AMZN 60 Minute
Source: Stockcharts.com
Amazon (AMZN), in the short term, is looking better and is in an hourly uptrend from December 12, which was tested on December 30 (green dotted line). AMZN appears ready to break the downtrend from December 16 (solid green line) with a close above 85.00.
A positive divergence has formed, a lower low in price with a higher high in MACD (middle chart. MACD has triggered repeat buys and is closer to above 0, implying short-term strength.
A close below 81.00 will break the uptrend and negate my bullish short-term outlook.
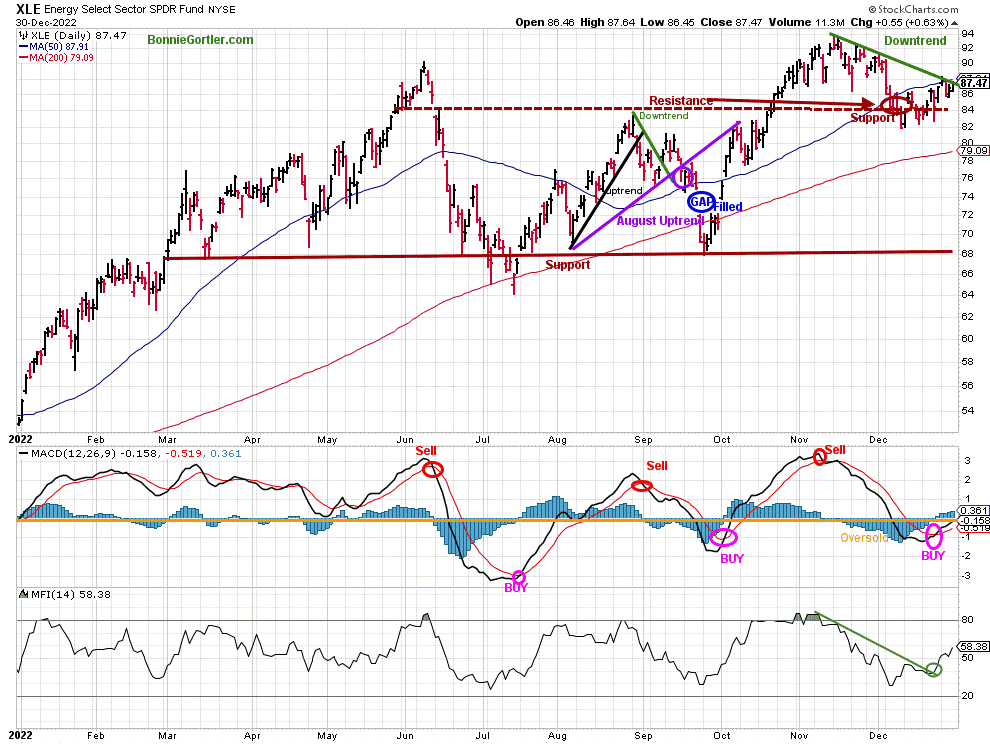
Figure 16: SPDR Energy (XLE) (Top) and 12-26-9 MACD (Bottom)
123022 XLE Daily
Source: Stockcharts.com
Energy (XLE), the best-performing sector of 2022, peaked in November but has lower highs which bear watching.
XLE gained 0.47%, closing at 87.47 in a downtrend (green line) and closing slightly under the 50-Day Moving Average. Support is at 84.00, 81.00, and 78.00, and resistance is at 87.00 and 92.00.
It’s positive MACD generated a buy, with excellent entries in July and October.
Money Flow is favorable, turning up after breaking the November downtrend last week.
Watch for more buying, as portfolio managers and investors will use their cash to rebalance their portfolios to start the New Year. A close below 81.00 would be negative.
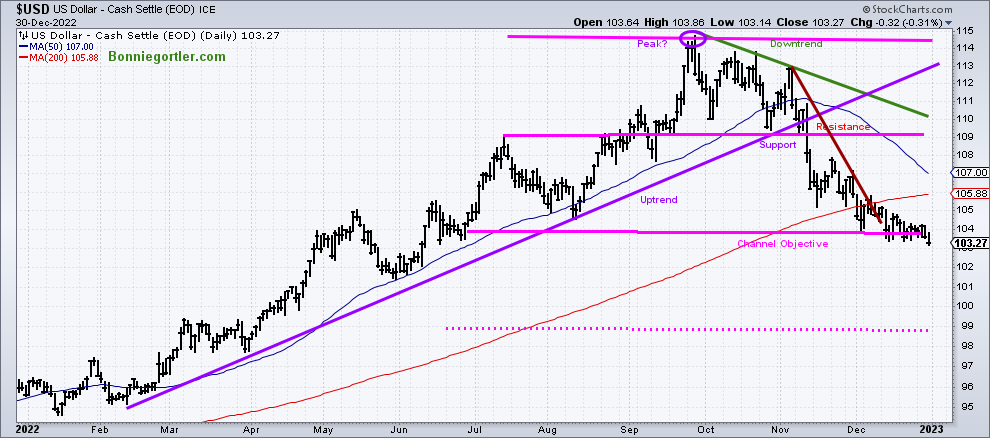
U.S. Dollar weakness continues and is positive for Global and U.S. Equities
Figure 17: U.S. Dollar Daily
123022 USD Daily
The U.S. dollar peaked in September 2022, starting a downtrend that remains in effect.
The U.S. dollar fell -0.71%, closing near its low for the week.
The downside objective was hit at 103.80, giving a new downside objective of 98.80. A close above 106.00 would negate the downside objective.
The continued weakness of the U.S. dollar bodes well for global and U.S. equities in the coming weeks.
Summing Up:
Stocks and bonds struggled in 2022. Selling appears to have subsided over the past two weeks as the major averages have remained in a trading range with the bulls and bears battling but no clear winner. As a result, short-term momentum patterns have stopped accelerating to the downside, now oversold and in a more favorable position where rallies begin. Tax selling is now over, with a fresh start in 2023 beginning. Be alert for technology stocks that have been laggards to ignite the broad market higher in the short term.
Remember to manage your risk, and your wealth will grow.
Let’s talk investing. You are invited to set up your Free 30-minute Wealth and Well-Being Strategy session by clicking here or emailing me at Bonnie@BonnieGortler.com. I would love to connect with you.
If you liked this article, you will love my Free Grow and Sustain Your Wealth Report. Get it here:
Disclaimer: Although the information is made with a sincere effort for accuracy, it is not guaranteed that the information provided is a statement of fact. Nor can we guarantee the results of following any of the recommendations made herein. Readers are encouraged to meet with their own advisors to consider the suitability of investments for their own particular situations and for determination of their own risk levels. Past performance does not guarantee any future results.


Create more wealth in your life
with these simple strategies.
As an added bonus you will also
receive BG’s Updates and Ezine

Discover how to quickly create more well-being in your life with these simple strategies.
As an added bonus you will also
receive BG’s Updates and Ezine

As an added bonus you will receive BG’s Updates and Ezine

All work listed on BonnieGortler.com is licensed under a Creative Commons Attribution - Noncommercial - No Derivative Works 3.0 Unported License.


Free Report:
Grow and Sustain Your Wealth
Discover how to grow your money with these easy, simple steps.

