

10 Simple Tips for Financial Well-Being
07/01/2026
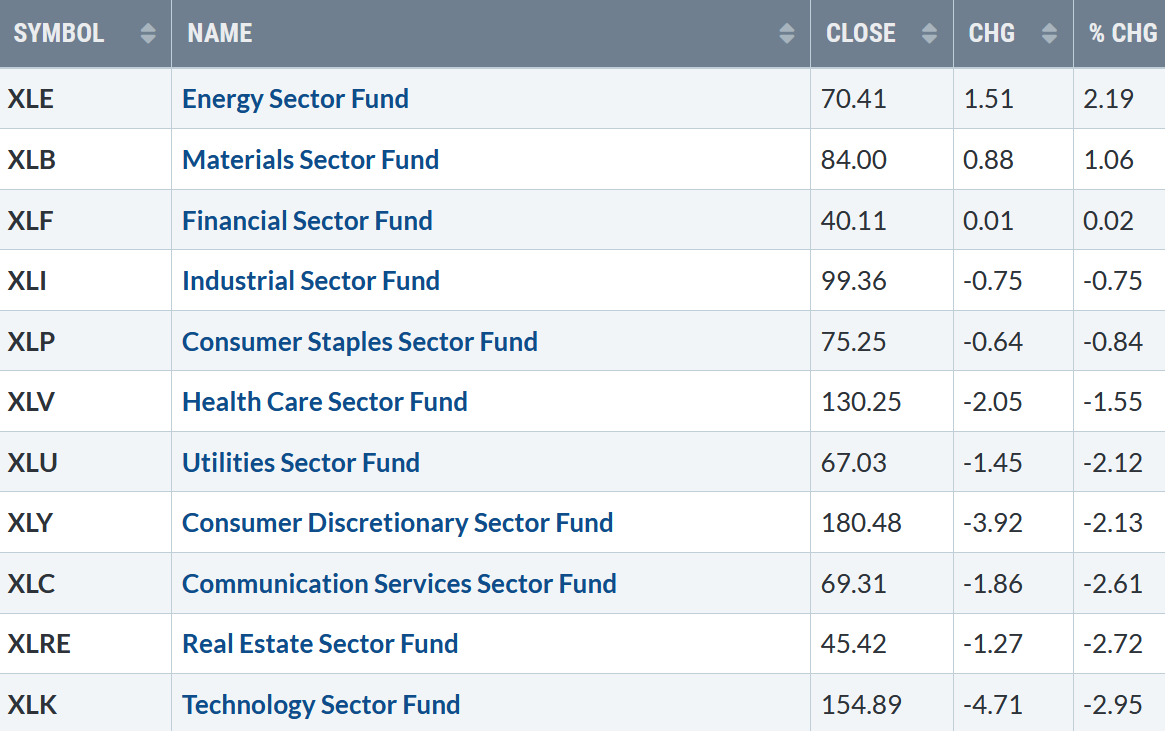
As the week progressed, stocks weakened. Three of the eleven sectors rose, while the SPDR S&P 500 ETF Trust (SPY) was down -1.84%. Energy (XLE) and Materials (XLB) were the strongest, while Real Estate (XLRE) and the Technology Sector (XLK) were the weakest.
S&P SPDR Sector ETFs Performance Summary
2/4/22 – 2/11/22
021222 SPDR Sectors
Source: Stockcharts.com
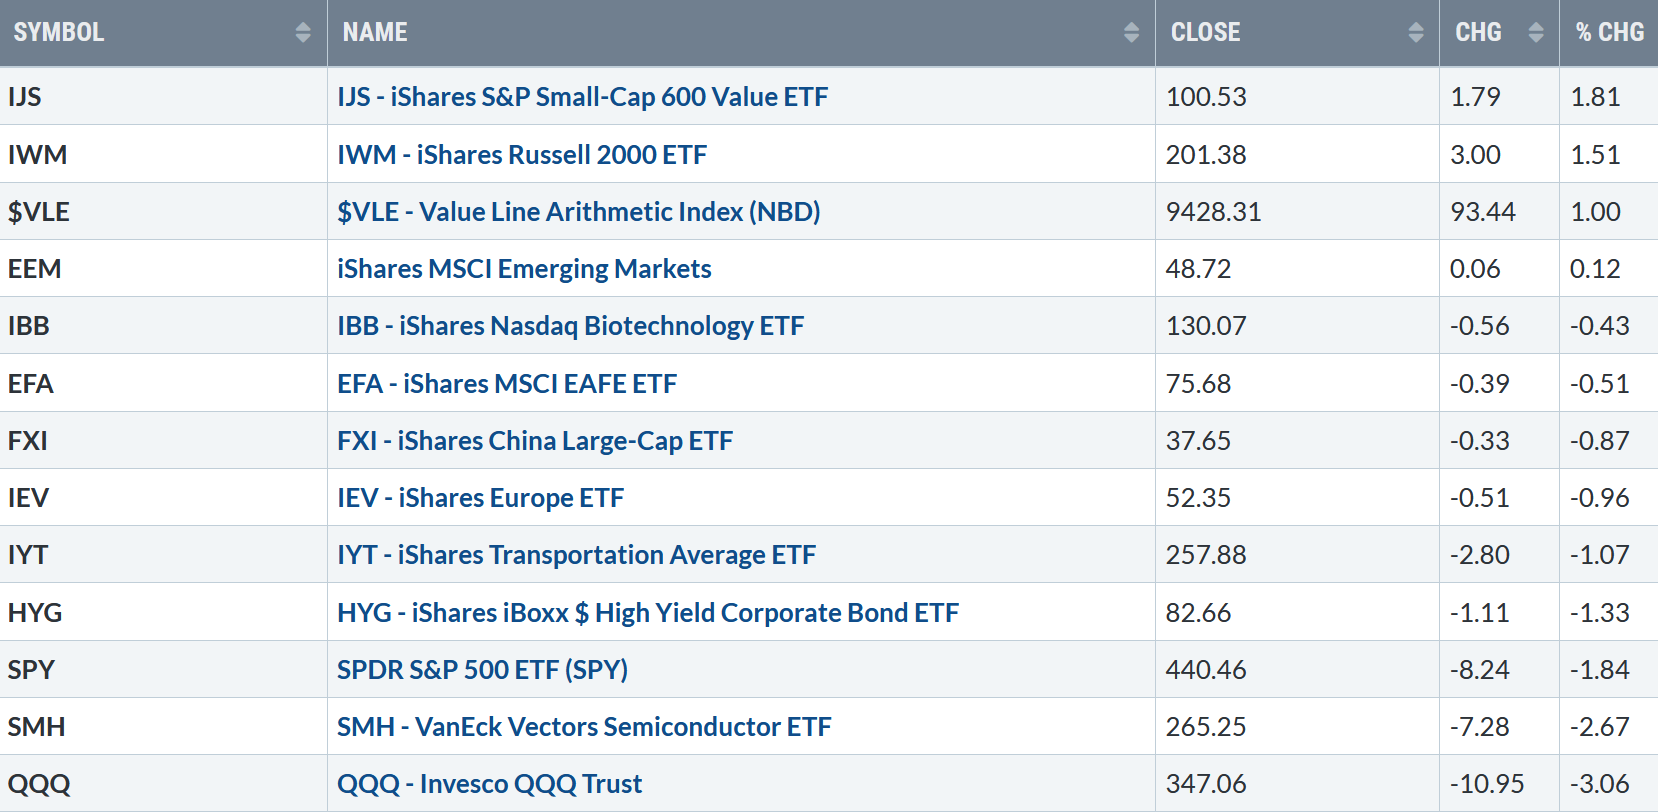
Figure 2: Bonnie’s Mix of ETFs To Monitor
Summary 2/4/22 – 2/11/22
021122 Weekly Performance ETFs
Source: Stockcharts.com
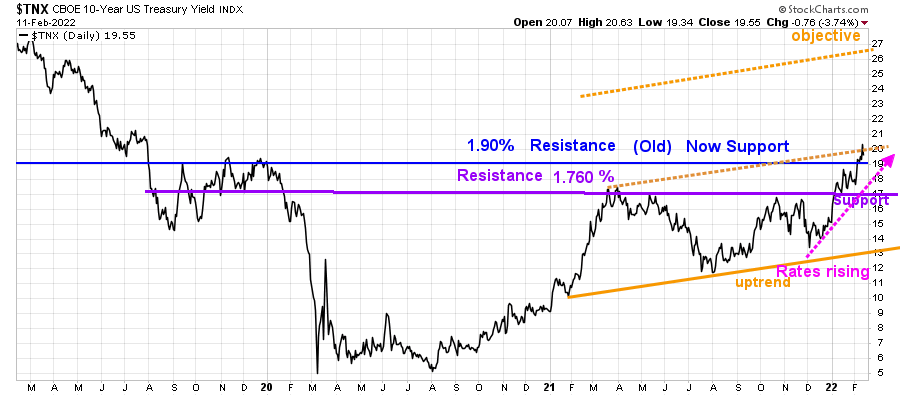
Small Caps rebounded. Technology and Semiconductors weakened, and Hi-Yield bonds continued to slide, which is troubling. 10-Year U.S. Treasury yields rose over 2% intra-week, for the first time since 2019, closing at 1.955% (Figure 3). The upside channel objective is 2.7%.
Figure 3:10-Year U.S. Treasury Yield
21122 UST 10YR Bond Yields Daily
Source: Stockcharts.com
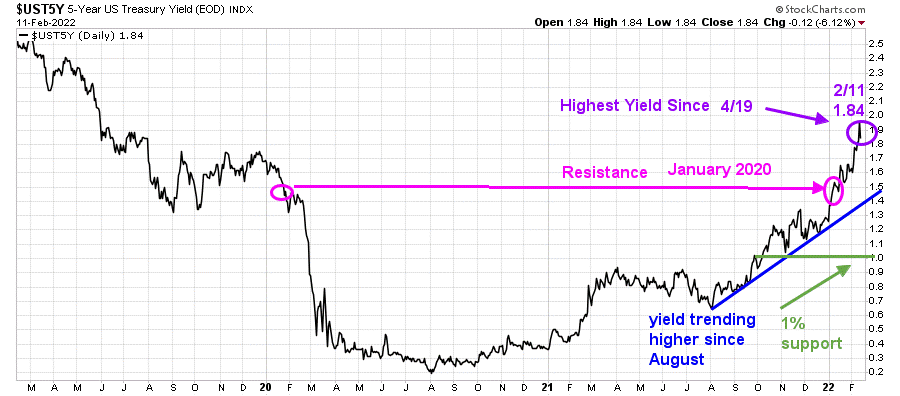
Figure 4: 5-Year U.S. Treasury Yield
 Source: Stockcharts.com
5-Year U.S. Treasury yields rose to 1.84%, the highest level since May 2019 ( purple circle), continuing to make higher highs.
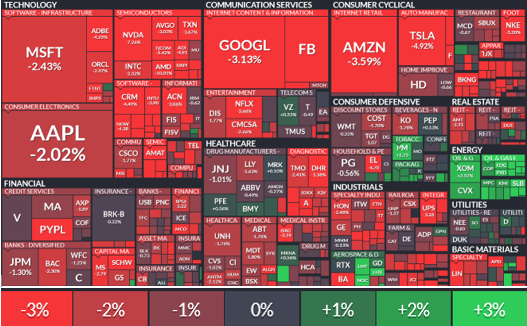
Figure 5: S&P 500 Stocks Heat Map 02/11/22
021122 finviz heat map
Source: Finviz.com
Much of the damage to the major averages last week was in the last two hours of trading on Friday on increasing tensions between Ukraine and Russia. The major averages gave back their gains from the previous week. The Dow fell -1.00%, S&P 500 fell -1.82%, while Nasdaq dropped -2.18%.
The Russell 2000 Index bucked the trend last week, gaining +1.39%, and the Value Line Arithmetic Index (a mix of approximately 1700 stocks also rose +1.0%.
Weekly market breadth was negative. The New York Stock Exchange Index (NYSE) had 1639 advances and 1956 declines. Nasdaq had 2592 advances and 2650 declines. There were 194 New Highs and 606 New Lows on the NYSE and 214 New Highs, and 774 New Lows on the Nasdaq. Although the major averages were down for the week, market breadth is beginning to show some signs of improvement.
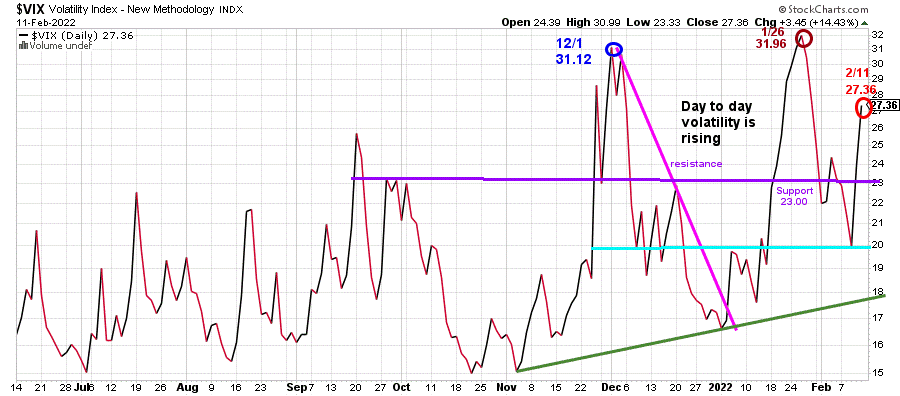
Figure 6: CBOE Volatility Index VIX
21122 VIX Daily
Source: Stockcharts.com
The CBOE Volatility Index ($VIX), a measure of fear, has been above average in 2022. VIX peaked at 31.96 on 1/26, slightly higher than the high made on 12/1/ 21 (blue circle).
Volatility quieted early last week. However, volatility picked up as stocks weakened. VIX closing at 27.36 (red circle) above support at 23.00 but below the 1/26 high.
Expect day-to-day volatility to continue if VIX remains above 20.00, and the market becomes even more volatile if VIX closes above 31.96.
On the other hand, day to day volatility is likely to potentially lesson if VIX falls below 23 and then stay in a trading range between 18.00 and 20.00
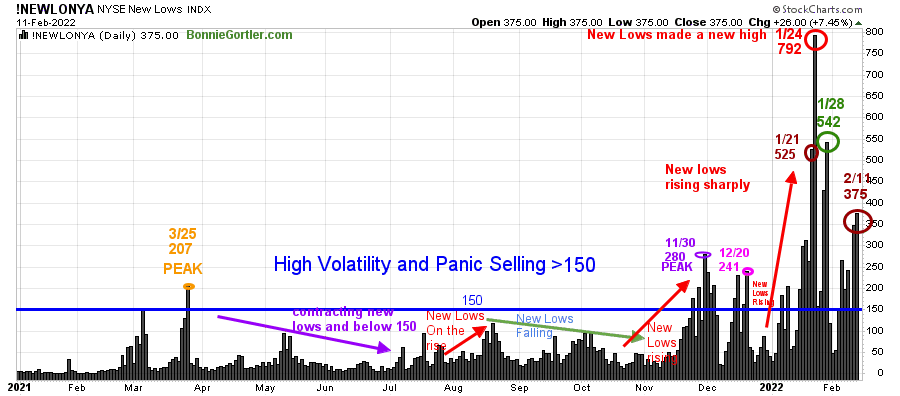
Figure 7: Daily New York Stock Exchange (NYSE) New Lows
21122 Daily NYSE New Lows
Source: Stockcharts.com
Watching New lows on the New York Stock Exchange is a simple technical tool that helps awareness about the immediate trend’s direction.
New lows warned of a potential sharp pullback, high volatility, and “panic selling” for most of 2022, closing above 150. Learn more about the significance of New Lows in my book, Journey to Wealth, published on Amazon. Here is an excerpt, When new lows are above 150, the market is negative, higher risk, selling is taking place. Sometimes it could be severe, and sometimes on a very nasty day, you can have “panic selling,” and big wild swings (high volatility) to the downside may occur.
As the market sold off in January, New Lows rose sharply, peaking at 792 (red circle) on 1/24. New Lows then narrowed to 542 (green circle) on 1/28 and began to contract but not enough to be in a safe, low-risk zone.
New lows are on the rise, closing at 375. on 2/11 (brown circle). As long as New Lows remain above 150, caution is necessary, implying high risk. On the other hand, if News Lows contracts below 150 and ultimately between 25 and 50, it would indicate lower risk and that the bottoming process is likely over and further gains ahead.
For now, the risk remains high, and the bottoming process continues.
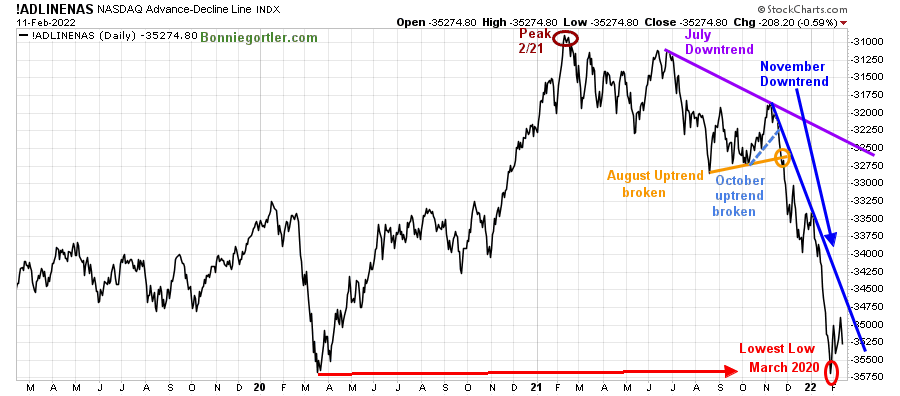
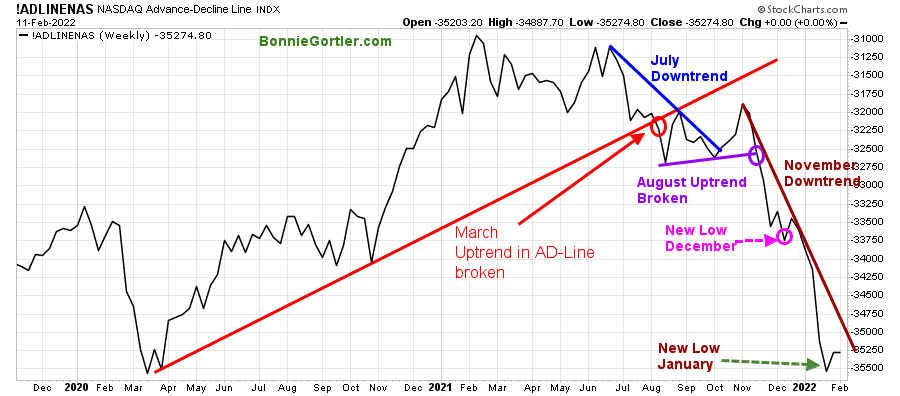
Figure 8: Daily Nasdaq Advance-Decline Line
20422 Nasdaq Daily AD Line
Source: Stockcharts.com
Market breadth on the Nasdaq remains in a downtrend in 2022.
The daily Nasdaq AD-Line peaked in February 2021 (brown circle), followed by failed attempts to make a new high.
After breaking the October uptrend (blue dotted line), the AD-Line made a series of lower highs and lower lows in November, December, and January. Two clear-down trends (blue and purple) remain in effect.
A bottoming pattern is developing. The AD-Line closed slightly higher than its March 2020 new low (red circle). However, if there are more advances than declines this week and the AD-line turns up breaking the November downtrend (blue line), it would be the first confirmation that a potential short-term bottom has been made.
Figure 9: Weekly Nasdaq Advance-Decline Line
20422 Nasdaq Weekly AD Line
Source: Stockcharts.com
After breaking down in August last year, the Nasdaq-line Weekly AD-Line made a few attempts to form a bottom but failed.
Even though the Nasdaq fell, it’s a positive sign that the weekly Ad-Line did not make a new low. A rise breaking the November downtrend will imply that most selling is complete, and an intermediate bottom has occurred. However, with more weakness in Nasdaq, and if a new low is made, then risk increases of further downside. Therefore, more time is needed to see if a safe buying pattern develops for the intermediate trend.
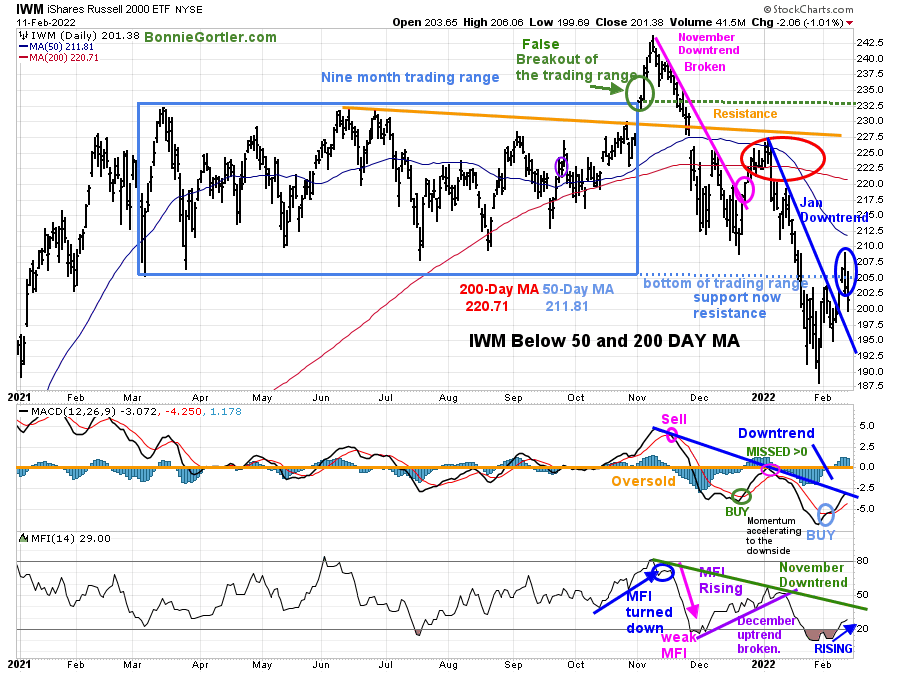
Figure 10: Daily iShares Russell 2000 (IWM) Price (Top) and 12-26-9 MACD (Middle and Money Flow (Bottom)
21122 DAILY IWM
Source: Stockcharts.com
The top portion of the chart is the daily iShares Russell 2000 Index ETF (IWM), the benchmark for small-cap stocks, with a 50-Day Moving Average (MA) (blue line) and 200-Day Moving Average (MA), that traders watch and use to define trends. A false breakout occurred in November 2021 in IWM after being in a nine-month trading range.
IWM closed up +1.52% for the week stronger than the S&P 500 and the Nasdaq. However, IWM remains below its 50 and 200-Day Moving Average, and the short-term downside objective remains at 178.00.
The January downtrend was penetrated but failed to generate any upside momentum. IWM stalled near 205.00 resistance and turned down. However, a pattern of higher lows has developed which is bullish in the short term if IWM turns up without making a lower low.
Support is at 200.00, followed by 195.00 and 187.00. Resistance is 205.00 and 210.00.
MACD (middle chart) is on a buy, now close to breaking the November downside trendline (blue line. More strength in MACD would imply the downside momentum has subsided.
Money Flow (lower chart) is oversold and now rising, a positive sign in the short term.
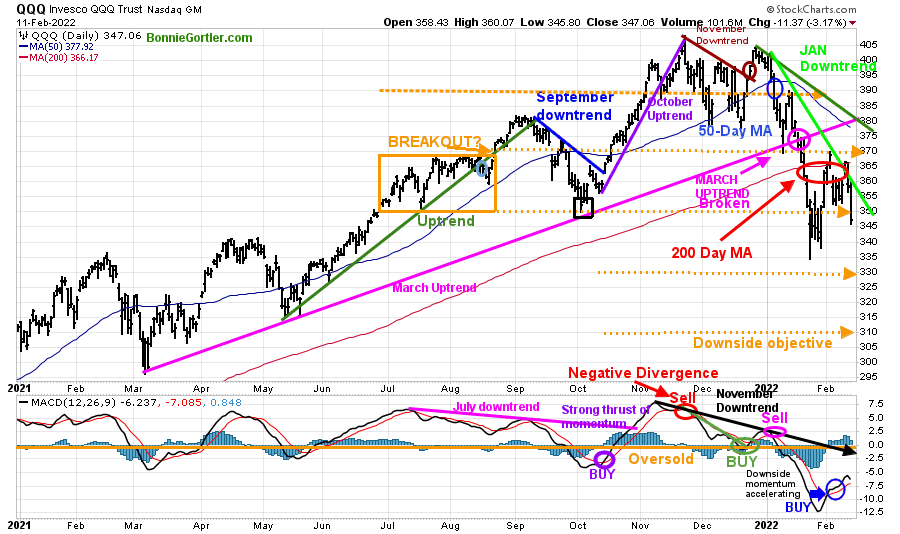
Figure 11: Daily Invesco QQQ Trust (QQQ) Price (Top), and 12-26-9 MACD (Bottom)
21122 QQQ Daily
Source: Stockcharts.com
The chart shows the daily Invesco QQQ, an exchange-traded fund based on the Nasdaq 100 Index with its 50-Day Moving Average and 200-Day Moving Average.
In June, QQQ was in a trading range (orange rectangle). After breaking the short-term downtrend (blue line), QQQ rallied in October and continued to climb in November, barely missing its upside target of 410.00 on 11/22 with a high of 408.71 before reversing lower. In December, QQQ failed to make a new high and broke down below the first support at 390.00 and below the 50-Day Moving Average (blue circle), shifting the trend to down.
A volatile week for QQQ closing down -3.06% at 347.06, below the 200-Day Moving Average (red circle) and unable to follow through after a slight penetration of the January downtrend (green line). The downside objective remains at 330.00, followed by 310.00.
Resistance is at 350.00 followed by 360.00 and 370.00. A close above 370.00 would likely trip the buy stops. Support is at 340.00 and 335.00. On the other hand, A close below 335.00 is likely to trip the sell stops.
The lower chart is MACD (12, 26, 9), a measure of momentum. MACD is on a buy but remains in a downtrend (black line), implying downside momentum remains. On the other hand, Money Flow is rising sharply and at its highest level since November and has broken the November downtrend (chart not shown). Time will tell MACD will soon confirm the bullish pattern in Money Flow.
Intermediate-Term Trend Remains Down But Now Oversold Where Potential Buying Opportunities Develop
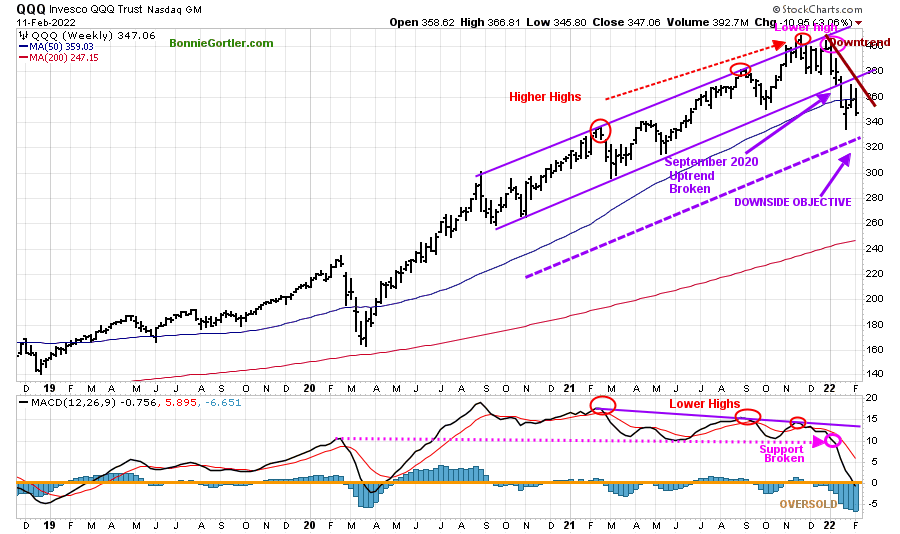
Figure 12: Weekly Invesco QQQ Trust (QQQ) Price (Top), and 12-26-9 MACD (Bottom)
21122 QQQ Weekly
Source: Stockcharts.com
The top chart shows the weekly Invesco QQQ Trust (QQQ) making higher highs peaking in November 2021 (red circles) but failed to make a new high in December and then turned down.
The September 2020 uptrend broke down three weeks ago (middle purple line), giving a downside objective to 325.00 (lower channel).
MACD (lower chart) remains on a sell after making lower highs and breaking below support held since February 2020 (pink dotted line), implying weak underlying momentum. MACD has accelerated lower, now oversold, below 0, where sustainable buying opportunities occur.
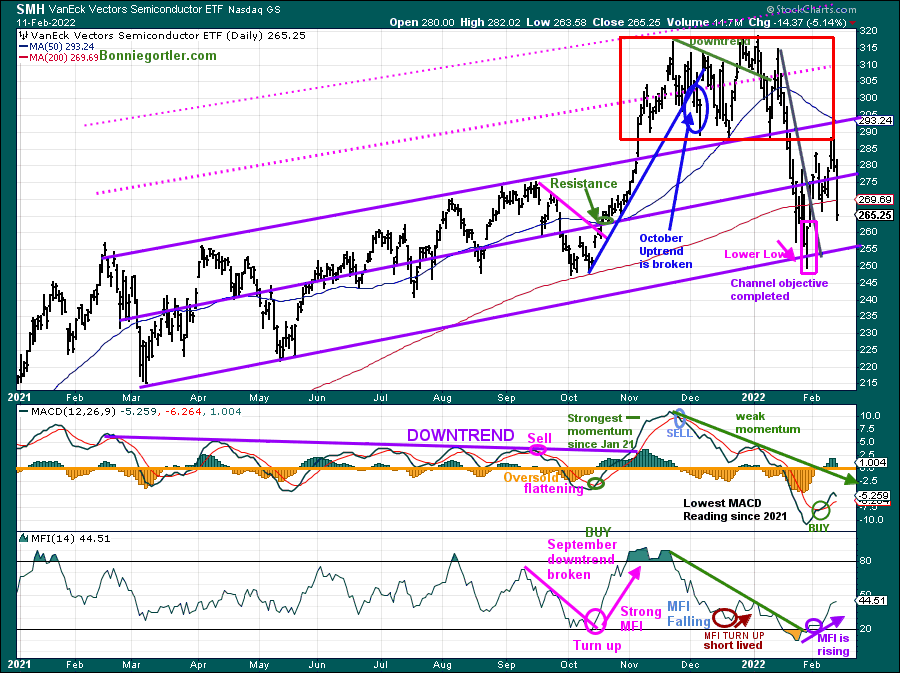
Figure 13: Van Eck Semiconductors (SMH) Daily Price (Top), 12-26-9 MACD (Middle) and, Money Flow (Bottom)
21122 SMH Daily
Source: Stockcharts.com
Semiconductors (SMH) broke through resistance in October (green arrow) and surged higher until late November. SMH stalled, and the October uptrend violated (blue line), followed by a trading range. Support was broken (red rectangle), and SMH fell sharply.
After making a lower low below the lower channel (pink), SMH moved higher and has been highly volatile. Last week SMH fell -3.66%, more than QQQ, closing at 265.25 below the 50 and 200 Day Moving Average.
Resistance is at 275.00, followed by 290.00 and 310.00. Support is at 255.00 and 235.00. The next downside channel objective is if support at 255.00 doesn’t hold.
MACD (middle chart) generated a buy (green circle) from an extremely oversold level implying the worst of the decline is over. I continue to want confirmation of MACD to break the December downtrend to confirm.
Money flow (lower chart) turned up (purple circle) and has already broken the downtrend (green line), a positive sign SMH will rise once the bottoming process is complete.
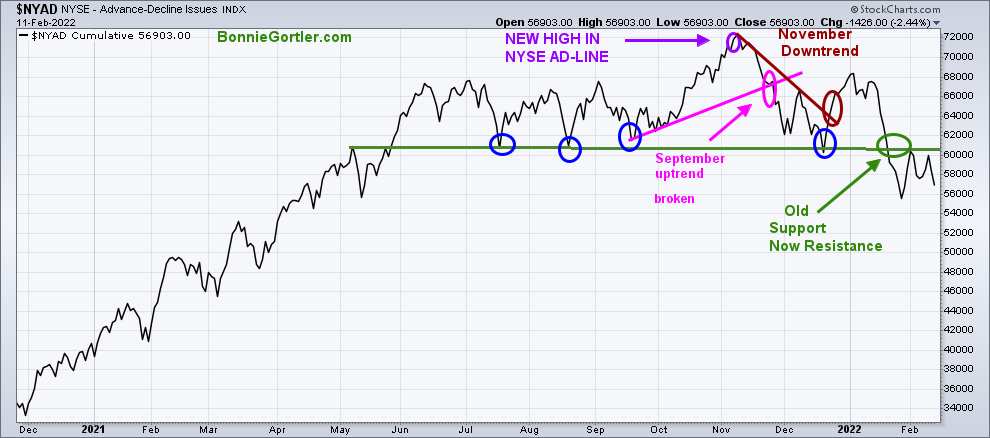
Figure 14: New York Stock Exchange AD-Line
21122 NYSE Daily AD Line
Source: Stockcharts.com
The NYSE A/D line made a new high on 11/8/21. In December, the AD line broke the November downtrend (brown line) but did not make a new high warning of a pending correction forthcoming in the NYSE. The lows made in July, August, September, and December (blue circles) did not hold and broke down in January (green circle).
Old support is resistance, and risk remains of further weakness.
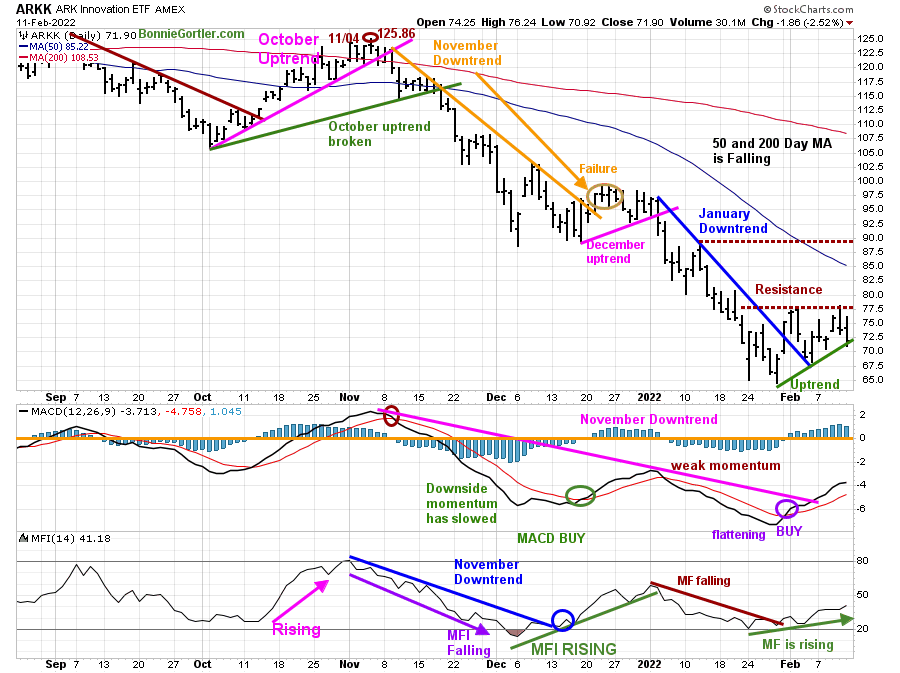
Figure 15: ARKK Daily
21122 ARKK Daily
Source: Stockcharts.com
ARKK is an actively managed ETF by Cathie Wood that seeks long-term growth and is highly volatile. ARKK broke its September short-term downtrend (brown line) in October 2021, followed by a failed rally peaking at 125.86 on 11/04/21. Once ARKK fell below support at 94.00, it broke through the December uptrend (pink line) and accelerated lower.
The January downtrend was broken the previous week, shifting the short-term trend to up, signaling traders are more interested in growth stocks. However, the short-term uptrend (green line) is in jeopardy if ARKK closes below 70.00 and increases the risk of a January low test.
ARKK rallied early in the week but stalled at resistance and turned down, falling -1.17%, closing at 71.90, down less than the S&P 500 and Nasdaq.
The downside momentum in ARKK appears to have stabilized and is worth watching to see if it remains stronger than the S&P 500 and the Nasdaq, which would be positive for the broad market.
Resistance is at 74.00, followed by 77.50 and 90.00. Support is at 70.00, followed by 67.50 and 64.00. A close below 64.00 would imply the rally failed and further downside.
MACD is on a buy, improving momentum and an upside breakout of the November downside trendline is favorable.
Money flow (lower chart) is rising and has already broken the 2022 downtrend implying ARKK is likely to go higher in the short term.
ARKK remains high-risk volatile. The bears and the bulls are in battle. A close above 77.50 is likely to wake up the bulls and lead to a sharp, quick, rally so don’t get caught short.
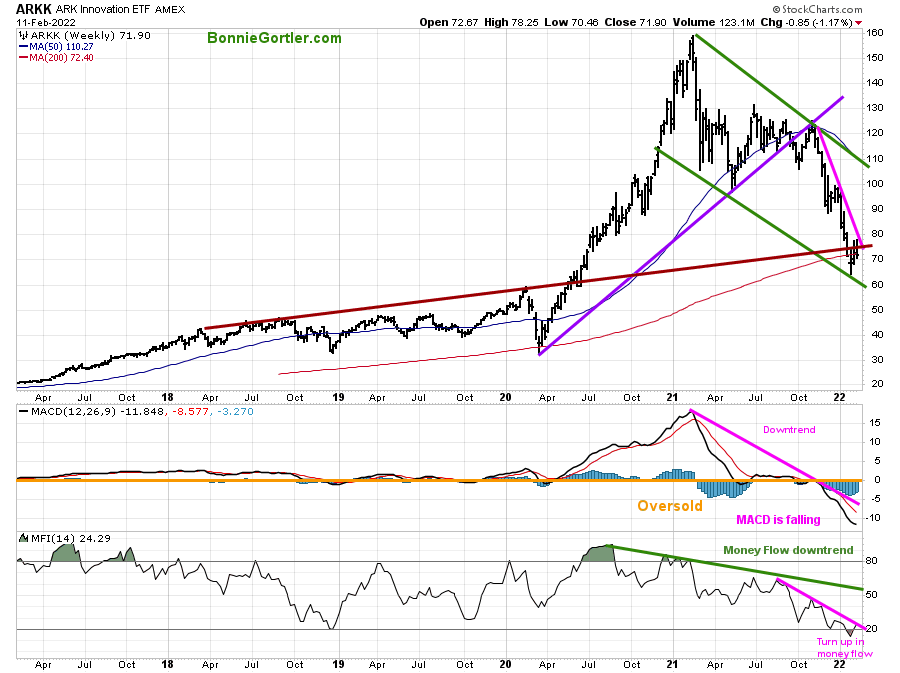
Figure 16: ARKK Weekly
21122 ARKK Weekly
Source: Stockcharts.com
The intermediate trend of ARKK remains down, yet is promising,
MACD (middle chart) is flattening, and Money Flow has turned up and is close to breaking the downtrend from September 2021. Be alert to the potential change in trend.
A shift in leadership may be developing
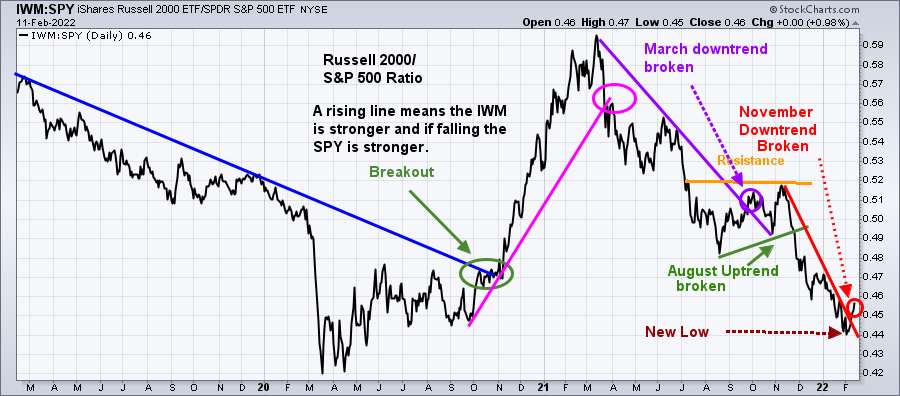
Figure 17: Daily Relative Strength Ratio Russell 2000 (IWM)/S&P 500 (SPY)
21122 IWM -SPY Relative Strength Ratio Daily
A rising line means the IWM is stronger, and if falling, the SPY is stronger.
It’s positive for the overall market that the IWM/SPY ratio turned up last week, breaking the November downtrend, and is now leading in relative strength compared to the S&P 500.
Summing Up:
The major averages declined on increased intraday volatility. Investors are concerned about tensions between Ukraine and Russia, higher yields, and inflation. The bottoming process continues. The January 16th lows are holding. Momentum oscillators are no longer accelerating to the downside as market internals are improving. Small Caps are acting better and gaining relative strength, which is favorable for the broad market. Sentiment continues to show fear helping the bullish case. Watch for strength in Small Caps, Semiconductors, Technology, and improvement in market breadth on the NYSE and Nasdaq for the bulls to get excited and regain control.
Remember to manage your risk, and your wealth will grow.
If you liked this article, you would love my Free Grow and Sustain your Wealth Report. Get it here:
See more charts, I invite you to my FB group Wealth Through Market Charts.
I would love to hear from you. If you have any questions or comments or would like to talk about the market, click here.
Disclaimer: Although the information is made with a sincere effort for accuracy, it is not guaranteed that the information provided is a statement of fact. Nor can we guarantee the results of following any of the recommendations made herein. Readers are encouraged to meet with their own advisors to consider the suitability of investments for their own particular situations and for determination of their own risk levels. Past performance does not guarantee any future results.


Create more wealth in your life
with these simple strategies.
As an added bonus you will also
receive BG’s Updates and Ezine

Discover how to quickly create more well-being in your life with these simple strategies.
As an added bonus you will also
receive BG’s Updates and Ezine

As an added bonus you will receive BG’s Updates and Ezine

All work listed on BonnieGortler.com is licensed under a Creative Commons Attribution - Noncommercial - No Derivative Works 3.0 Unported License.


Free Report:
Grow and Sustain Your Wealth
Discover how to grow your money with these easy, simple steps.

