

10 Simple Tips for Financial Well-Being
07/01/2026
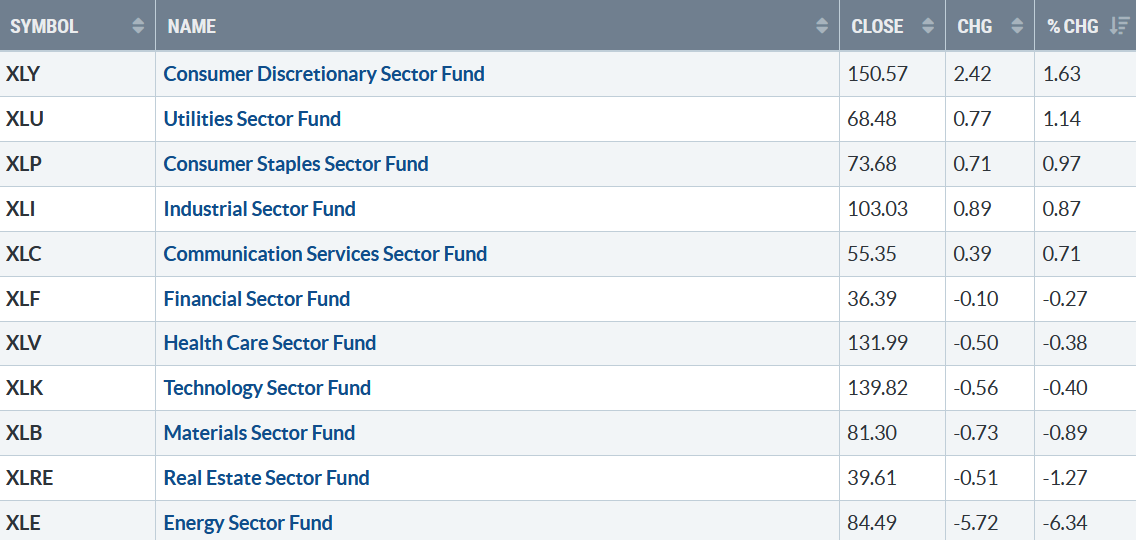
There was some selling pressure last week, with only five of eleven S&P SPDR sectors being higher. Consumer Discretionary (XLY) and Utilities XLU) were the leading sectors, while Energy (XLE) and Real Estate (XLRE) were the weakest, with the SPDR S&P 500 ETF Trust (SPY) down -0.25%.
S&P SPDR Sector ETFs Performance Summary 2/10/23 – 2/17/23
021723 SPDR Sectors
Source: Stockcharts.com
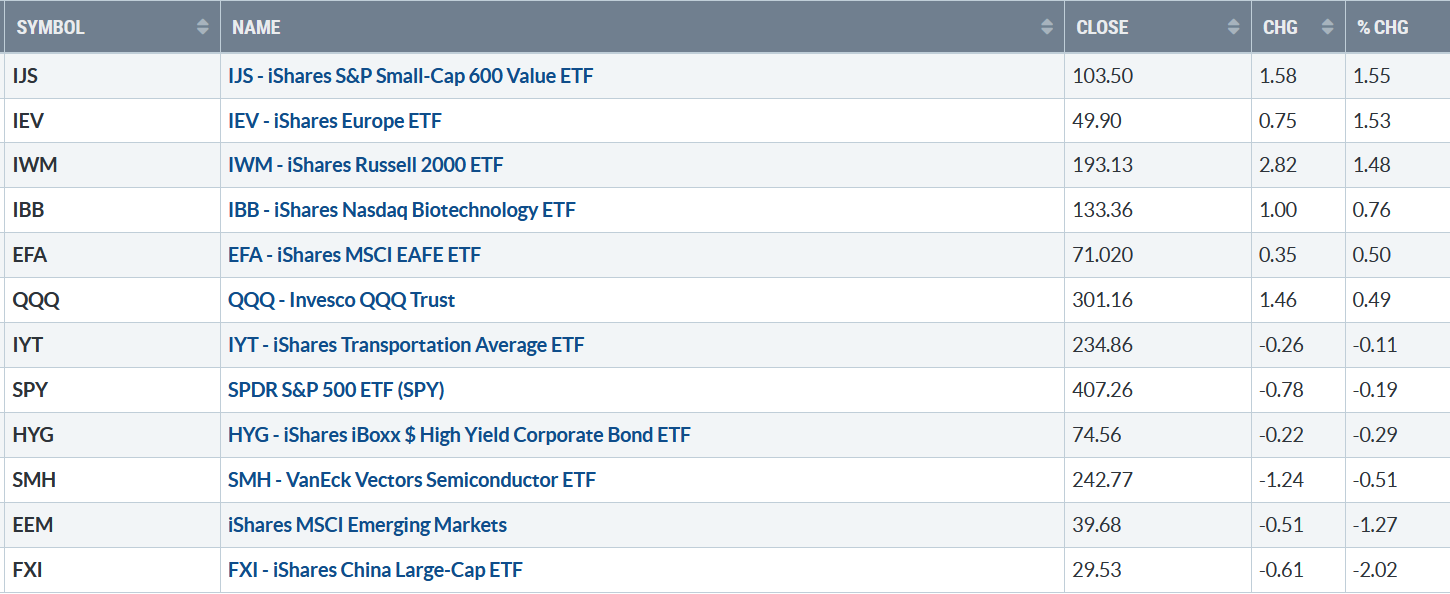
Figure 2: Bonnie’s ETFs Watch List Performance 2/10/23 – 2/17/23
021723 Week ETFs
Source: Stockcharts.com
Small Cap Value and Growth were leaders. Hi Yield Bonds continued lower, and Emerging Markets and China remained weak as investors shied away from high risk and were somewhat cautious.
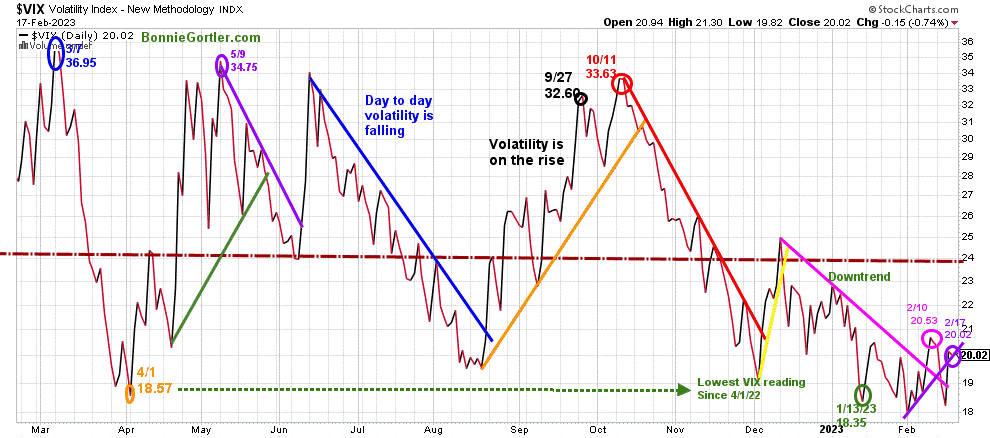
Figure 3: CBOE Volatility Index VIX
 Source: Stockcharts.com
The CBOE Volatility Index (VIX), a measure of fear, traded above 20.00 for most of 2022, with a high at 36.95 on 3/7 (blue circle) and a low on 4/1/22 at 18.57.
A new VIX low didn’t occur until 1/13/23 at 18.35 (green circle) after VIX quieted in early December 2022.
Last week, VIX fell to 20.02 (purple circle) in volatile intraday trading.
If VIX rises and closes above 24.00, look for the pullback to turn into a potential significant correction. However, if VIX remains below 24.00, another rally will likely begin soon.
The major averages for the week were lower. Dow was down -0.13%, S&P 500 was down -0.28 %, and the Nasdaq rose +0.49%. The Russell 2000 Index gained +1.44%, the strongest of the averages, a positive sign.
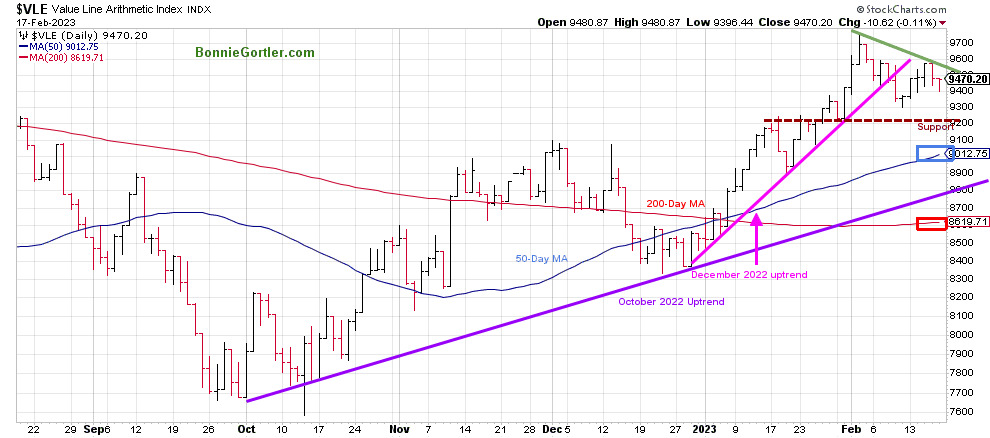
Figure 4: Value Line Arithmetic Average
021723 Value Line Arithmetic Average
Source: Stockcharts.com
The Value Line Arithmetic Index ($VLE) (a mix of approximately 1700 stocks) rose +1.11% after breaking the December 2022 uptrend. Key support is at 9200, resistance is at 9600, with VLE above the 50 and 200-Day Moving Average, a sign of underlying strength.
Weekly market breadth was positive on the New York Stock Exchange Index (NYSE) and for Nasdaq, an improvement from the previous week. The NYSE had 1659 advances and 1593 declines, with 240 new highs and 32 new lows. There were 2794 advances and 2294 declines on the Nasdaq, with 299 new highs and 199 new lows.
There were more new highs than lows every day last week on the NYSE and Nasdaq, which is more bullish than bearish.
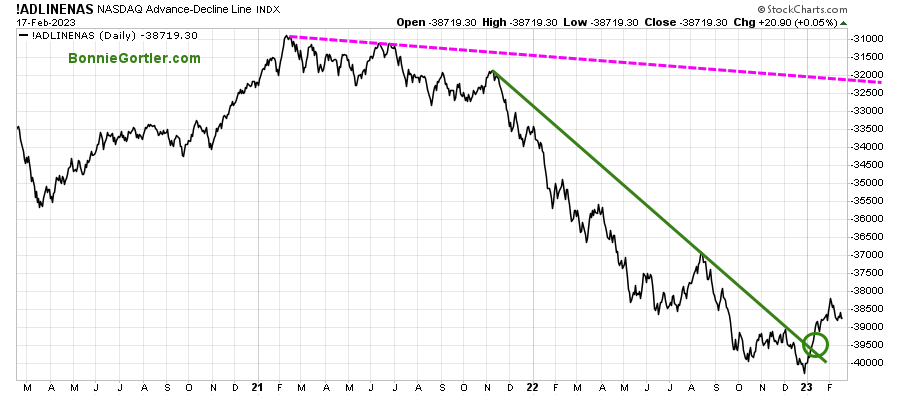
Figure 5: Nasdaq Advance Decline Line Daily
021023 Daily Nasdaq Cumulative Advance-Decline Line
Source: Stockcharts.com
The Nasdaq daily advance-decline line is a technical indicator that plots the difference between the number of advancing and declining stocks daily. In January, the October 2022 downtrend was broken (green line). Watch the market breadth for successive days of more advances than declines this week to give a clue for the short-term direction of the Nasdaq.
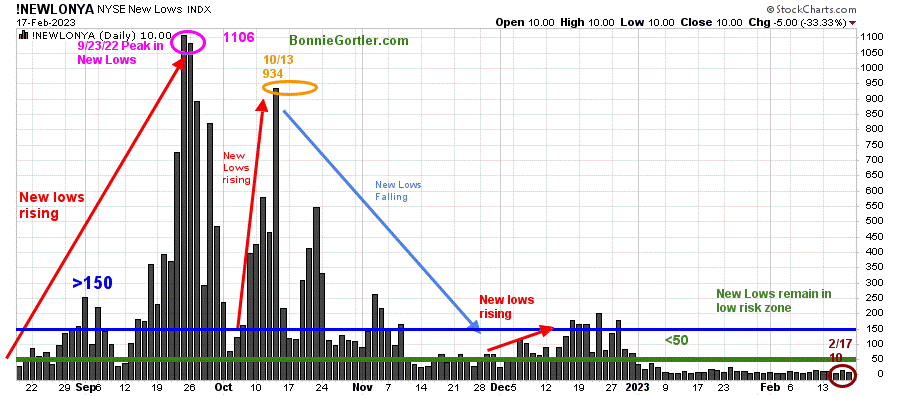
Figure 6: Daily New York Stock Exchange (NYSE) New Lows
021723 NYSE New Lows Daily
Source: Stockcharts.com
Watching New Lows on the New York Stock Exchange is a simple technical tool that helps awareness of the immediate trend’s direction.
New lows warned of a potential sharp pullback, high volatility, and “panic selling” for most of 2022, closing above 150. The peak reading was 9/23/22 when New Lows made a new high of 11/06 (pink circle).
New Lows fell last week, closing on 2/17 at 10 (brown circle), remaining below 25, in the lowest risk zone and short-term positive for the market.
On the other hand, a rise above 150 and an expansion of New Lows would be a warning of weakness forthcoming.
Learn more about the significance of New Lows in my book, Journey to Wealth, published on Amazon. If you would like a preview, get a free chapter here.
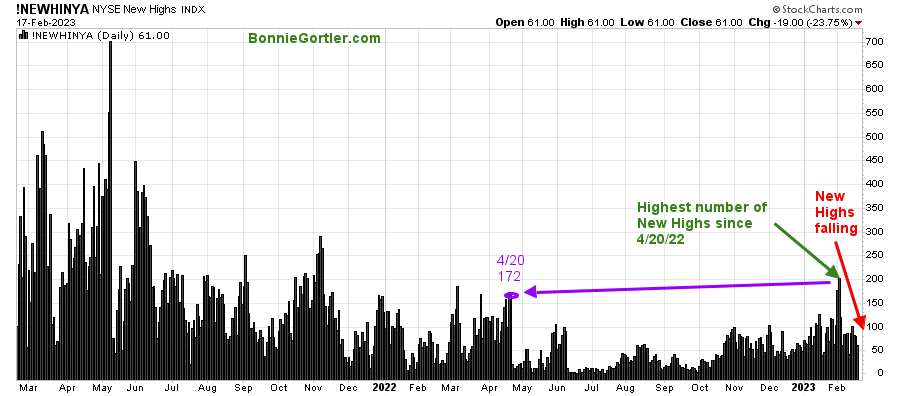
Figure 7: Daily New York Stock Exchange (NYSE) New Highs
21723 NYSE New Highs Daily
Source: Stockcharts.com
New Highs on the NYSE since February 2, 2023, are no longer expanding after reaching the highest number of New highs since 4/20/22. It will be positive in the near term if New Highs begin to expand. However, if New Highs continue to contract, it would be a warning of potentially a more serious decline ahead.
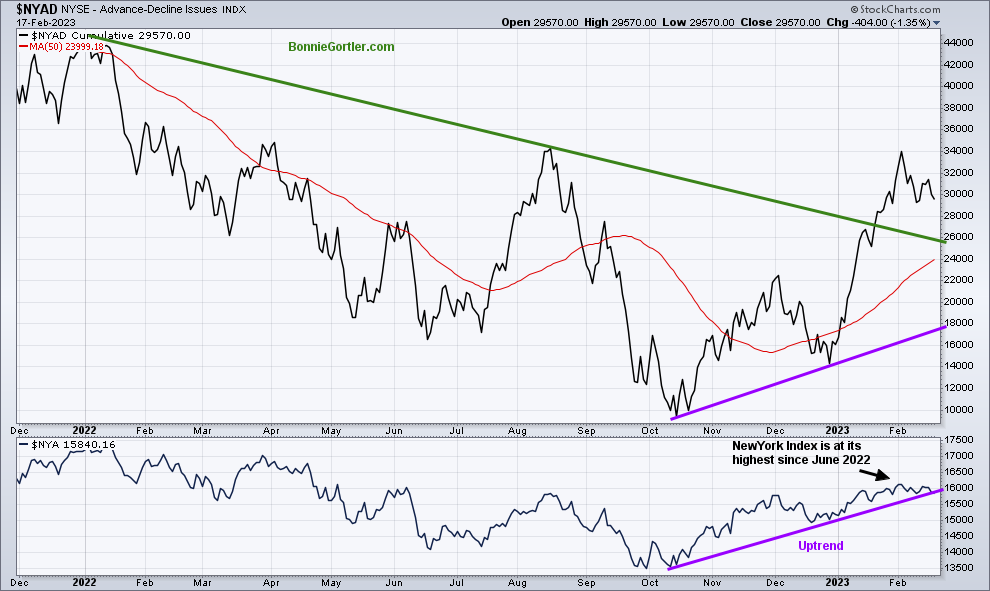
Figure 8: Daily New York Stock Exchange (NYSE) Cumulative Advance-Decline Line (Top) and NYSE (Bottom)
021723 Daily NYSE Cumulative Advance-Decline Line
Source: Stockcharts.com
The above chart is the cumulative Advance-Decline Line (AD Line) of the NYSE, a breadth indicator based on the number of advancing stocks minus the number of declining stocks. It’s positive the 2022 downtrend has been broken (green line top chart), with the AD-Line making a higher high, confirming the NYSE’s high.
The AD line and NYSE have turned down, and it bears watching. It remains positive that the October uptrends purple lines) for both remain in effect. Continued weakness would be a warning of lower prices in the short term, but a turn-up in the AD-Line, The New York Index making a new high with new highs expanding, would be bullish.
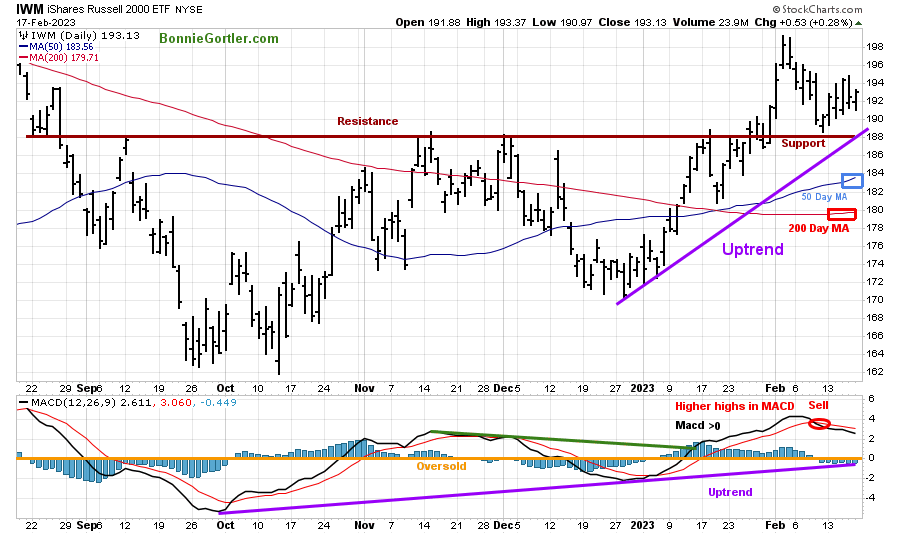
Figure 9: Daily iShares Russell 2000 (IWM) Price (Top) and 12-26-9 MACD Bottom)
021723 IWM Daily
Source: Stockcharts.com
The top chart is the daily iShares Russell 2000 Index ETF (IWM), the benchmark for small-cap stocks, with a 50-Day Moving Average (MA) (blue line) and 200-Day Moving Average (MA) (red line) that traders watch and use to define trends.
IWM closed at 193.13, up +1.48%, stronger than the S&P 500 and remaining above its 200-Day MA (red rectangle) and 50-Day MA (blue rectangle).
MACD remains on a sell, above 0 (orange line), but remains in an uptrend for 2023 after making a higher high, a sign of underlying strength.
Support remains at 187.50 and 182.50, and 180.00. Resistance is at 195.00, 199.00, and 205.00.
With the daily IWM December uptrend in effect, confirmed by a higher high in MACD, and the intermediate trend favorable (chart not shown), despite the sell, the odds favor IWM challenging the February highs from earlier this month.
Learn about coaching with Bonnie. Ask questions. Discover more about the coaching processes in this 15-minute call by emailing me at Bonnie@BonnieGortler.com. I would love to schedule a call and connect with you.
Figure 10: Daily Invesco QQQ Trust (QQQ) Price (Top) and 12-26-9 MACD (Bottom)

021723 QQQ Daily
Source: Stockcharts.com
The chart shows the daily Invesco QQQ, an exchange-traded fund based on the Nasdaq 100 Index. QQQ made a low in October 2022 (red circle), followed by a successful retest of the low in early January 2023, then broke the downtrend (purple line) and hit a new six-month high in February.
QQQ broke the 2023 uptrend (pink line) last week on increased volatility but finished higher, up +0.49%, closing at 301.16. QQQ closed above the 50-Day Moving Average and the 200-Day Moving Average (red rectangle), a sign of underlying strength.
QQQ support remains at 295.00, 291.00, and 287.00; the old resistance area (brown dotted line) is acting as support. Resistance is at 305.00, 310.00, and 314.00.
The bottom chart is MACD (12, 26, 9) on a sell and falling. With the strength of the rise in QQQ in 2023, MACD at the highest reading since August, and the intermediate trend favorable (chart not shown), the odds favor the first sell to be premature and higher prices to follow.
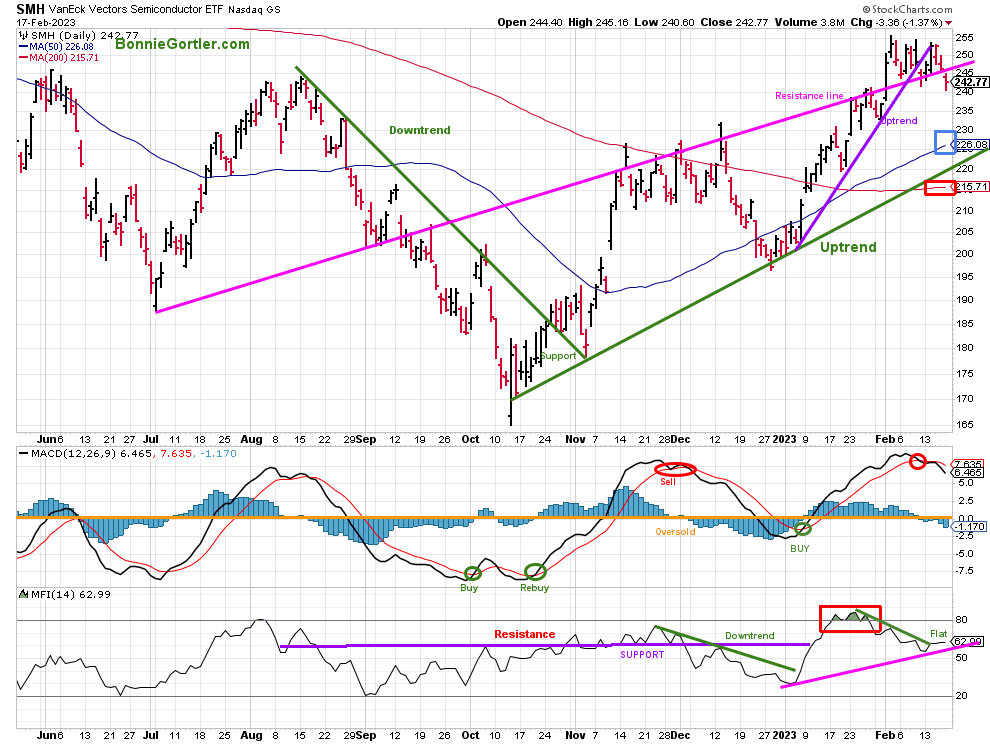
Figure 11: Daily Van Eck Vectors Semiconductor (SMH) Top, 12-26-9 MACD (Middle) and Money Flow (Bottom)
021723 SMH Daily
Source: Stockcharts.com
The top part of the chart shows the Van Eck Vectors Semiconductor (SMH) concentrated, mainly in US-based Mega-Cap Semiconductors companies. SMH is a lead indicator for the market when investors are willing to take on increased risk and the opposite when the market is falling.
Semiconductors (SMH) fell only -0.51% last week, closing at 242.77, a leading sector, in 2023. SMH broke its steep 2023 uptrend (purple line) but has been in the longer-term uptrend since October (green line) and above its 50 and 200-Day Moving averages (blue and red rectangle).
SMH support remains at 240.00, 235.00, 226.00, and 220.00. Resistance is at 245.00, 250.00, and 255.00.
MACD (middle chart) remains on a sell, showing weakening momentum after its huge gains.
Money Flow (bottom chart) peaked (red rectangle) and turned down from an overbought level, trending down, and flattened within an uptrend.
With the intermediate uptrend in SMH remaining intact, the MACD sell signal may be premature. Watch if SMH shows leadership or is weak next week for a clue of the market direction. Time will tell.
The SMH intermediate trend remains up on rising momentum.
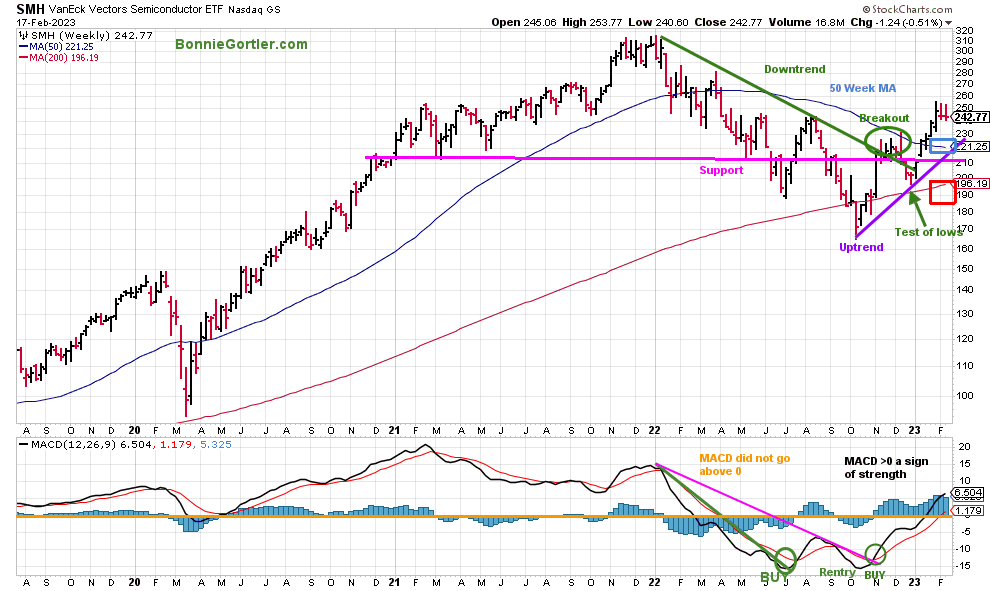
Figure 12: Weekly Van Eck Vectors Semiconductor (SMH) Top, 12-26-9 MACD (Bottom)
021723 SMH Weekly
Source: Stockcharts.com
The top chart is the Weekly Semiconductors (SMH) ETF, which broke its downtrend in October 2022 and retraced the breakout in late December, testing the low with a pattern of higher lows and higher highs.
Its bullish SMH remains in the longer-term uptrend since October (purple line) and above its 50 and 200 Week Moving averages (blue and red rectangle), showing underlying strength.
MACD, the lower chart remains on a buy, rising, and above 0, a sign of positive momentum and strength in Semiconductors.
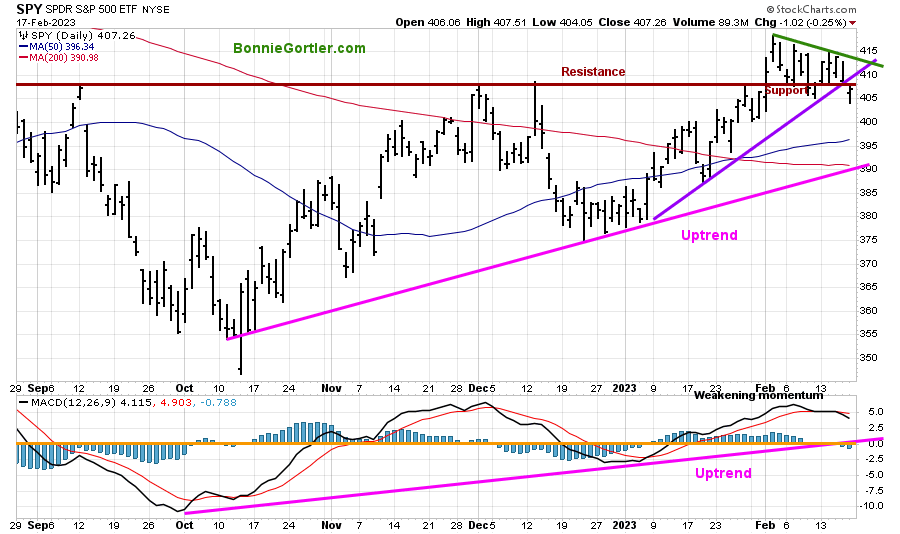
Figure 13: The S&P 500 Index (SPY) Daily (Top) and 12-26-9 MACD (Bottom)
021723 SPY Daily
Source: Stockcharts.com
The S&P 500 (SPY) made a six-month high in early February and closed at 407.26, down -0.19% for the week, below the uptrend (purple line) and support (brown line), but the uptrend from October 2022 remains intact.
SPY closed above the 50-and 200-Day Moving Average (blue and red rectangle), showing underlying strength.
MACD (lower chart) shows weakening momentum but no negative divergence, with the uptrend intact.
Support is at 400.00, 396.00, and 390.00.
Resistance 410.00 followed by 415.00. A close above 415.00 would break the February downtrend (green line), and likely trip buy stops fueling the market higher.
I do not recommend getting too bearish and going short with the intermediate trend favorable and other indicators that I follow not implying the latest weakness more leading to a serious decline at this time.
Figure 14: The S&P 500 Index (SPY) Weekly (Top) and 12-26-9 MACD (Bottom)
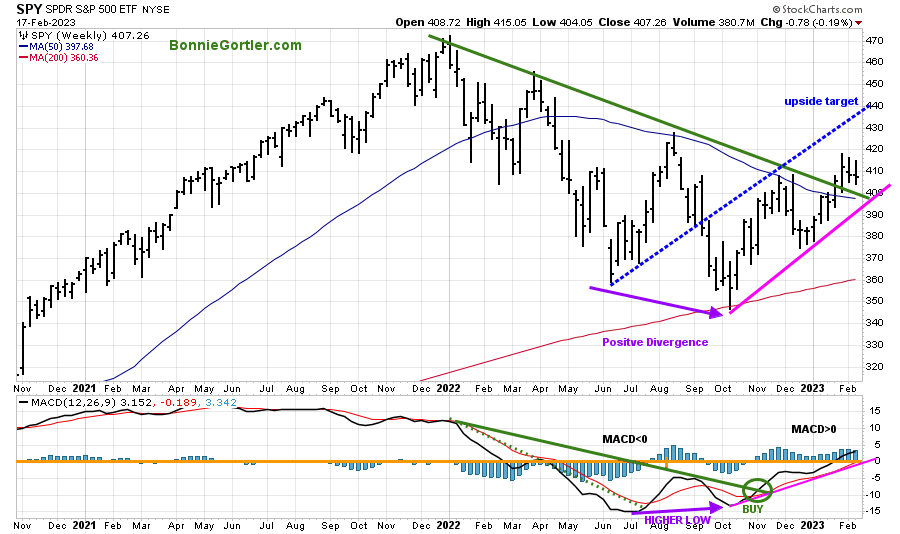
021723 SPY Weekly
Source: Stockcharts.com
The top chart shows the weekly S&P 500 Index (SPY) breaking the weekly downtrend (green line), shifting the intermediate trend to up.
MACD (lower chart) remains on a buy (green circle), broke the 2022 downtrend in November 2021, and continues to rise, reaching 0, implying a sign of strength.
SPY has an upside target of 440.00 (blue dotted line) and potentially higher if support at 400.00 holds.
Learn more about charting in my free Masterclass, Charting Strategies to Cut Risk and Trade with the Trend. Sign up here.
Figure 15: U.S. Dollar Daily
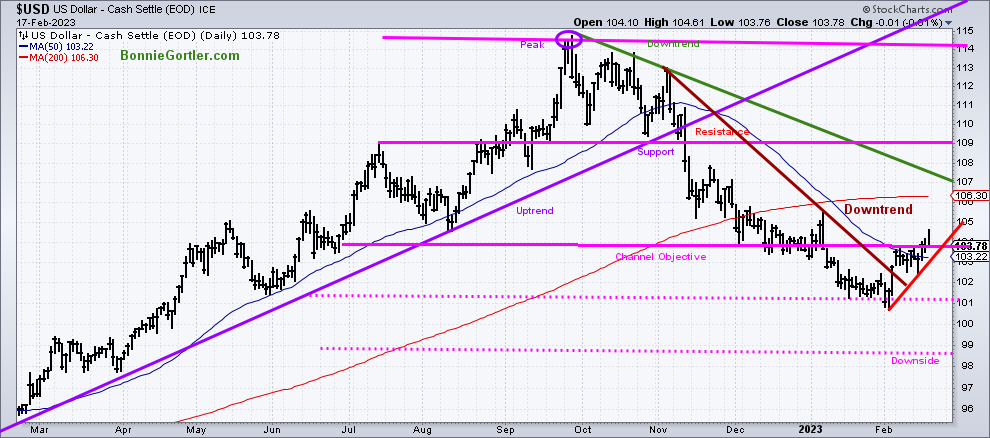
021723 DXY Daily
Source: Stockcharts.com
The U.S. dollar (USD) peaked in September 2022 and trended lower into early 2023, making a low in February.
USD closed up +0.24% for the week, its highest level since January 2023, but Friday, 02/17/23, USD reversed after an intraday high of 104.17, closing near its low at 103.79.
USD remains above the November daily downtrend (brown line) but below the September 2022 downtrend (green line). The downside objective remains at 98.80 (lower pink dotted line), but a close above 104.00 would negate the downside objective.
If the dollar rises and gains strength, look for more selling pressure in international and U.S. markets. On the other hand, if the dollar weakens, international and U.S. equities are likely to firm and work their way higher.
Summing Up:
Investors were cautious last week as bond yields rose. Market breadth is not as strong as at the start of the year but remains favorable. February, a weak month historically, is off to a rocky start, but the weakness appears to be only a short-term pullback, not the beginning of a significant correction. Momentum indicators on daily charts have weakened in the Nasdaq, Semiconductors, S&P 500, and Russell 2000, but they remain favorable for the intermediate uptrend and are entitled to test the February highs. Continue to give the bulls the benefit of the doubt until proven otherwise.
Remember to manage your risk, and your wealth will grow.
Let’s talk investing. You are invited to set up your Free 30-minute Wealth and Well-Being Strategy session by clicking here or emailing me at Bonnie@BonnieGortler.com. I would love to schedule a call and connect with you.
Disclaimer: Although the information is made with a sincere effort for accuracy, it is not guaranteed that the information provided is a statement of fact. Nor can we guarantee the results of following any of the recommendations made herein. Readers are encouraged to meet with their own advisors to consider the suitability of investments for their own particular situations and for determination of their own risk levels. Past performance does not guarantee any future results.


Create more wealth in your life
with these simple strategies.
As an added bonus you will also
receive BG’s Updates and Ezine

Discover how to quickly create more well-being in your life with these simple strategies.
As an added bonus you will also
receive BG’s Updates and Ezine

As an added bonus you will receive BG’s Updates and Ezine

All work listed on BonnieGortler.com is licensed under a Creative Commons Attribution - Noncommercial - No Derivative Works 3.0 Unported License.


Free Report:
Grow and Sustain Your Wealth
Discover how to grow your money with these easy, simple steps.

