

10 Simple Tips for Financial Well-Being
07/01/2026
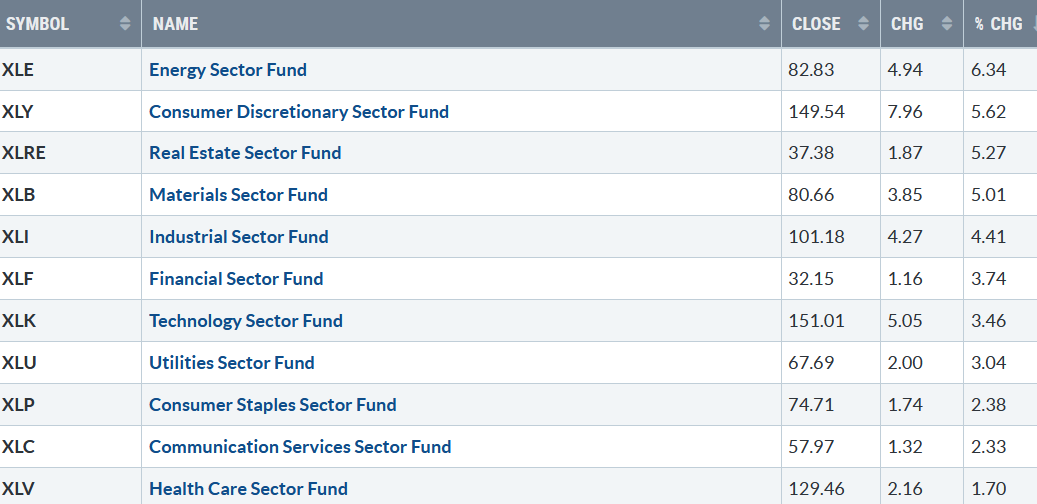
The end of the quarter closed strong, with all eleven S&P SPDR sectors positive last week. Energy (XLE) and Consumer Discretionary (XLY) were the leading sectors (XLY), while Communication Services (XLC) and Healthcare showed gains but were the weakest, with the SPDR S&P 500 ETF Trust (SPY) up +3.45%.
S&P SPDR Sector ETFs Performance Summary 3/24/23-03/31/23
033123 SPDR Sectors
Source: Stockcharts.com
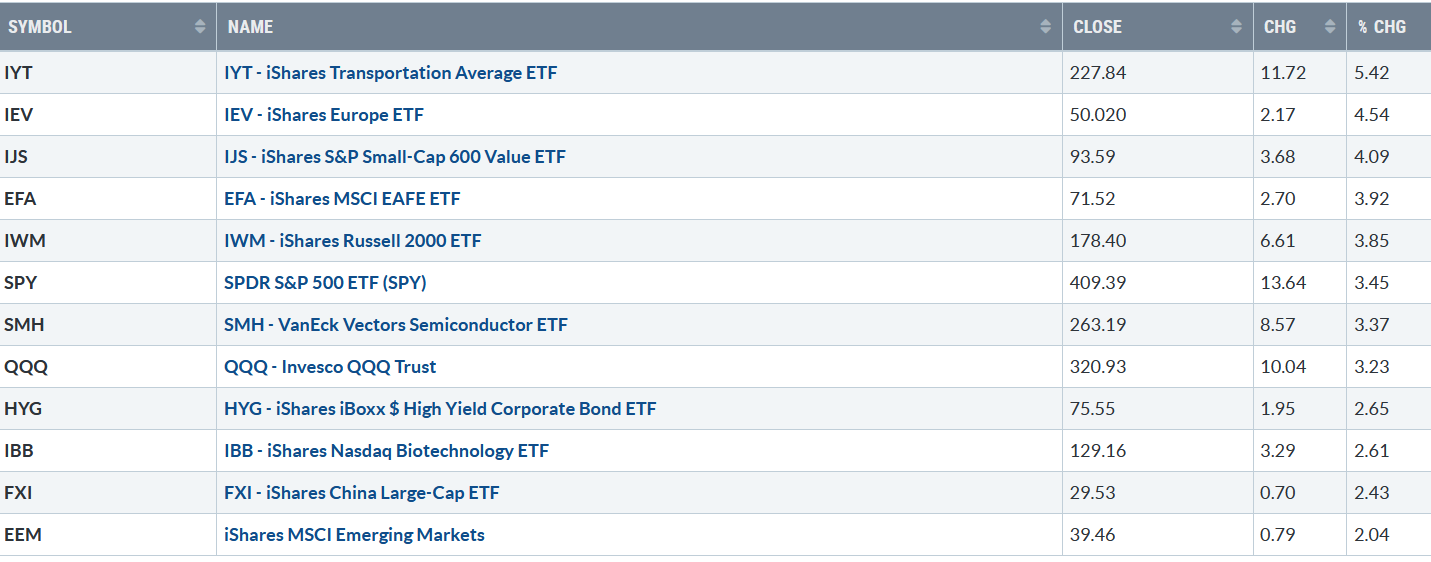
Figure 2: Bonnie’s ETFs Watch List Performance 3/24/23-03/31/23
033123 Week ETFs
Source: Stockcharts.com
Transports, Europe, and Small Caps led the way in a broad rally, with Financial stocks stabilizing as bad news quieted, and investors felt safer and bargain-hunting before the end of the quarter.
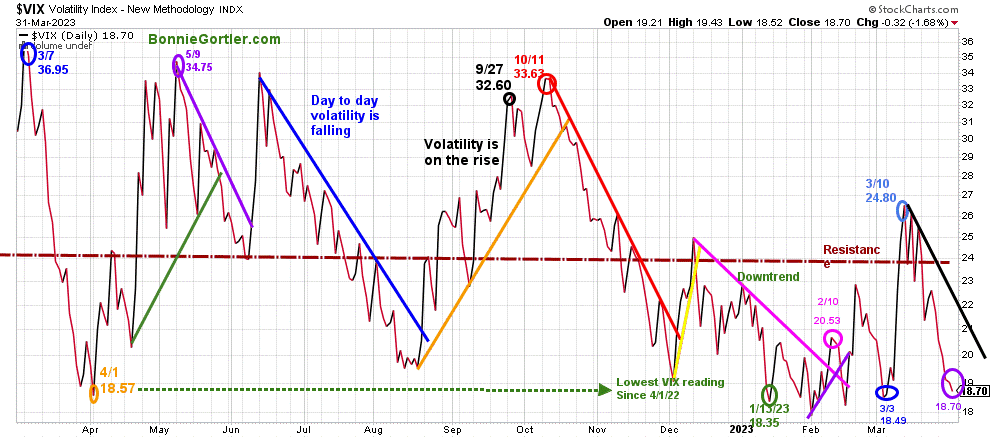
Figure 3: CBOE Volatility Index VIX
033123 VIX Daily
Source: Stockcharts.com
The CBOE Volatility Index (VIX), a measure of fear, traded above 20.00 for most of 2022, with a high at 36.95 on 3/7 (blue circle) and a low on 4/1/22 at 18.57. A new VIX low didn’t occur until 1/13/23 at 18.35 (green circle).
VIX continued to fall last week as the market averages strengthened, closing at 18.70 (purple circle), near the March and January lows for the year.
VIX is likely to move lower if the rally continues, but VIX will increase when a pullback occurs.
If VIX closes above 24.00, look for increasing day-to-day volatility and a more severe pullback.
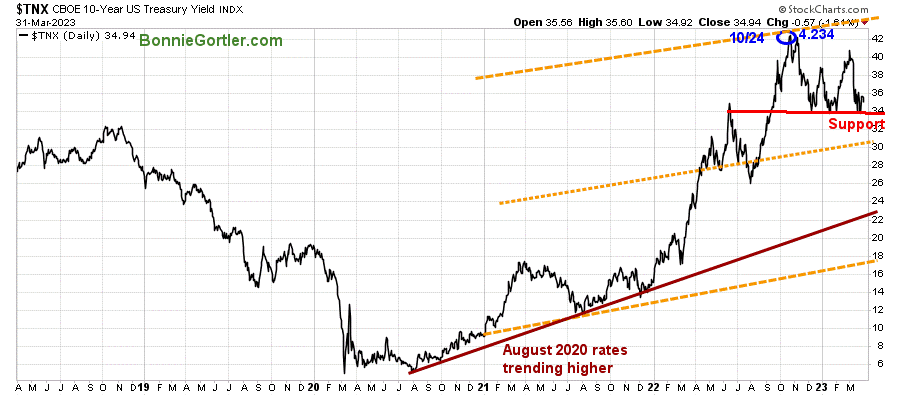
Figure 4: UST 10YR Bond Yields Daily
033123 UST 10 Yr Bond Yields Daily
Source: Stockcharts.com
The 10-Year U.S. Treasury yields rose last week, closing at 3.494%. Support is 3.40% and 3.00%, with resistance between 4.25% and 4.40%.
March ended with a bang, with all three major market averages higher. The Dow gained +3.22%, its best week since last November. The S&P 500 was up +3.48%, and the Nasdaq gained +3.37% for its fifth positive week in the last six. The Russell 2000 Index showed a gain of +3.89% after falling sharply over the past few weeks.
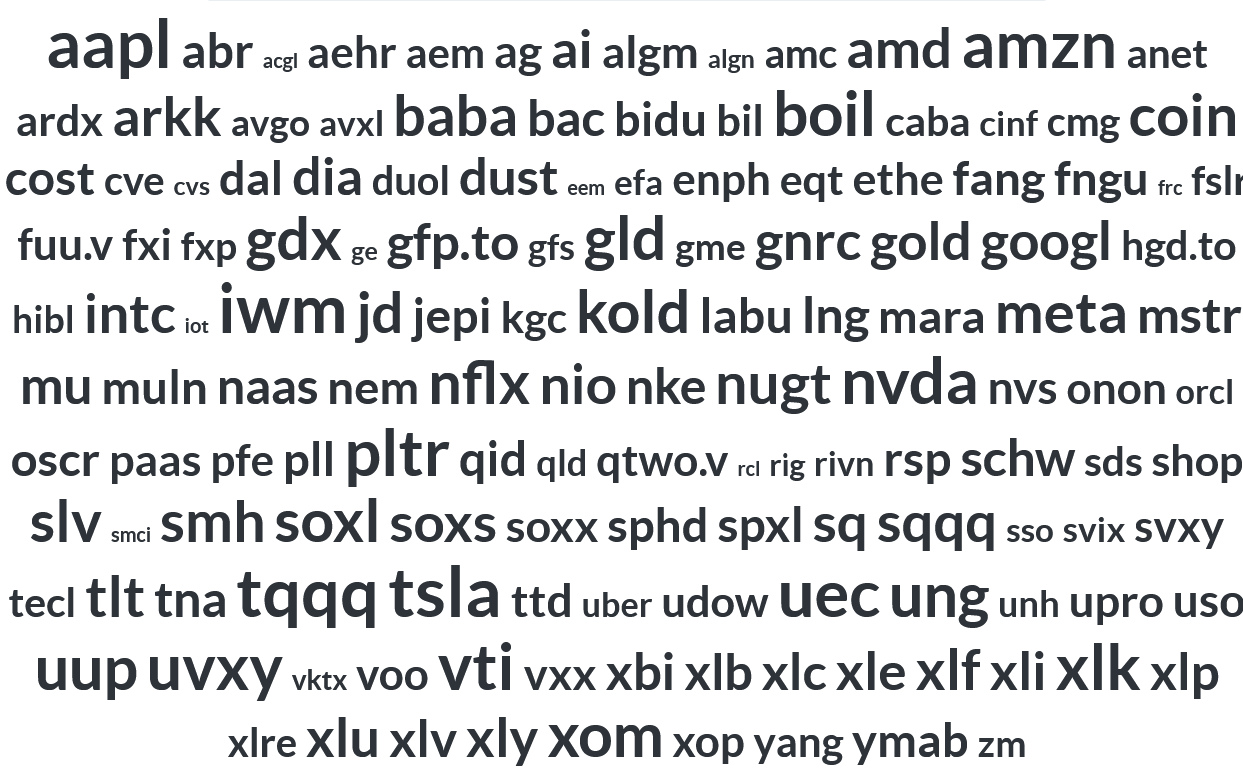
Figure 5: Popular Symbols of Stocks and ETFs
033123 Most Popular Symbols
Source: Stockcharts.com
At the end of the quarter, investors were highly interested in stocks, including technology, gold, and oil.
033123 VLE Daily
Source: Stockcharts.com
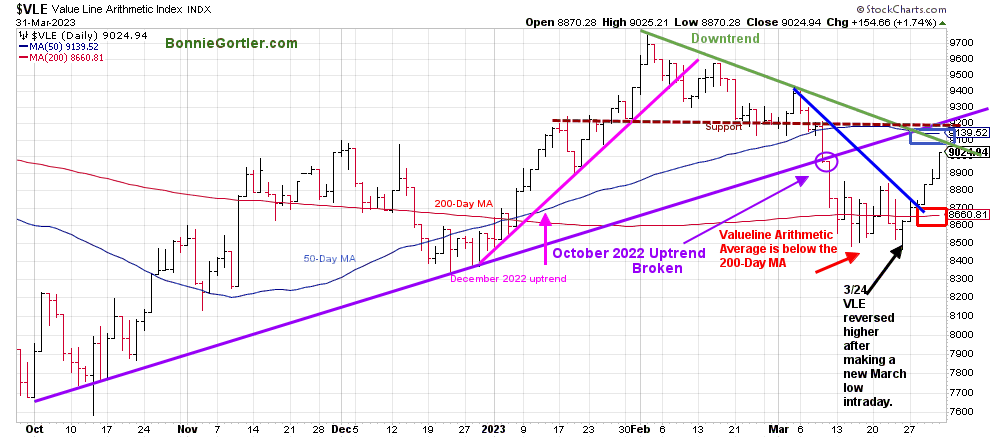
The Value Line Arithmetic Index ($VLE) is a mix of approximately 1700 stocks. VLE broke the October 2022 uptrend in early March, headed lower, and on 3/24, reversed higher.
A strong rally occurred last week, with the VLE gaining +4.63%. There was confirmation when VLE closed above the 200-Day MA (8551.96 as of 03/24/23) and broke the March downtrend (blue line), implying the worst part of the decline was over and the start of a short-term rally (as per the 3/24/23 Market Update).
Key resistance is at 9200, slightly above the 50-Day MA (blue rectangle), and support is at 8700.
It would be negative and potentially the start of a major decline if the Value Line Index stalls below the 50-Day Average and reverses to close below the 3/24 low at 8466.
Learn about coaching with Bonnie. Ask questions. Discover more about the coaching processes in this 15-minute call by signing up here or emailing me at Bonnie@BonnieGortler.com. I would love to schedule a call and connect with you.
An Improvement in Market Internals
Weekly market breadth was positive on the New York Stock Exchange Index (NYSE) and for Nasdaq. The NYSE had 2792 advances and 411 declines, with 123 new highs and 103 new lows. There were 3360 advances and 1655 declines on the Nasdaq, with 234 new highs and 442 new lows.
For a broad advance to follow, there needs to be an expansion in the weekly number of New Highs and New Lows to contract.
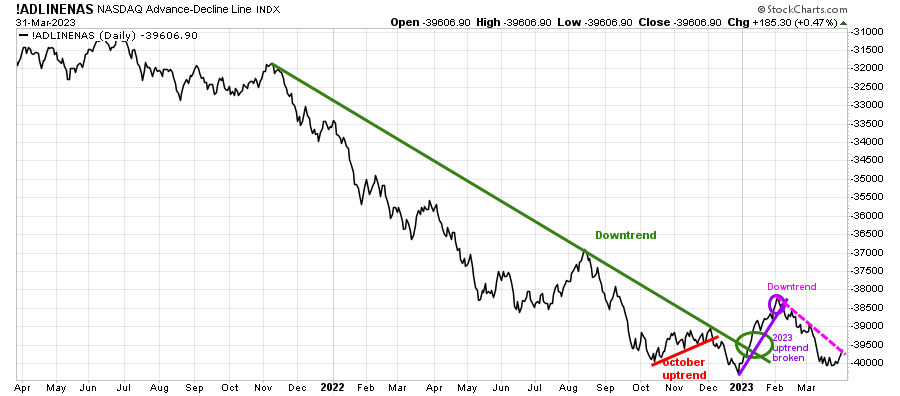
Figure 7: Nasdaq Advance Decline Line Daily
033123 Daily Nasdaq Cumulative Advance-Decline Line
Source: Stockcharts.com
The chart is the Nasdaq Daily Advance-Decline Line, a technical indicator that plots the difference between the number of advancing and declining stocks.
In January, the October 2022 downtrend was broken (green line) but was short-lived, followed by the short-term uptrend (purple line), giving way as market breadth deteriorated in February 2023.
There was an improvement in breadth last week, but the downtrend remains in effect (pink dotted line).
Watch the market breadth this week. It would be positive in the near term if the downtrend breaks and there is an expansion of net advances than declines, more new highs, and fewer new lows.
On the other hand, if there are more declines than advances and an increase in new lows and fewer new highs, it would be negative.
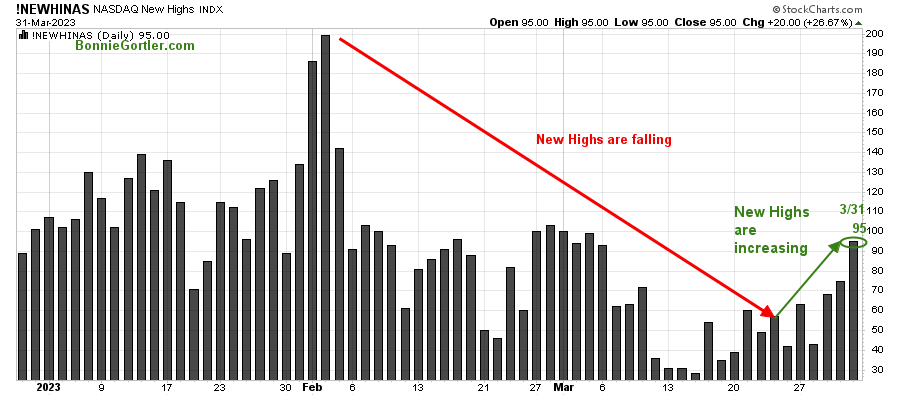
Figure 8: Nasdaq New Highs
033123 Nasdaq New Highs Daily
Source: Stockcharts.com
The Nasdaq Index rose +3.37% and is up 16.77% in 2023. It concerned me that the number of stocks making new highs had been falling since February and was not expanding, but last week was an improvement, with New Highs increasing as Nasdaq rallied.
If New Highs continues to expand and get above 200, that would be a sign that the latest rally was more than money managers and institutional buying for end-of-the-quarter window dressing. If New Highs don’t expand and begin to fall, a pullback in Nasdaq is likely.
Figure 9: Nasdaq New Lows
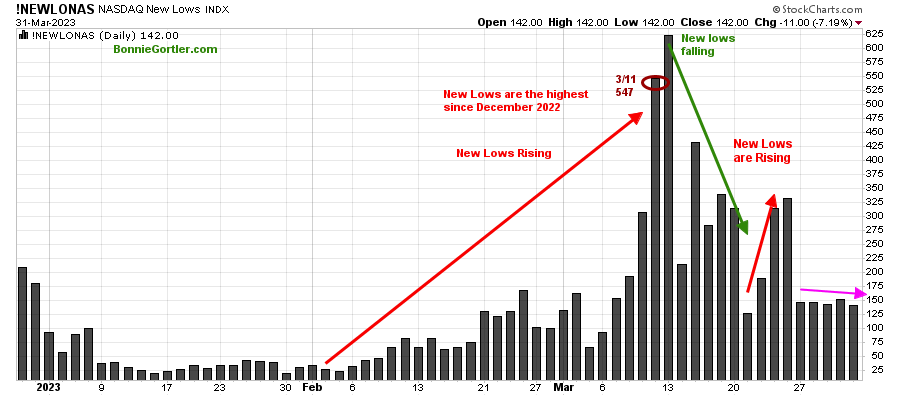
033123 Nasdaq New Lows Daily
Source: Stockcharts.com
Nasdaq New Lows are less (pink line) but still too high, higher than in early 2023. If New Lows don’t contract, it would be negative for the short term and increase the odds for a pullback.
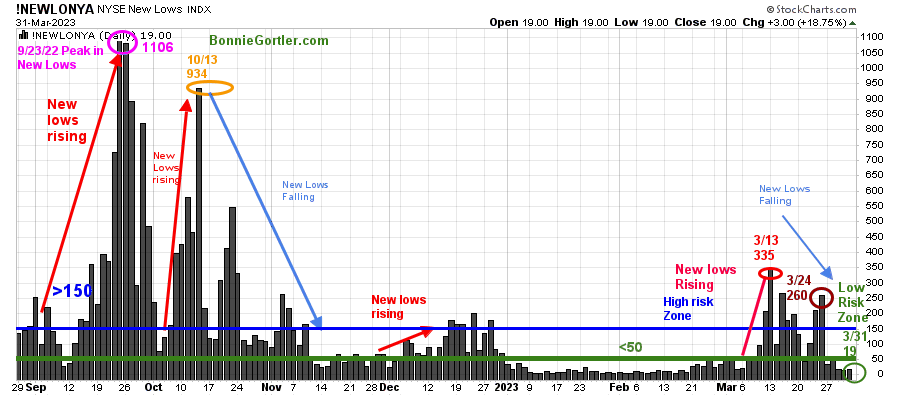
Figure 10: Daily New York Stock Exchange (NYSE) New Lows
033123 Daily NYSE New Lows
Source: Stockcharts.com
Watching New Lows on the New York Stock Exchange is a simple technical tool that helps awareness of the immediate trend’s direction.
New lows warned of a potential sharp pullback, high volatility, and “panic selling” for most of 2022, closing above 150. The peak reading was 9/23/22 when New Lows made a new high of 1106 (pink circle), and New Lows expanded to their highest level in 2023 on 3/13 (red circle) to 335, well under the peak for now.
Last week market breadth on the NYSE improved. New Lows fell from the high-risk zone, above 150 (blue horizontal line), closing last week to 19 on 3/31 (green circle), shifting to the lowest risk zone below 25. Keep an eye on the New Lows if they remain below 25.
A rise above 150, an expansion of New Lows would be a warning of weakness forthcoming.
Learn more about the significance of New Lows in my book, Journey to Wealth, published on Amazon. If you would like a preview, get a free chapter here.
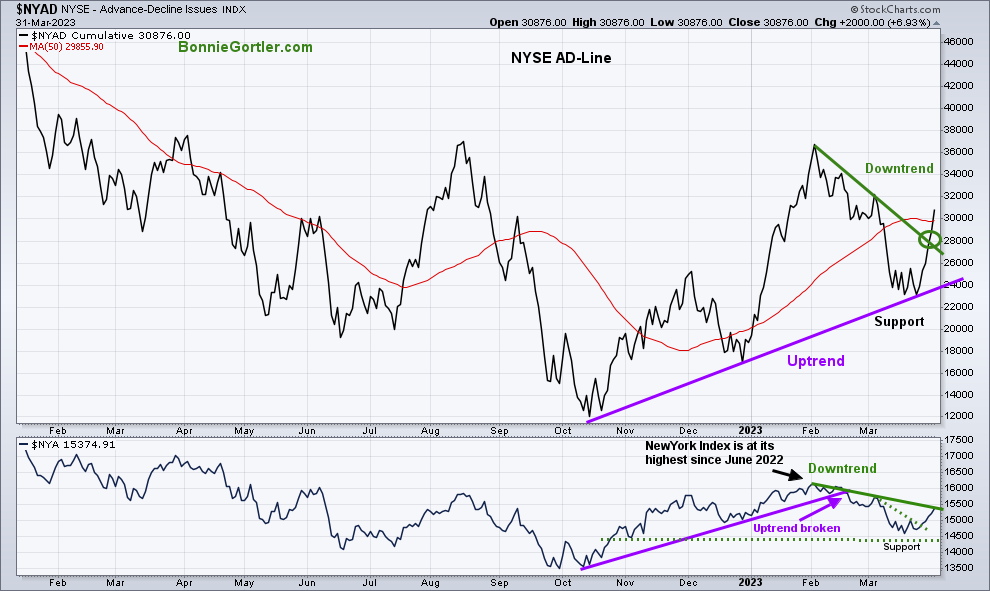
Figure 11: Daily New York Stock Exchange (NYSE) Cumulative Advance-Decline Line (Top) and NYSE (Bottom)
033123 Daily NYSE Cumulative Advance-Decline Line
Source: Stockcharts.com
The top chart is the Cumulative Advance-Decline Line (AD Line) of the NYSE, a breadth indicator based on the number of advancing stocks minus the number of declining stocks. The AD Line peaked in February 2023 (green top chart), confirming the February NYSE’s high (lower chart).
Market breadth improved last week. Friday’s market breadth on the NYSE showed 2510 Advancing stocks and only 308 declining stocks, the best breadth reading in two months.
It’s positive the AD line downtrend (green line top chart) was broken last week, but the NYSE (bottom chart) did not violate the downtrend.
For the latest rally to be sustainable, I want the NYSE (green line lower chart) to break the downtrend and then make a new high, confirmed by the AD Line continuing to rise and making a higher high than the February high.
On the other hand, a break of the uptrend (purple) (top chart) would imply a potential test of the October lows.
Learn more about charting in my Free Masterclass, Charting Strategies to Cut Risk and Trade with the Trend. Sign up here
Small Caps downtrend remains
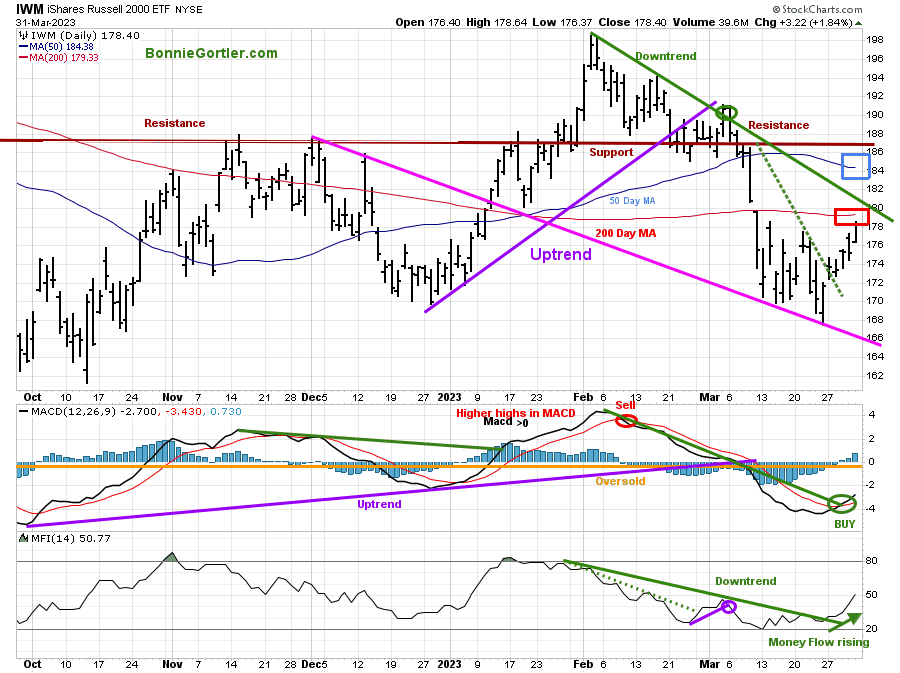
Figure 12: Daily iShares Russell 2000 (IWM) Price (Top) and 12-26-9 MACD (Middle) and Money Flow (Bottom)
033123 IWM Daily
Source: Stockcharts.com
The top chart is the daily iShares Russell 2000 Index ETF (IWM), the benchmark for small-cap stocks, with a 50-Day Moving Average (MA) (blue line) and 200-Day Moving Average (MA) (red line) that traders watch and use to define trends.
Day to Day volatility in IWM was less last week, with the highest sector in Financials, including the Regional Banks stabilizing. IWM gained +3.85%, closing at 178.40. It was a positive sign a relief rally would occur when IWM held above support at 170.00 and broke the March downtrend (green dotted line).
IWM remains in a downtrend from February (solid green line) and below the 50-Day MA (blue rectangle) and 200-Day MA (red rectangle), implying underlying weakness.
Resistance is at 180.00, 184.00, and 188.00, where IWM broke down in March. Support is at 174.00 and 166.00.
MACD generated a buy, rising from an oversold condition, below 0, after turning up from the most oversold level since October 2022.
The Money Flow Index (MFI) in the lower chart broke the downtrend trend (green line), and MFI is rising as investors went bargain hunting in small caps.
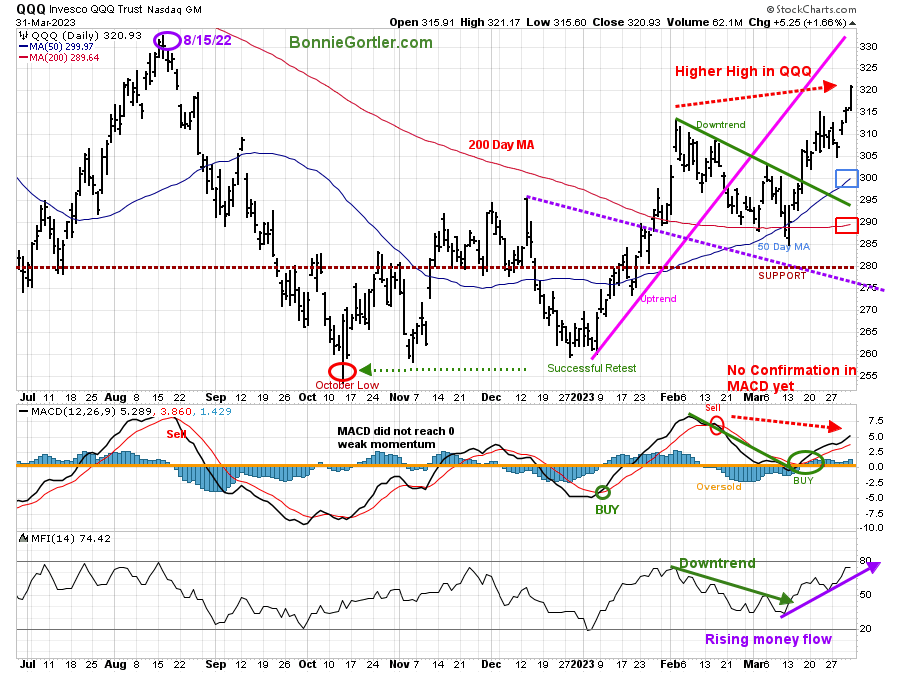
Figure 13: Daily Invesco QQQ Trust (QQQ) Price (Top) and 12-26-9 MACD (Middle) and Money Flow (Bottom)
033123 QQQ Daily
Source: Stockcharts.com
The chart shows the daily Invesco QQQ, an exchange-traded fund based on the Nasdaq 100 Index. QQQ made a low in October 2022 (red circle), followed by a successful retest of the low in early January 2023, then broke the uptrend (pink line) after reaching a new six-month high in February.
QQQ rose +3.23% last week, its best quarterly gain since 2020, breaking above resistance at 314.00, closing at 320.93, above the 50-Day Moving Average and the 200-Day Moving Average (red rectangle).
Resistance is at 330.00, the old high made in August 2022. Support is at 314.00, 310.00, 300.00, and 290.00.
The middle chart is MACD (12, 26, 9), a measure of momentum remains on its buy, confirmed by breaking the February downside trendline. Be alert to the potential negative divergence (higher high in price and lower high in MACD) if QQQ weakens and MACD goes on a sell.
The Money Flow Index (MFI) in the lower chart confirmed the breakout in QQQ in an uptrend but extended.
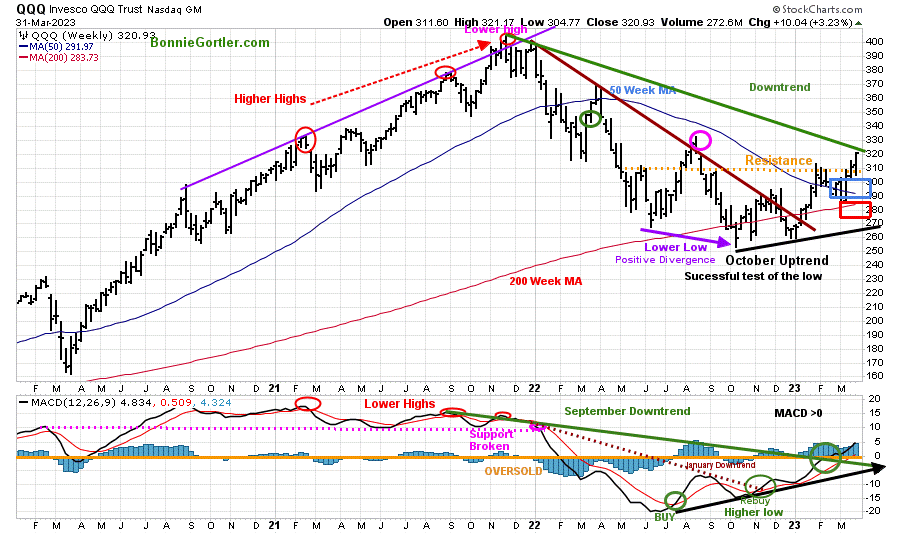
Figure 14: Weekly Invesco QQQ Trust (QQQ) Price (Top) and 12-26-9 MACD (Bottom)
Source: Stockcharts.com
The intermediate trend remains up and is close to penetrating the 2022 price downtrend (green line top chart) above the August highs (pink circle).
QQQ remains above the old resistance at 310.00, now acting as support.
It’s positive QQQ closed above the 50 Week and 200 Week MA.
MACD remains above 0, rising after breaking the September momentum downtrend.
The bulls remain in control for now.
The SMH intermediate trend remains up
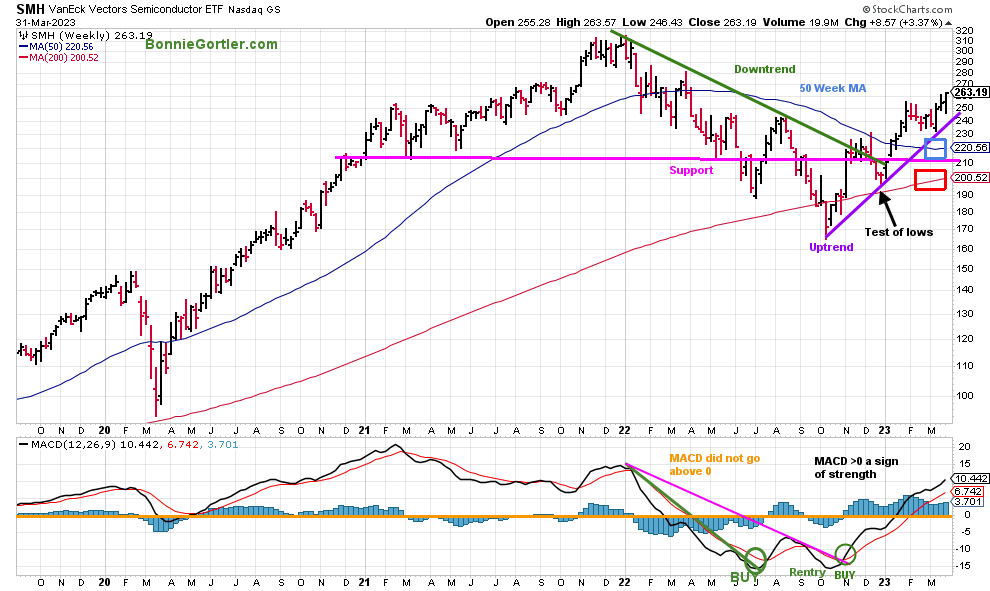
Figure 15: Weekly Vaneck Vectors Semiconductors (SMH) Price (Top) and 12-26-9 MACD (Bottom)
033123 SMH Weekly
Source: Stockcharts.com
The top chart shows the Weekly Semiconductors (SMH) ETF, concentrated mainly in US-based Mega-Cap Semiconductors companies. SMH is a lead indicator for the market when investors are willing to take on increased risk and the opposite when the market is falling. SMH broke its downtrend in October 2022 and retraced the breakout in late December, testing the low with a pattern of higher lows and higher highs.
Semiconductors (SMH) rose +3.37 % last week, its highest close since last March, closing at 263.19, a leading sector in 2023, up +29.69%. Its positive SMH has remained in an intermediate uptrend since September 2022 (green line) and continues to close above its 50 and 200-Week Moving averages (blue and red rectangle), implying underlying strength.
MACD, the lower chart remains on a buy, above 0, rising a sign of positive momentum. However, be alert that the daily chart of Semiconductors made a higher high with a potential negative divergence forming (chart not shown) similar to QQQ and bears watching.
Many times, before a correction occurs, the SMH will be a clue that there will be a decline because it will fall faster than the QQQ and lead the market lower. Watch the strength of SMH if it outperforms the QQQ, which is positive, or on the other hand, if SMH underperforms the QQQ, which would be considered short-term negative.
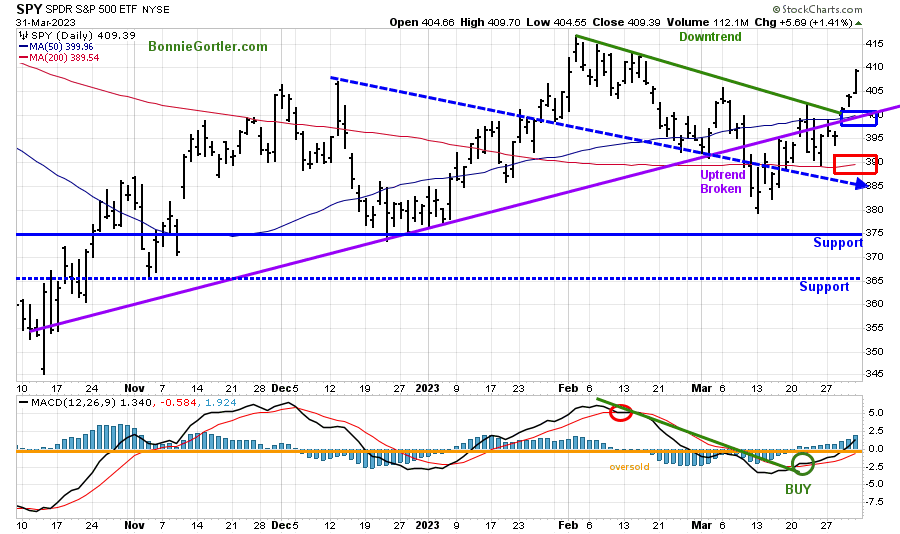
Figure 16: The S&P 500 Index (SPY) Daily (Top) and 12-26-9 MACD (Bottom)
033123 SPY Daily
Source: Stockcharts.com
The S&P 500 (SPY) made a six-month high in early February 2023 and turned lower, making a low in March.
Last week SPY rose +3.45%, closing at its high on Friday and above the October 2022 uptrend (purple line), where it broke down. SPY is above the 50-Day Moving Average (blue rectangle) and above the 200-Day Moving Average (red rectangle), a sign of underlying strength.
MACD (bottom chart) remains on its buy from the previous week rising and above 0.
Resistance is at 412.00, 417.00, and 425.00. Support is at 405.00, 400.00, 385.00, 375.00, and 365.00.
A close below 385.00 would imply a test of its December low. On the other hand, two closes above 417.00 on the SPY could trip the stops and fuel the SPY higher towards 425.00, followed by 450.00.
Selling pressure slowed in Financials.
Figure 17: The Financial Select Sector SPDR (XLF) Daily (Top) and 12-26-9 MACD (Bottom)
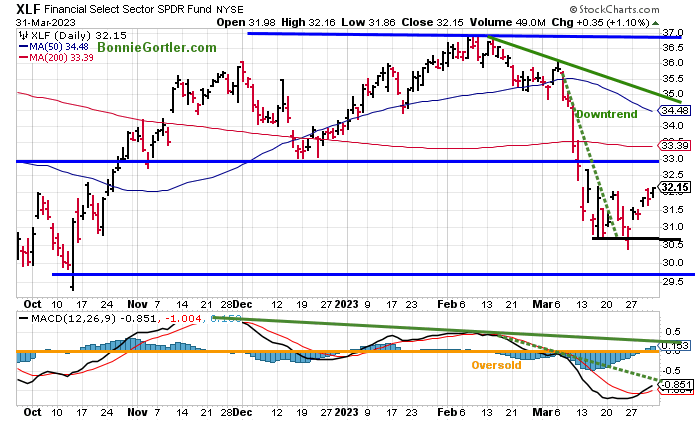
033123 XLF Daily
Source: Stockcharts.com
Financials (XLF) gained +3.74% as selling subsided, closing at its high for the week. Regional Banks (KRE), more volatile than XLF, was not as strong, only up +0.78% but near it’s high on Friday.
XLF support is at 31.50, 31.00, and 29.50.
Resistance is at 33.50 and 35.00.
MACD is on a buy, but the February momentum downtrend remains.
The first rally will be sharp as many financial stocks have fallen substantially, and investors will go bargain hunting. It’s too soon to know if XLF has bottomed and the rise is sustainable; a safer entry, not necessarily at a lower price, will be in 3-6 weeks after the low occurs, which is still unknown.
A Buying Opportunity Developing In Utilities?
Figure 18: Utilities SPDR (XLU) Daily (Top) and 12-26-9 MACD (Bottom)
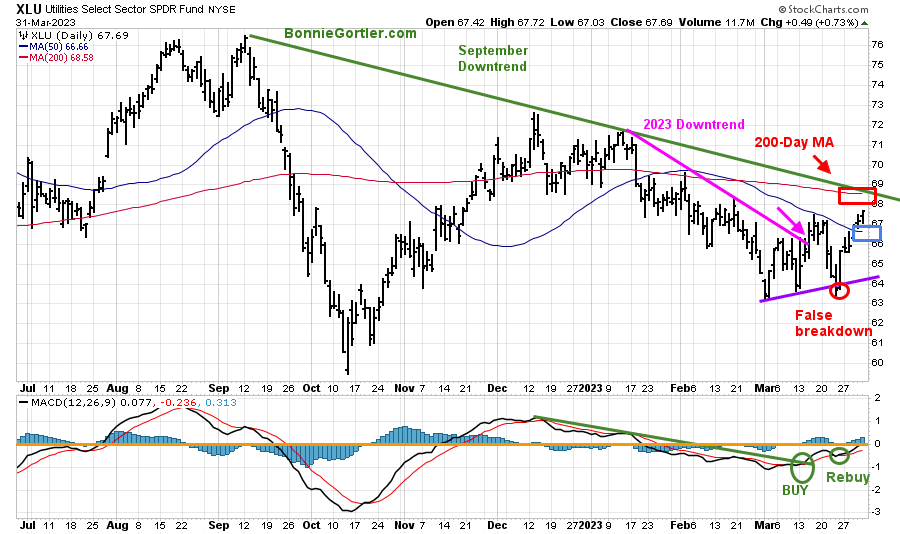
033123 XLU Daily
Source: Stockcharts.com
The Utilities SPDR (XLU) has been in a downtrend in 2023 that began in September 2022.
XLU rose +3.04% after a false breakdown the previous week.
MACD remains constructive, on a buy (green circle), rising, and a break of downside momentum since December 2022.
A close above 69.00 would break the downtrend and imply further gains are likely. This sector has been out of favor which could change quickly. On the other hand, a close below 63 would be negative.
Summing Up:
There is skepticism the advance will continue with uncertainty about the financial system, interest rates, the extent of the possible recession, and future earnings. Market breadth has improved, but there is no confirmation the advance will show broader participation than Technology and Semiconductors, which led the Nasdaq higher in the first quarter. The major averages are extended in the short term with resistance above. On the plus side, the fear of missing a continuation of the move remains, with April one of the best months for stocks historically. The stock market rally’s sustainability remains in question, but in the short term, the bulls remain in control until proven otherwise.
Remember to manage your risk, and your wealth will grow.
Let’s talk investing. You are invited to set up your Free 30-minute Wealth and Well-Being Strategy session by clicking here or emailing me at Bonnie@BonnieGortler.com. I would love to schedule a call and connect with you.
Disclaimer: Although the information is made with a sincere effort for accuracy, it is not guaranteed that the information provided is a statement of fact. Nor can we guarantee the results of following any of the recommendations made herein. Readers are encouraged to meet with their own advisors to consider the suitability of investments for their own particular situations and for determination of their own risk levels. Past performance does not guarantee


Create more wealth in your life
with these simple strategies.
As an added bonus you will also
receive BG’s Updates and Ezine

Discover how to quickly create more well-being in your life with these simple strategies.
As an added bonus you will also
receive BG’s Updates and Ezine

As an added bonus you will receive BG’s Updates and Ezine

All work listed on BonnieGortler.com is licensed under a Creative Commons Attribution - Noncommercial - No Derivative Works 3.0 Unported License.


Free Report:
Grow and Sustain Your Wealth
Discover how to grow your money with these easy, simple steps.

