

10 Simple Tips for Financial Well-Being
07/01/2026
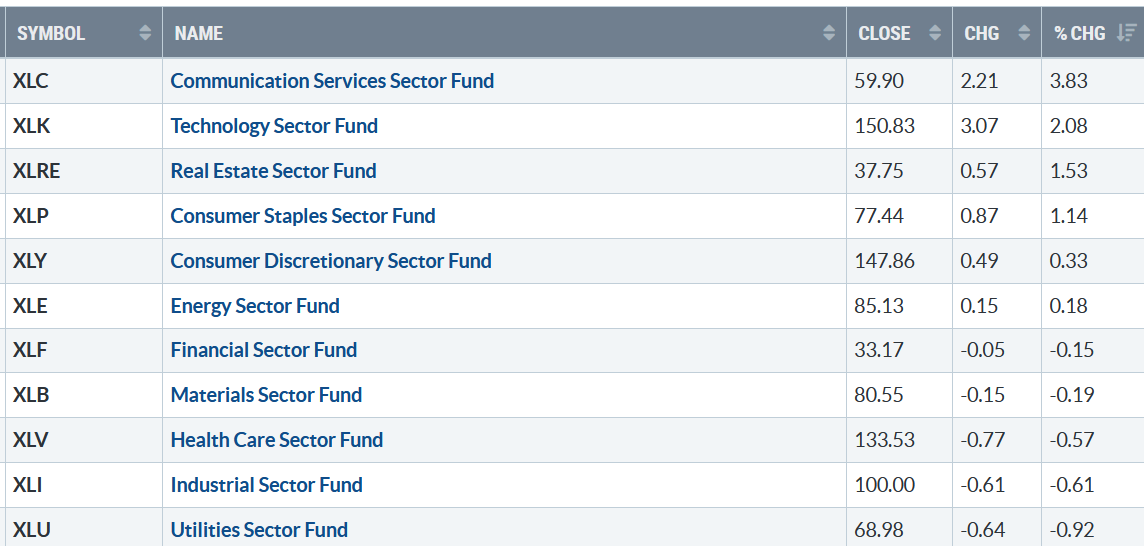
April closed strong, but only six of the eleven S&P SPDR sectors were positive for the week. Communication Services (XLC) and Technology (XLK) were the leading sectors, while Industrials (XLI) and Utilities were the weakest, with the SPDR S&P 500 ETF Trust (SPY) up +0.90%.
S&P SPDR Sector ETFs Performance Summary 4/21/23-04/28/23
042823 SPDR Sectors
Source: Stockcharts.com
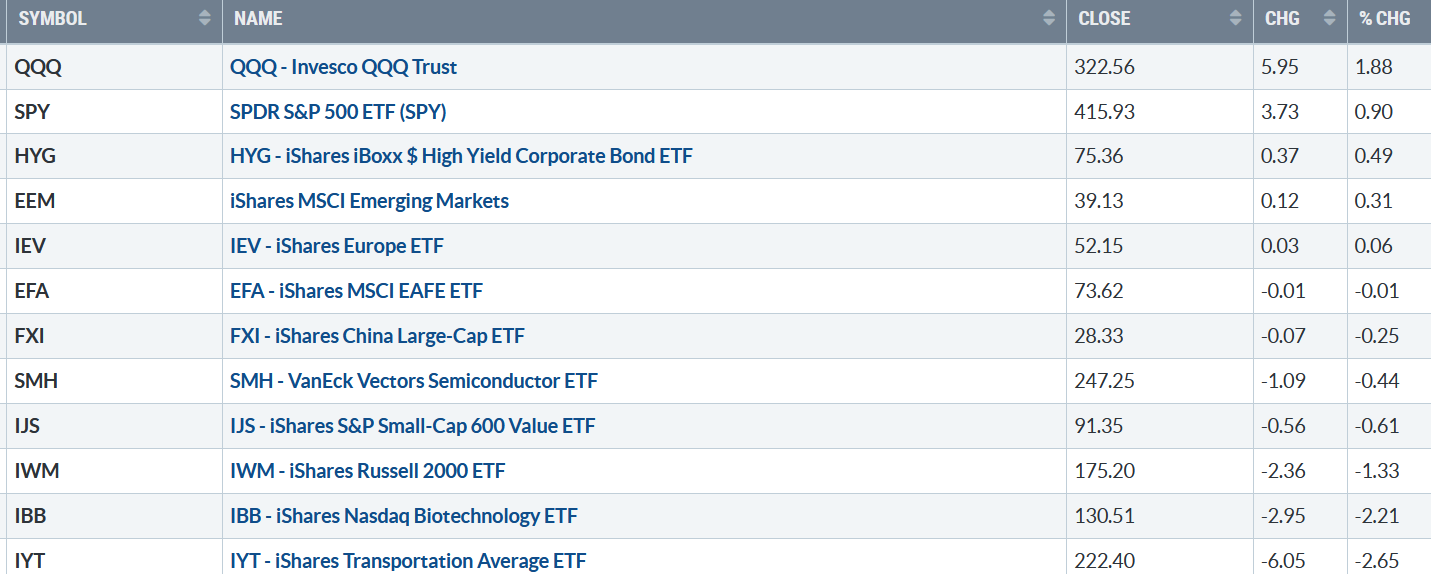
Figure 2: Bonnie’s ETFs Watch List Performance 4/21/23-04/28/23
042823 Week ETFs
Source: Stockcharts.com
Technology led the way last week, with Biotechnology and Transports lagging.
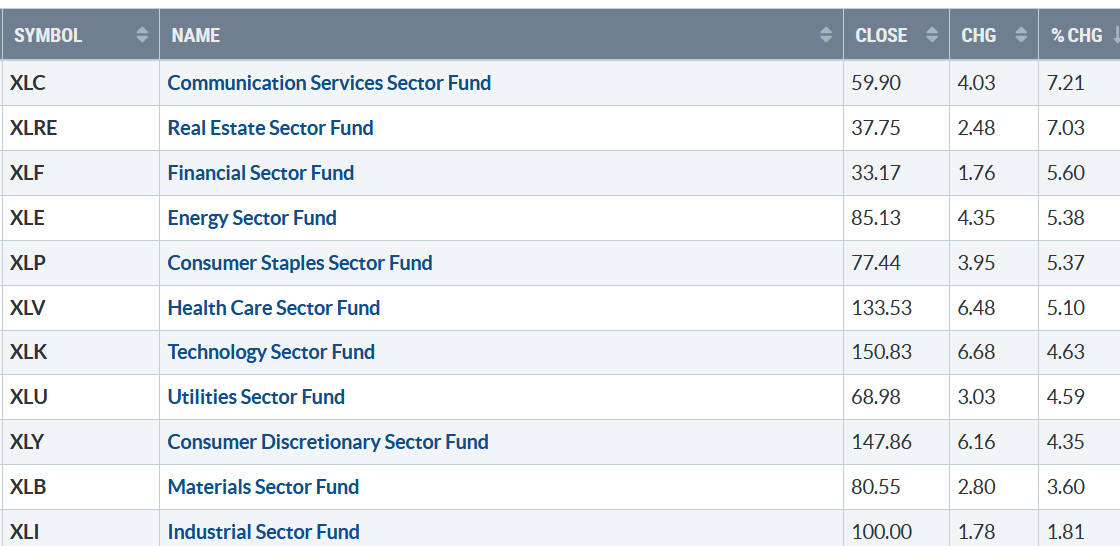
Figure 3: S&P SPDR Sector ETFs Performance Summary April Performance
042823 SPDR Sectors Month of April
Source: Stockcharts.com
All eleven S&P SPDR sectors were positive in April, with Communication Services the best S&P SPDR sector in April, while Industrials was the weakest.
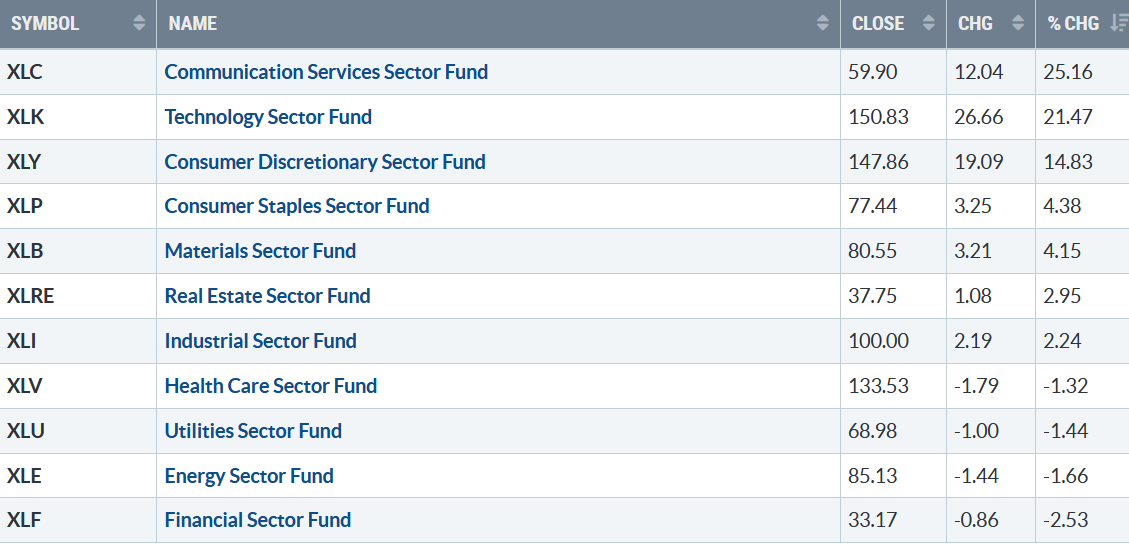
Figure 4: S&P SPDR Sector ETFs Performance Summary 12/31/23-4/28/23
042823 SPDR Sectors YTD
Source: Stockcharts.com
In 2023, Communication Services was the leading S&P SPDR sector, while Financials was the worst.
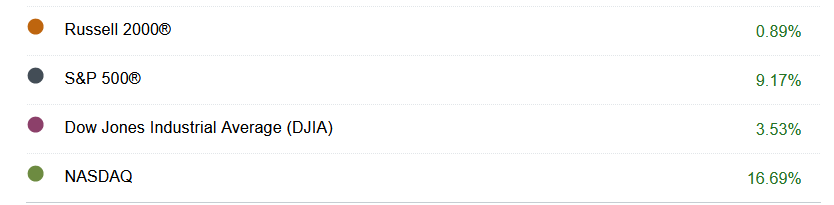
Figure 5: YTD Market Indices
042823 Market Indices YTD
Source: Schwab
Nasdaq is the big winner in 2023.
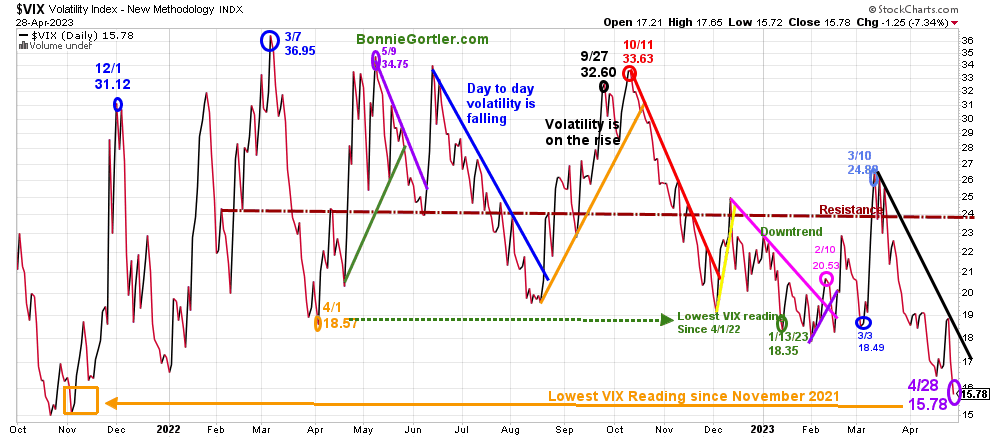
Figure 6: CBOE Volatility Index VIX
042823 VIX Daily
Source: Stockcharts.com
The CBOE Volatility Index (VIX), a measure of fear, traded above 20.00 for most of 2022, with a high at 36.95 on 3/7 (blue circle) and a low on 4/1/22 at 18.57. A new VIX low didn’t occur until 1/13/23 at 18.35 (green circle).
VIX fell last week, closing at 15.78 (purple circle), below the year’s April, March, and January lows, the lowest close since November 2021.
Watch for increasing daily fluctuations and a more severe pullback if VIX rises above 20.00 and then closes above 24.00.
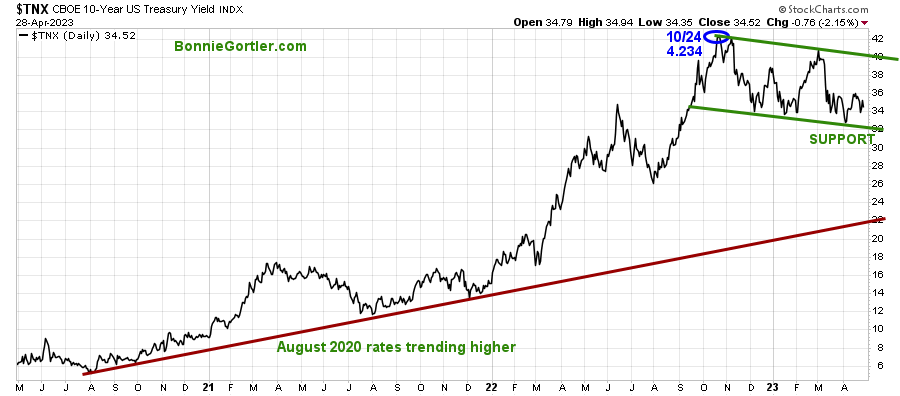
Figure 7: UST 10YR Bond Yields Daily
042823 UST 10 Yr Bond Yields Daily
Source: Stockcharts.com
The 10-Year U.S. Treasury yields fell last week, closing at 3.452%. Support is 3.20%, with resistance between 3.6% and 4.00%.
All three major market averages finished higher last week. The Dow gained +0.86%, the S&P 500 was up +0.87%, and the Nasdaq gained +1.28%. The Russell 2000 Index continued to lag the major averages down -1.26%, but it was positive IWM closed near its highs on Friday.
Learn about coaching with Bonnie. Ask questions. Discover more about the coaching processes in this 15-minute call by signing up here or emailing me at Bonnie@BonnieGortler.com. I would love to schedule a call and connect with you.
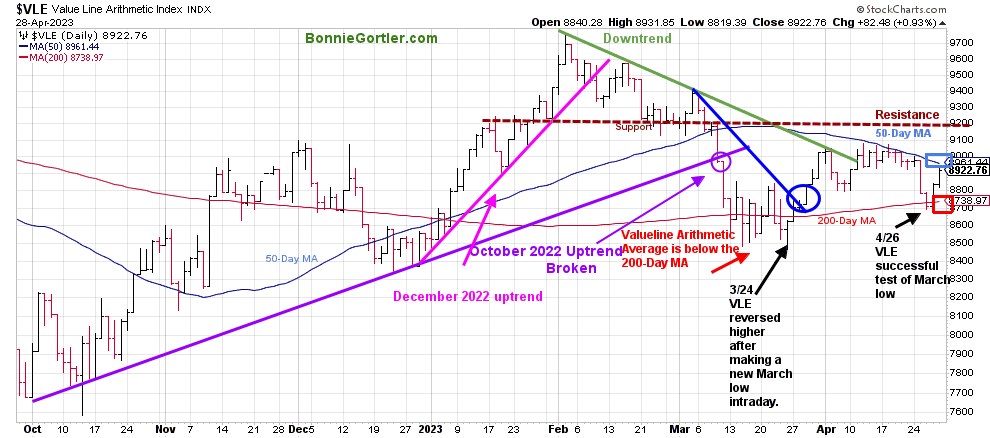
Figure 8: Value Line Arithmetic Average
042823 VLE Daily
Source: Stockcharts.com
The Value Line Arithmetic Index ($VLE) is a mix of approximately 1700 stocks. VLE broke the October 2022 uptrend in early March, headed lower, and on 3/24, reversed higher.
Last week VLE closed near their weekly highs but fell -0.57%, closing above the 200-Day MA but remaining below the 50-Day MA (blue rectangle), 8961.44 as of 4/28.
Key resistance is at 9200, and first support is at 8700. If the Value Line Index closes below the April 26 low, the odds will favor a decline toward the 3/24 low at 8466. A close below would be a warning a significant decline could begin.
Market Internals are not impressive and continue to be concerning.
Weekly market breadth was slightly positive on the New York Stock Exchange Index (NYSE) and negative for the Nasdaq. The NYSE had 1591 advances and 1568 declines, with 158 new highs and 178 new lows. There were 2065 advances and 2874 declines on the Nasdaq, with 209 new highs and 683 new lows.
For a broad advance to follow, you want to see an expansion in the weekly number of New Highs and New Lows to contract.
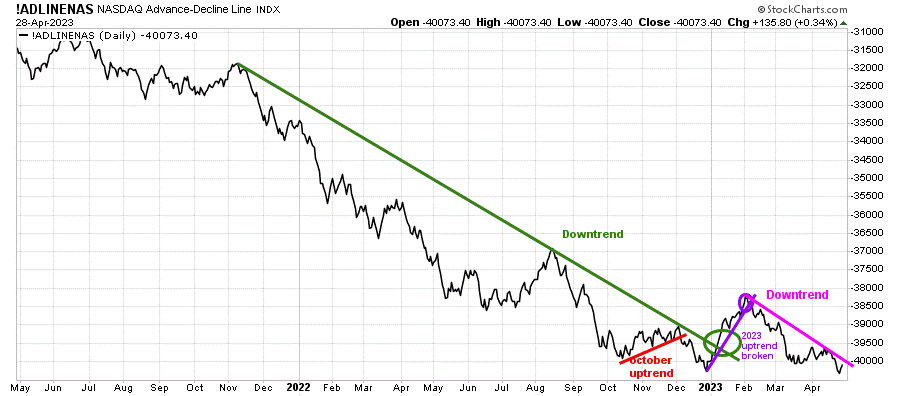
Figure 9: Nasdaq Advance Decline Line Daily
042823 Daily Nasdaq Cumulative Advance-Decline Line
Source: Stockcharts.com
The chart is the Nasdaq Daily Advance-Decline Line, a technical indicator that plots the difference between the number of advancing and declining stocks.
In January, the October 2022 downtrend was broken (green line). However, the improvement in market breadth was short-lived.
It remains concerning market breadth has deteriorated since February 2023 and remains weak despite the gains in the Nasdaq.
Continue to watch market breadth over the next few weeks. It will be positive in the near term if the downtrend breaks and more stocks participate in the rally if there is an expansion of net advances, more daily new highs, and fewer new lows.
On the other hand, if there are more declines than advances and an increase in new lows and fewer new highs, it would be negative and imply further weakness in the broad market.
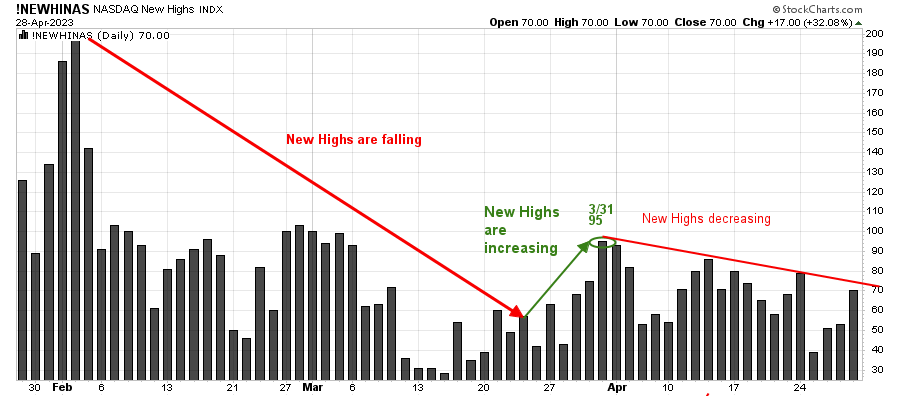
Figure 10: Nasdaq New Highs
042823 Nasdaq New Highs Daily
Source: Stockcharts.com
The Nasdaq Index rose +1.28% last week and is up 16.82% in 2023. It remains concerning that the number of stocks making new highs is not expanding and have not surpassed even the March highs.
On the other hand, if New Highs expand and get above 100, it would be a positive sign, but it would be better if they expand over 200 and take out the February highs at a minimum. If New Highs don’t expand and begin to fall, a pullback in Nasdaq is likely.
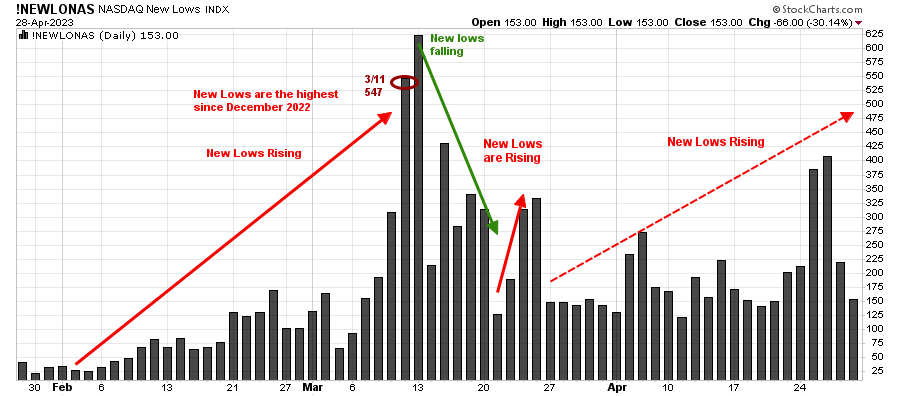
Figure 11: Nasdaq New Lows
042823 Nasdaq New Lows Daily
Source: Stockcharts.com
Nasdaq New Lows increased from the end of March and continued in April (red dotted line). If New Lows contracts, it would be positive in the short term, but if they rise above 400, it would be negative and increase the odds for a pullback.
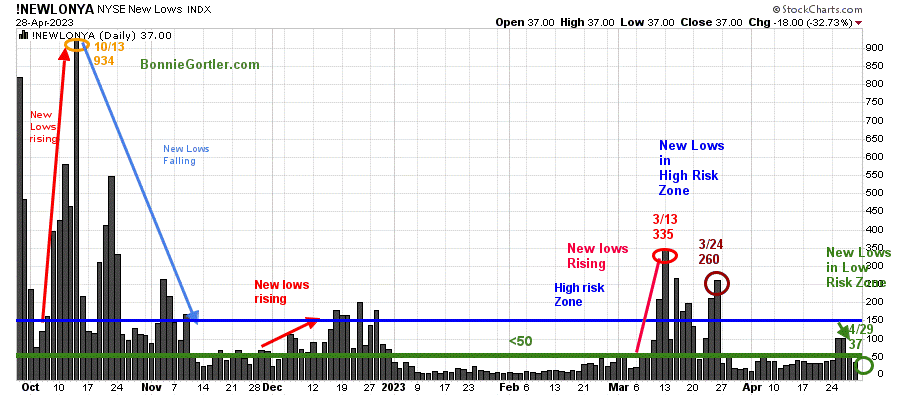
Figure 12: Daily New York Stock Exchange (NYSE) New Lows
042823 NYSE New Lows Daily
Source: Stockcharts.com
Watching New Lows on the New York Stock Exchange is a simple technical tool that helps awareness of the immediate trend’s direction.
New lows warned of a potential sharp pullback, high volatility, and “panic selling” for most of 2022, closing above 150. The peak reading was 9/23/22 when New Lows made a new high of 1106 (pink circle), and New Lows expanded to their highest level in 2023 on 3/13 (red circle) to 335, well under the peak for now.
It was positive New Lows closed in a low-risk zone last week at 37 on 4/28 (green circle). I want New Lows to fall to the lowest risk zone below 25 and stay there consistently. On a side note, the NYSE had 72 New Highs, the most since March 6, which is promising. I would like to see more than 203 New Highs by early next week for confirmation the rally is broadening.
On the other hand, a rise above 150 New Lows would be a warning of weakness forthcoming.
Learn more about the significance of New Lows in my book, Journey to Wealth, published on Amazon. If you would like a preview, get a free chapter here.
Learn more about charting in my Free Charting Masterclass, Charting Strategies to Cut Risk and Trade with the Trend. Sign up here
Small Caps downtrend remains.
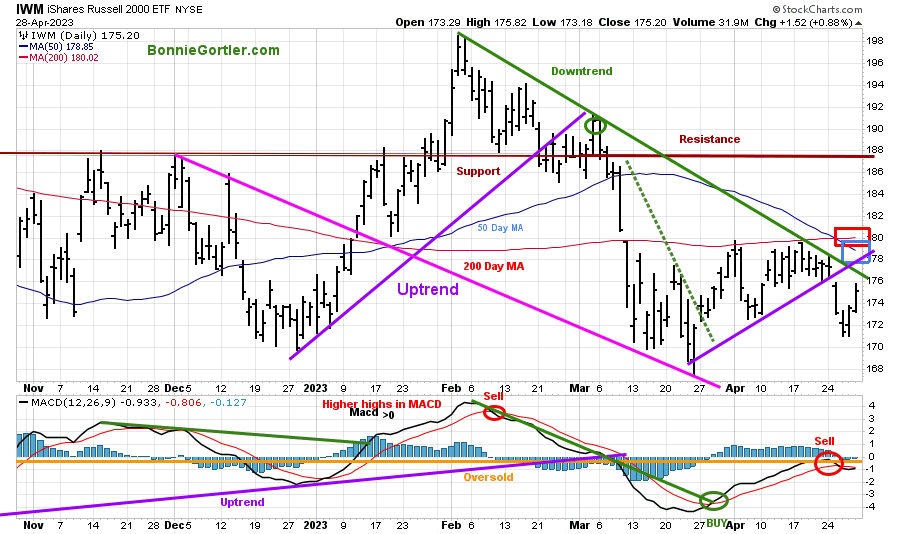
Figure 13: Daily iShares Russell 2000 (IWM) Price (Top) and 12-26-9 MACD (Bottom)
042823 IWM Daily
Source: Stockcharts.com
The top chart is the daily iShares Russell 2000 Index ETF (IWM), the benchmark for small-cap stocks, with a 50-Day Moving Average (MA) (blue line) and 200-Day Moving Average (MA) (red line) that traders watch and use to define trends.
Day to Day volatility in IWM has quieted, but IWM remained weak, down -1.33%, closing at 178.40. IWM remains in a downtrend from February (solid green line) and below the 50-Day MA (blue rectangle) and 200-Day MA (red rectangle), implying underlying weakness.
Resistance is at 180.00, 184.00, and 188.00, where IWM broke down in March. Support is at 173.00 and 166.00.
MACD is on a sell, but momentum has flattened, and in a position for a buy after reaching the most oversold level since October 2022 if IWM can get over resistance at 180.00.
Overhead Resistance
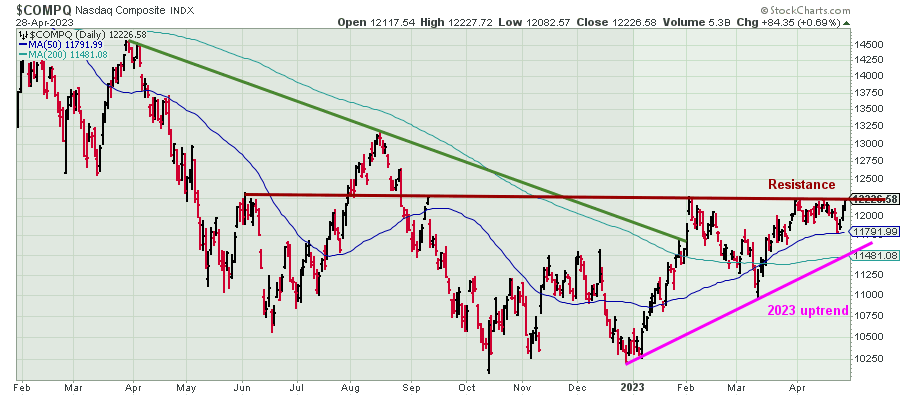
Figure 14: Nasdaq Composite
042823 Nasdaq Comp Daily
Source: Stockcharts.com
Nasdaq closed slightly under resistance at 12300, and a close above could fuel buying into the beginning of May.
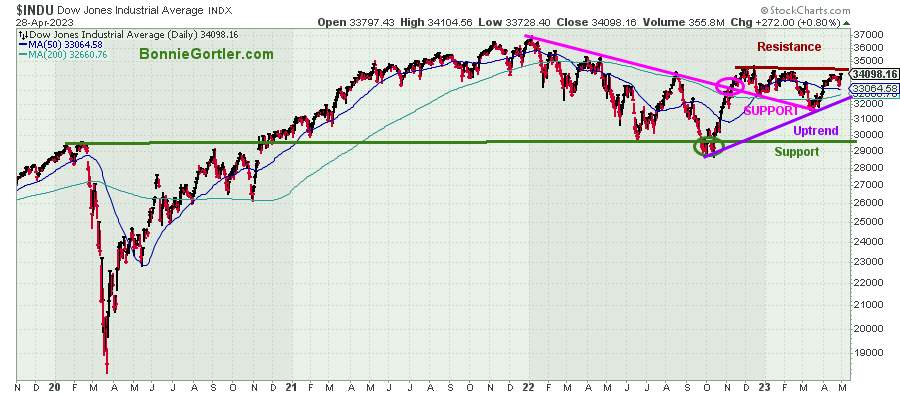
Figure 15: Dow Jones Industrial Average
042823 Dow Jones Industrial Daily
Source: Stockcharts.com
The Dow Industrials closed below resistance at 34250, and a close above could fuel buying into the beginning of May, as the Dow has underperformed in 2023 and could attract buying by investors.
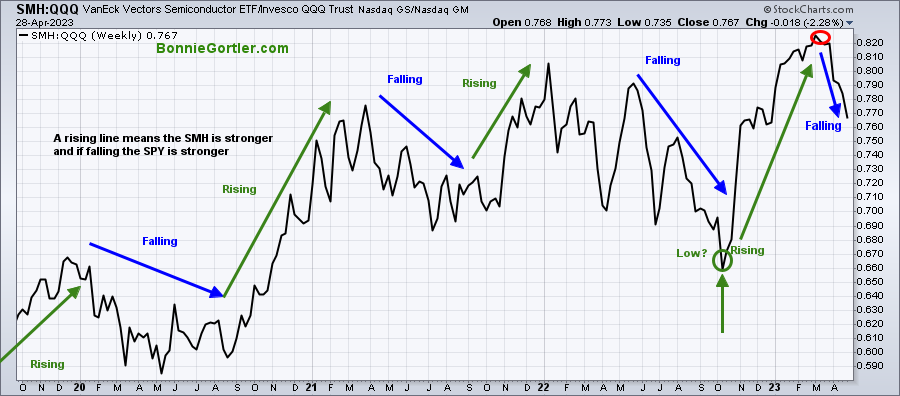
SMH is no longer stronger than QQQ based on relative strength for the intermediate trend.
Figure 16: Semiconductors (SMH)/Invesco QQQ Trust/ Ratio (SMH/QQQ) Weekly
042823 SMH QQQ Weekly Relative Strength Ratio
The top part of the chart is the weekly Semiconductors (SMH) Invesco QQQ Trust Relative Strength Index Ratio (SMH/QQQ). A rising line means the SMH is stronger; if falling, the QQQ is stronger.
SMH made a new relative strength high in February but has peaked and turned down, no longer leading in relative strength. The SMH will often be a clue before a significant correction starts because it will lag and fall faster than the QQQ leading the broad market lower.
Keep an eye out next week if SMH continues to underperform the QQQ, which is considered short-term negative, or on the other hand, if SMH outperforms the QQQ, which would be sort term positive.
The SMH intermediate uptrend is broken.
Figure 17: Weekly Vaneck Vectors Semiconductors (SMH) Price (Top) and 12-26-9 MACD (Middle) and Money Flow (Bottom)
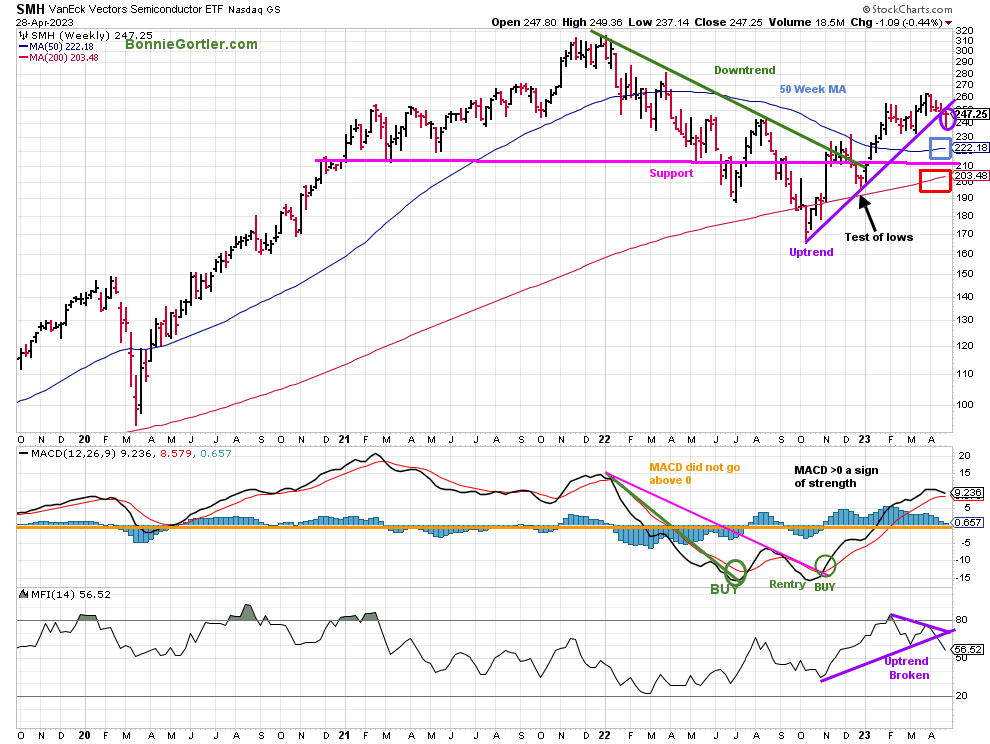
042823 SMH Weekly
Source: Stockcharts.com
The top chart shows the Weekly Semiconductors (SMH) ETF, concentrated mainly in US-based Mega-Cap Semiconductors companies. SMH is a lead indicator for the market when investors are willing to take on increased risk and the opposite when the market is falling. SMH broke its downtrend in October 2022 (green line) and retraced the breakout in late December, testing the low with a pattern of higher lows and higher highs.
Last week SMH lagged, falling by -0.82%, breaking the uptrend from October (purple line), a warning further weakness could occur. However, it remains positive that SMH closed above the 50 and 200-week MA (blue and red rectangle).
MACD, the middle chart, remains on a buy, above 0, falling a sign that momentum is weakening as well as Money Flow (MFI) falling and breaking the October uptrend.
Many times, before a correction occurs, weakness in the SMH will be a clue that there will be a decline sooner than later. Watch the strength of SMH this week if it shows strength and leads the market higher or if it lags the overall market and is under selling pressure, which would be considered a short-term negative.
Figure 18: Daily Invesco QQQ Trust (QQQ) Price (Top) and 12-26-9 MACD (Middle) and Money Flow (Bottom)
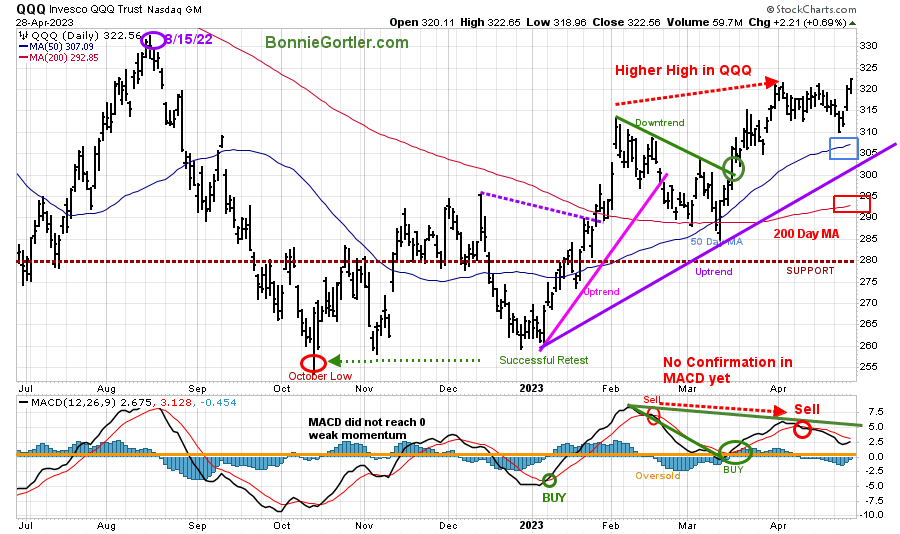
042823 QQQ Daily
Source: Stockcharts.com
The chart shows the daily Invesco QQQ, an exchange-traded fund based on the Nasdaq 100 Index. QQQ made a low in October 2022 (red circle), followed by a successful retest of the low in early January 2023.
QQQ rose +1.88% last week, closing at 322.56, above the March high at 320.93 and remaining above the 50-Day Moving Average and the 200-Day Moving Average (red rectangle).
Resistance is at the old high, made in August 2022 at 331.16. Support is at 314.00, 310.00, 300.00, and 293.00.
The middle chart is MACD (12, 26, 9), a measure of momentum remains on a sell with a negative divergence (higher high in price and lower high in MACD) and in a downtrend from February.
The uptrend remains in effect, however, momentum has begun to weaken and bears watching.
Figure 19: Weekly Invesco QQQ Trust (QQQ) Price (Top) and 12-26-9 MACD (Bottom)
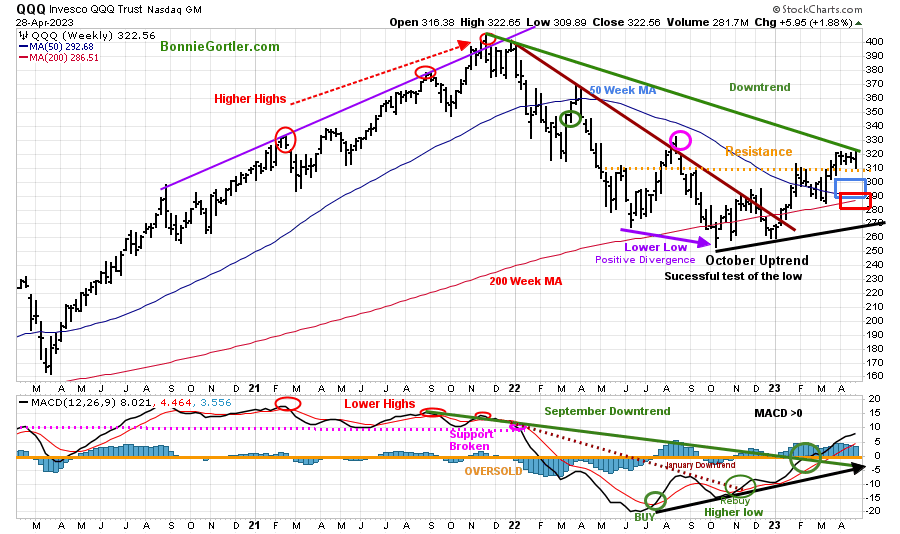
042823 QQQ Weekly
Source: Stockcharts.com
The intermediate trend remains up and is close to penetrating the 2022 price downtrend (green line top chart) above the August highs (pink circle).
QQQ remains above the old resistance at 310.00, now acting as support. It’s positive QQQ closed above the 50 Week and 200 Week MA.
MACD remains above 0, rising after breaking the September momentum downtrend.
The bulls remain in control for now, but keep a close eye on Apple (APPL) and Microsoft (MSFT), the largest holdings in QQQ that comprise about 25% of QQQ if they weaken.
Figure 20: Weekly APPLE (AAPL) Price (Top) and 12-26-9 MACD (Bottom)
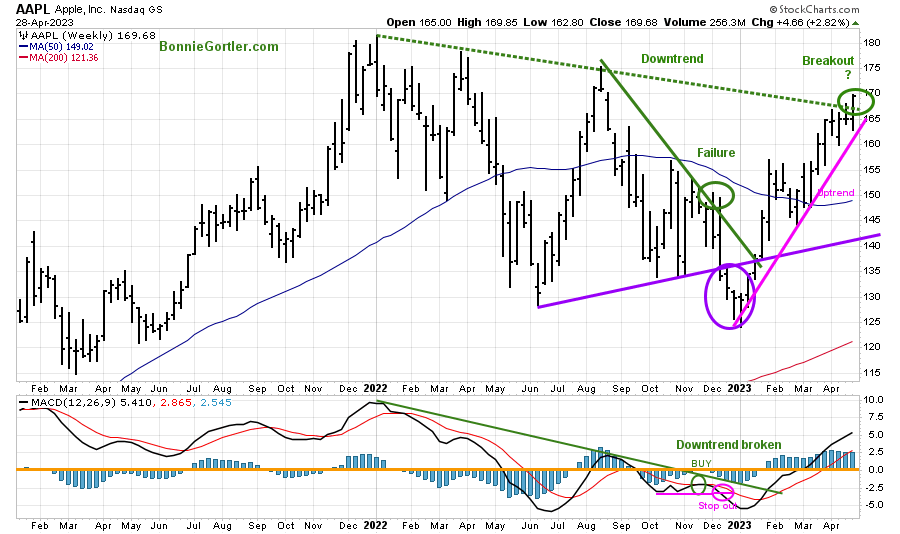
042823 AAPL Weekly
Source: Stockcharts.com
Apple (AAPL) has broken the December 2022 downtrend, and the intermediate trend remains positive.
Figure 21: The S&P 500 Index (SPY) Daily (Top) and 12-26-9 MACD (Bottom)
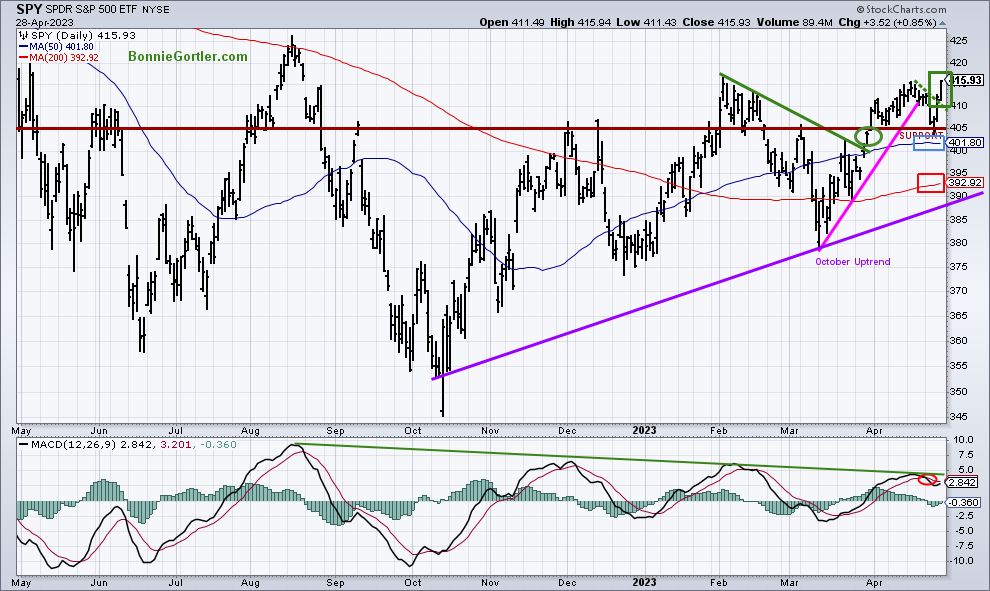
042823 SPY Daily
Source: Stockcharts.com
The S&P 500 (SPY) made a six-month high in early February 2023 and then turned lower, making a low in March, followed by higher prices.
SPY was weak early in the week, holding support (brown line), rising +0.90%, closing at its high on Friday and above the 50-Day Moving Average (blue rectangle) and above the 200-Day Moving Average (red rectangle), a sign of underlying strength.
MACD (bottom chart) is on a sell as momentum has slowed since SPY has been in a trading range for the past few months.
Resistance is at 417.00 and 425.00. Support is at 405.00, 400.00, 392.00, and 385.00,
A close below 385.00 would imply a test of its December low. On the other hand, two closes above 417.00 on the SPY could trip the stops and fuel the SPY higher towards 425.00, followed by 450.00.
Summing Up:
The broad market remains weak on unimpressive market breadth. However, Mega CapTech continues to lead the S&P 500 and Nasdaq higher in 2023. The intermediate trend remains favorable for the major averages, and support levels are holding. The major averages are threatening to break out of their recent trading range getting through resistance which could ignite more buying of stocks by institutions fueling the market higher. Until Semiconductors head lower and technology falters, continue to give the bulls the benefit of the doubt.
Remember to manage your risk, and your wealth will grow.
Let’s talk investing. You are invited to set up your Free 30-minute Wealth and Well-Being Strategy session by clicking here or emailing me at Bonnie@BonnieGortler.com. I would love to schedule a call and connect with you.
Disclaimer: Although the information is made with a sincere effort for accuracy, it is not guaranteed that the information provided is a statement of fact. Nor can we guarantee the results of following any of the recommendations made herein. Readers are encouraged to meet with their own advisors to consider the suitability of investments for their own particular situations and for determination of their own risk levels. Past performance does not guarantee any future results.


Create more wealth in your life
with these simple strategies.
As an added bonus you will also
receive BG’s Updates and Ezine

Discover how to quickly create more well-being in your life with these simple strategies.
As an added bonus you will also
receive BG’s Updates and Ezine

As an added bonus you will receive BG’s Updates and Ezine

All work listed on BonnieGortler.com is licensed under a Creative Commons Attribution - Noncommercial - No Derivative Works 3.0 Unported License.


Free Report:
Grow and Sustain Your Wealth
Discover how to grow your money with these easy, simple steps.


Thanks for the weekly market update. Your opinion and experience are always valued.
Hi Bruce
You are welcome. I appreciate your kind words.
Bonnie