

10 Simple Tips for Financial Well-Being
07/01/2026
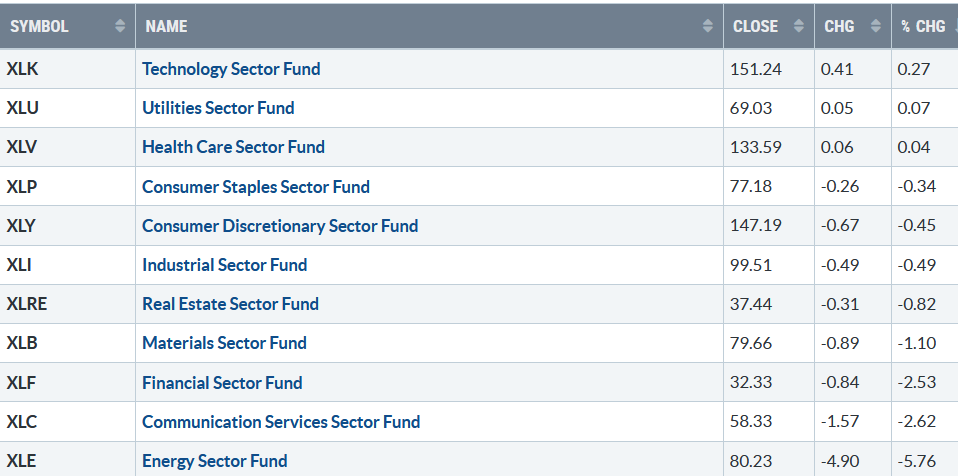
A rally on Friday where all sectors moved higher but only three of the eleven S&P SPDR sectors finished positive for the week. Technology (XLK) and Utilities (XLU) were the leading sectors, while Communication Services (XLC) and Energy (XLE) were the weakest, with the SPDR S&P 500 ETF Trust (SPY) up +0.90%.
S&P SPDR Sector ETFs Performance Summary 4/28/23-05/05/23
050523 SPDR Sectors
Source: Stockcharts.com
Listen to a quick video recap of the SPDR Sectors (Daily), including the technical indicators, MACD, RSI, MFI, and Bollinger Bands as of 5/5/23.
Watch Here: https://youtu.be/fJbMcEbO5PE
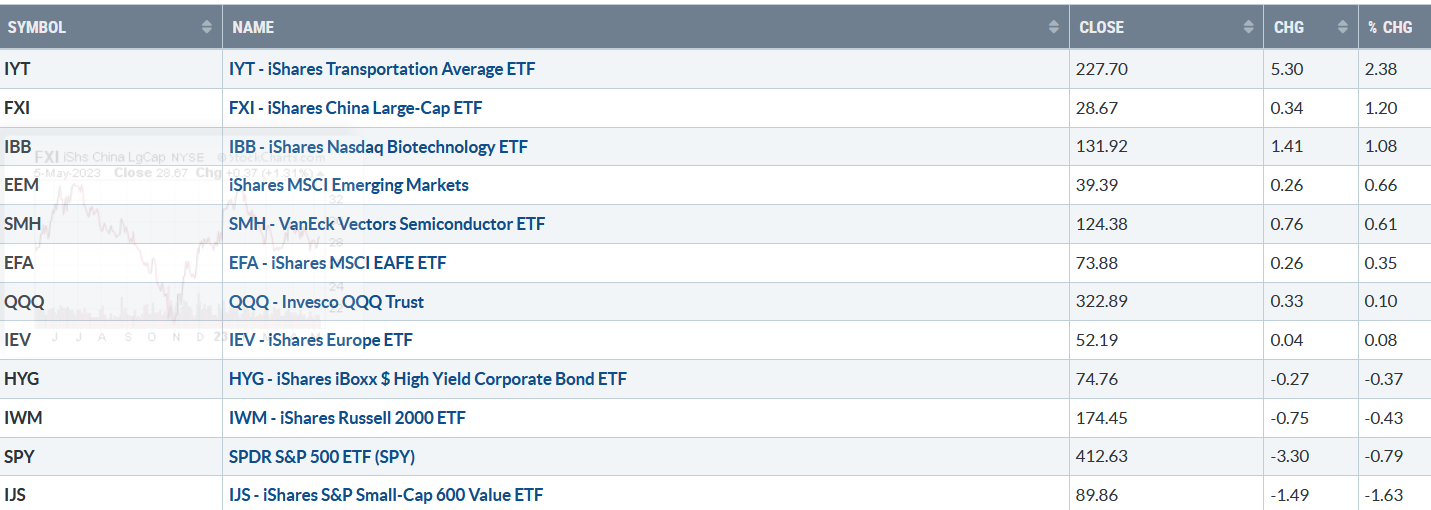
Figure 2: Bonnie’s ETFs Watch List Performance 4/28/23-05/05/23
050523 Week ETFs
Source: Stockcharts.com
Transports, China and Biotechnology, led the way last week while Small Cap Growth and Value continued to lag.
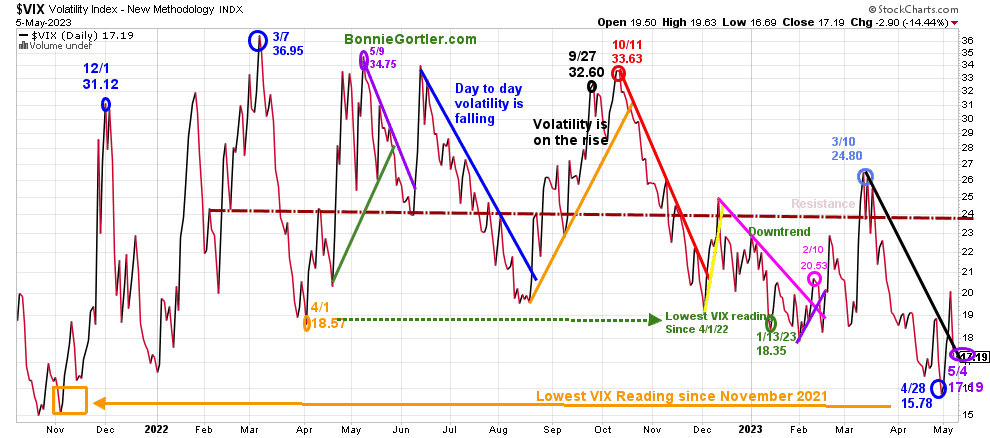
Figure 3: CBOE Volatility Index VIX
050423 VIX Daily
Source: Stockcharts.com
The CBOE Volatility Index (VIX), a measure of fear, traded above 20.00 for most of 2022, with a high at 36.95 on 3/7 (blue circle) and a low on 4/1/22 at 18.57. A new VIX low did not occur until 1/13/23 at 18.35 (green circle).
Last week was volatile, with the Volatility Index (VIX) rising from its lowest reading in 2023 of 15.78, reaching a weekly high of 21.33, and then backing off to close at 17.19 (purple circle).
Watch for increasing daily fluctuations and a more severe pullback if VIX closes above 20.00 and then closes above 24.00.
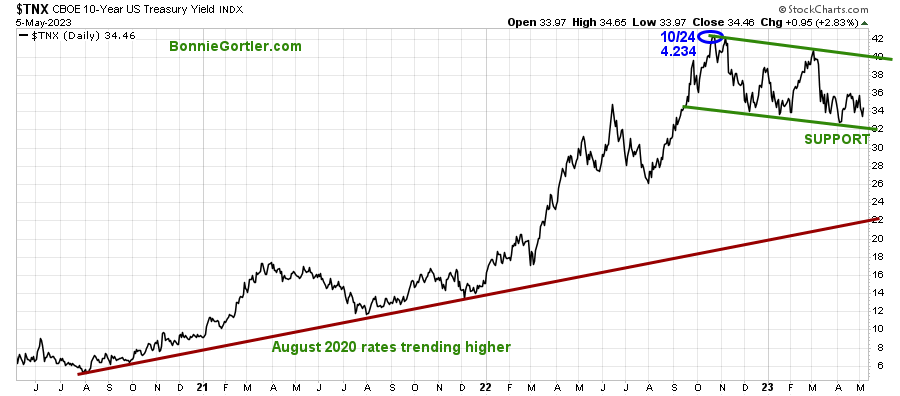
Figure 4: UST 10YR Bond Yields Daily
0504823 UST 10 Yr Bond Yields Daily
Source: Stockcharts.com
The 10-Year U.S. Treasury yields fell slightly last week, closing at 3.446%. Support is 3.20%, with resistance between 3.6% and 4.00%.
The major market averages broke a four-day losing streak on Friday to finish mixed last week. The Dow, the weakest, fell -1.24%, the S&P 500 was down -0.80.%, and the Nasdaq gained +0.07%. The Russell 2000 Index was down -0.51%, but it was positive IWM closed near its highs on Friday and did not take out the March low.
Learn about coaching with Bonnie. Ask questions. Discover more about the coaching processes in this 15-minute call by signing up here or emailing me at Bonnie@BonnieGortler.com. I would love to schedule a call and connect with you.
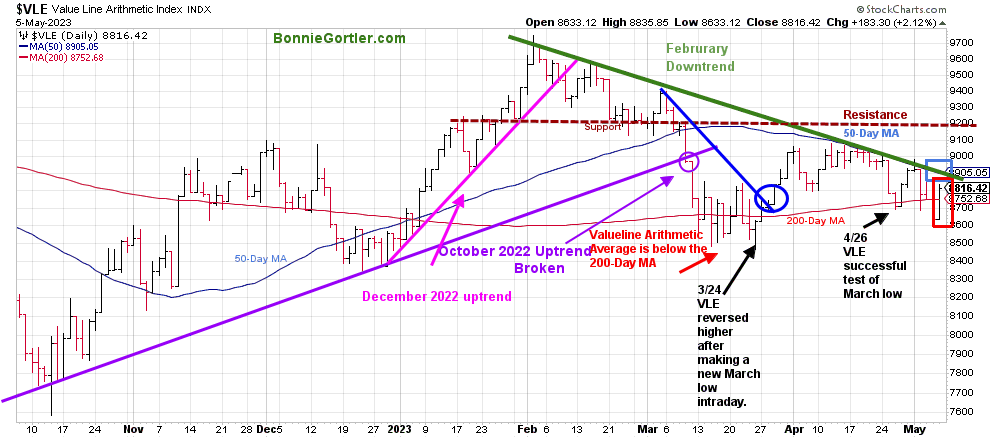
Figure 5: Value Line Arithmetic Average
050523 VLE Daily
Source: Stockcharts.com
The Value Line Arithmetic Index ($VLE) is a mix of approximately 1700 stocks. VLE broke the October 2022 uptrend in early March, headed lower, and on 3/24, reversed higher.
The February downtrend (green line) remains with a negative pattern of lower lows made in April. VLE closed above its weekly low but fell -1.19%, remaining above the 200-Day MA but below the 50-Day MA (blue rectangle), 8905.05 as of 5/4.
Key resistance remains at 9200, and first support is at 8600. If the Value Line Index closes below the April 26 low, the odds will favor a decline toward the 3/24 low at 8466. A close below would be a warning a significant decline could begin.
Market Internals continue to be concerning.
Weekly market breadth was negative on the New York Stock Exchange Index (NYSE) and negative for the Nasdaq. The NYSE had 1110 advances and 2042 declines, with 187 new highs and 358 new lows. There were 2286 advances and 2633 declines on the Nasdaq, with 276 new highs and 784 new lows.
For a broad advance to follow, you want to see an expansion in the weekly number of New Highs and New Lows to contract.
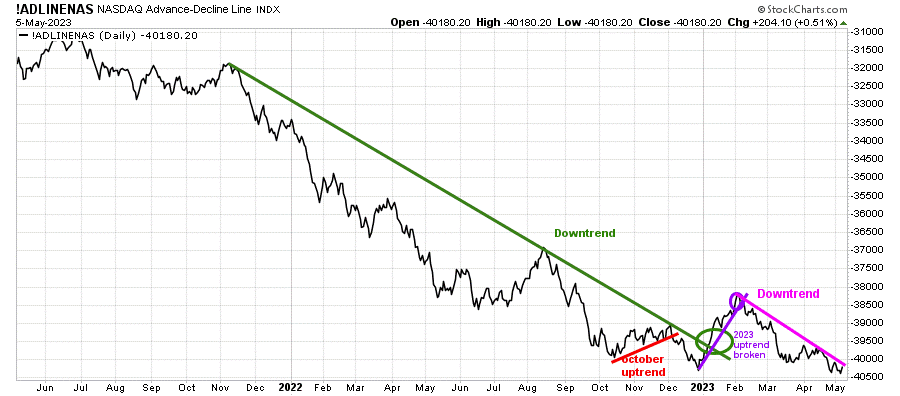
Figure 6: Nasdaq Advance Decline Line Daily
050523 Daily Nasdaq Cumulative Advance-Decline Line
Source: Stockcharts.com
The chart is the Nasdaq Daily Advance-Decline Line, a technical indicator that plots the difference between the number of advancing and declining stocks.
In January, the October 2022 downtrend was broken (green line). However, the improvement in market breadth was short-lived. It remains concerning market breadth has deteriorated since February 2023, and the Nasdaq Advance-Decline line remains in a downtrend (pink line) despite the gains in the Nasdaq.
It will be positive in the near term if the downtrend breaks, and there is an expansion of net advances, more daily new highs, and fewer new lows. On the other hand, if there are more declines than advances and an increase in new lows and fewer new highs, it would imply further weakness in the broad market.
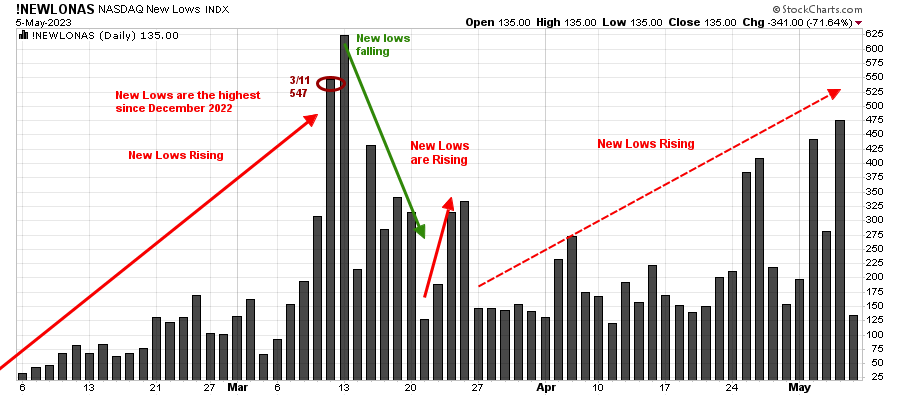
Figure 7: Nasdaq New Lows
050523 Nasdaq New Lows Daily
Source: Stockcharts.com
Nasdaq New Lows increased from the end of March and continued in April (red dotted line). If Nasdaq New Lows contracts to below 50 and stays there, it would be positive in the short term, but if they rise again above 475, it would be negative and increase the odds for a pullback.
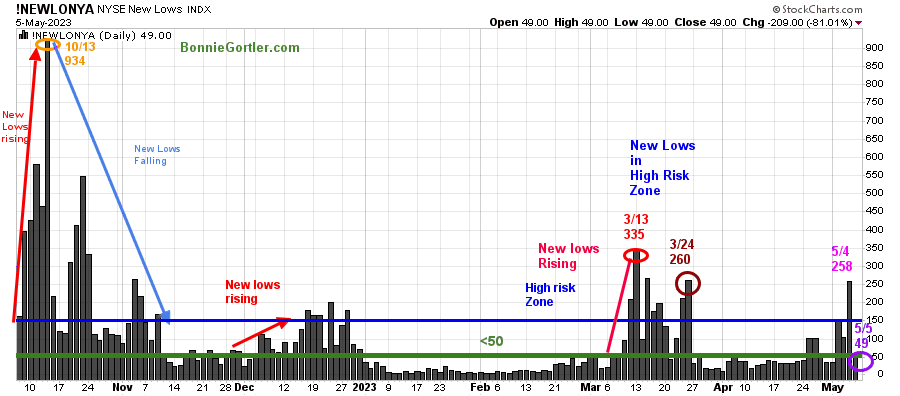
Figure 8: Daily New York Stock Exchange (NYSE) New Lows
050523 NYSE New Lows Daily
Source: Stockcharts.com
Watching New Lows on the New York Stock Exchange is a simple technical tool that helps awareness of the immediate trend’s direction.
New lows warned of a potential sharp pullback, high volatility, and “panic selling” for most of 2022, closing above 150. The peak reading was 9/23/22 when New Lows made a new high of 1106 (pink circle), and New Lows expanded to their highest level in 2023 on 3/13 (red circle) to 335, which have not been taken out in late March or during the weakness in early May.
It was positive New Lows closed at 49 in a low-risk zone on 5/5 (purple circle) after they increased to 254 on 5/4. I want New Lows to continue to fall to the lowest risk zone below 25 and stay there consistently. I would like to see a quick increase of New Highs to more than 203 to confirm the rally is broadening.
On the other hand, two closes above 150 New Lows would imply an increased risk of a decline forthcoming.
Learn more about the significance of New Lows in my book, Journey to Wealth, published on Amazon. If you would like a preview, get a free chapter here.
Learn more about charting in my Free 33-minute training. Sign up here
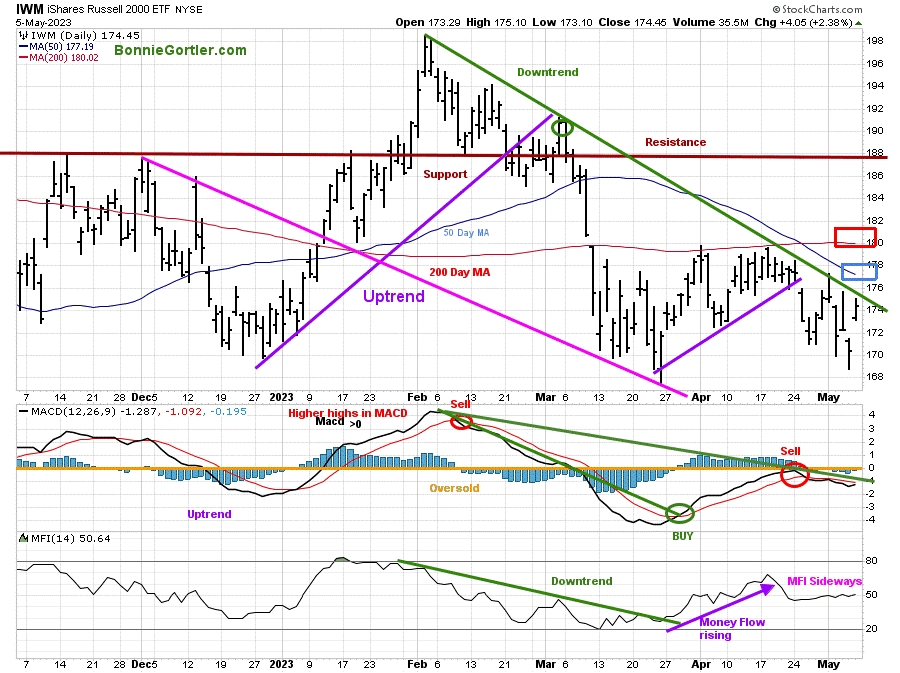
Small Caps downtrend remains.
Figure 9: Daily iShares Russell 2000 (IWM) Price (Top) and 12-26-9 MACD (Bottom)
050523 IWM Daily
Source: Stockcharts.com
The top chart is the daily iShares Russell 2000 Index ETF (IWM), the benchmark for small-cap stocks, with a 50-Day Moving Average (MA) (blue line) and 200-Day Moving Average (MA) (red line) that traders watch and use to define trends.
The IWM February downtrend remains (green line)
IWM weathered the downside pressure on Regional Banks but fell -0.43%, closing at 174.45. IWM remains in a downtrend from February (solid green line) and below the 50-Day MA (blue rectangle) and 200-Day MA (red rectangle), implying underlying weakness.
Resistance is at 178.00, 180.00, and 188.00, where IWM broke down in March. Support is at 173.00, 169.00, and 166.00.
MACD remains on a sell, but momentum is no longer accelerating down, has flattened, and is in a position for a buy after reaching the most oversold level since October 2022 in March if IWM can get over resistance at 180.00.
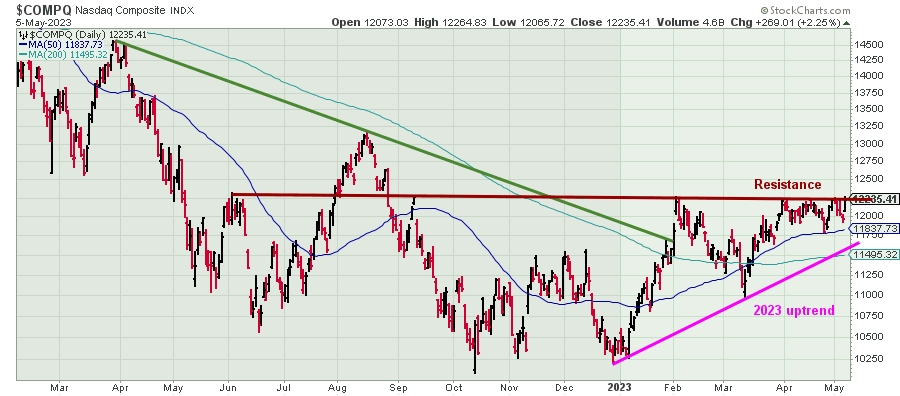
Overhead Resistance Remains
Figure 10: Nasdaq Composite
050523 Nasdaq Composite Daily
Source: Stockcharts.com
Nasdaq closed slightly under resistance at 12300, and a close above for two days could fuel buying in May.
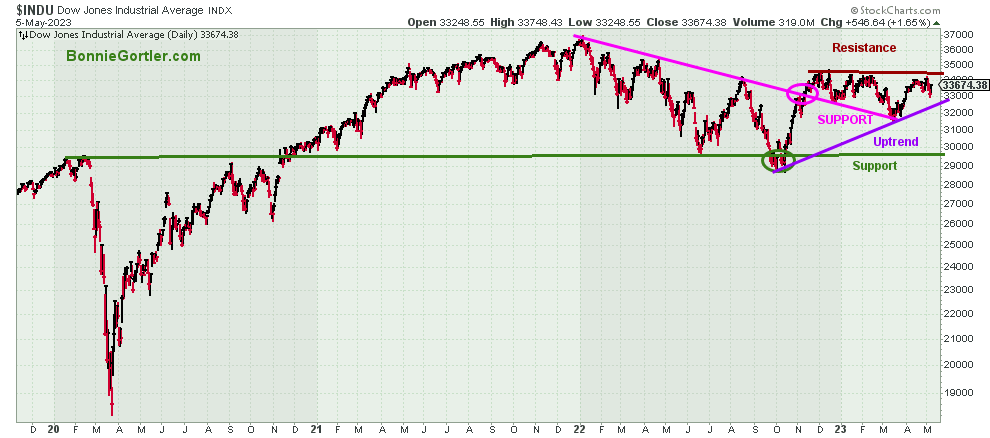
Figure 11: Dow Jones Industrial Average
050523 Dow Jones Industrial Daily
Source: Stockcharts.com
The Dow Industrials closed lower by -1.24% at 33674.38, below resistance at 34250, and a close above for two days could fuel buying in May, as the Dow has underperformed in 2023 and could attract new buying by investors.
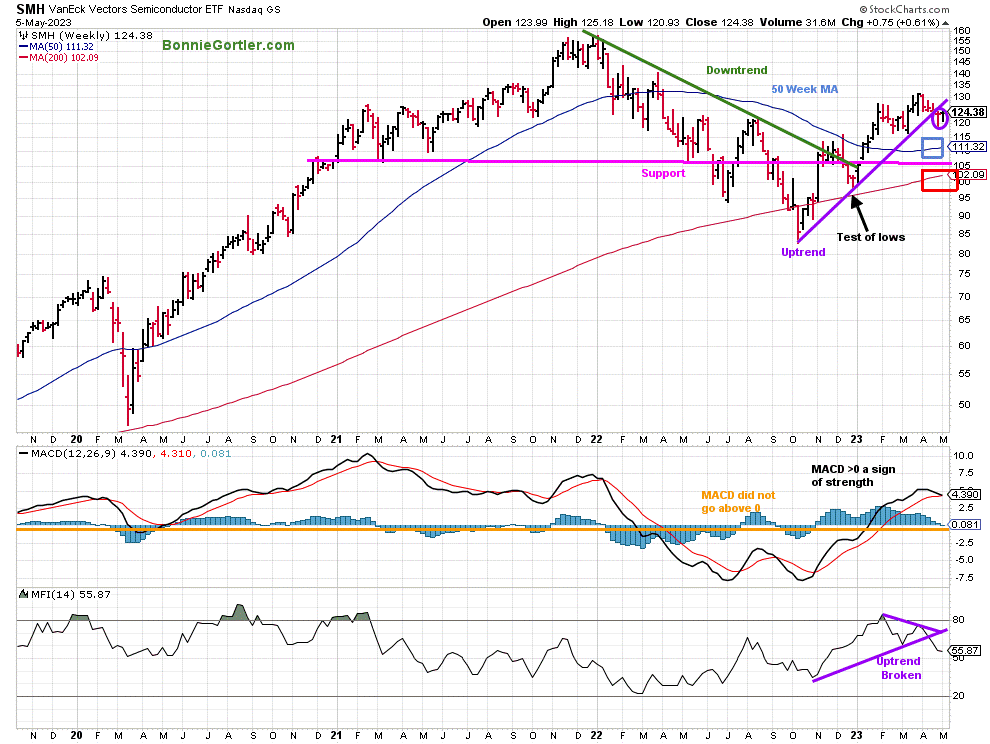
Figure 12: Weekly Vaneck Vectors Semiconductors (SMH) Price (Top) and 12-26-9 MACD (Middle) and Money Flow (Bottom)
050523 SMH Weekly
Source: Stockcharts.com
The top chart shows the Weekly Semiconductors (SMH) ETF, concentrated mainly in US-based Mega-Cap Semiconductors companies. SMH is a lead indicator for the market when investors are willing to take on increased risk and the opposite when the market is falling. SMH broke its downtrend in October 2022 (green line) and retraced the breakout in late December, testing the low with a pattern of higher lows and higher highs.
Last week SMH rose +0.61% for the week, helped by Friday’s gain of +2.13%, holding the previous week’s low after breaking below the uptrend from October (purple line) the prior week and above the 50 and 200-week MA (blue and red rectangle).
MACD, the middle chart, remains on a buy, above 0, now close to giving a sell. It’s unfavorable that momentum is weakening, and Money Flow (MFI) broke the October uptrend.
Many times, before a correction occurs, weakness in the SMH will be a clue that there will be a decline sooner than later. Watch SMH if it shows strength and SMH can lead the market higher or if it lags the overall market and is under selling pressure, which would be considered a short-term negative.
Figure 13: Daily Invesco QQQ Trust (QQQ) Price (Top) and 12-26-9 MACD (Middle) and Money Flow (Bottom)
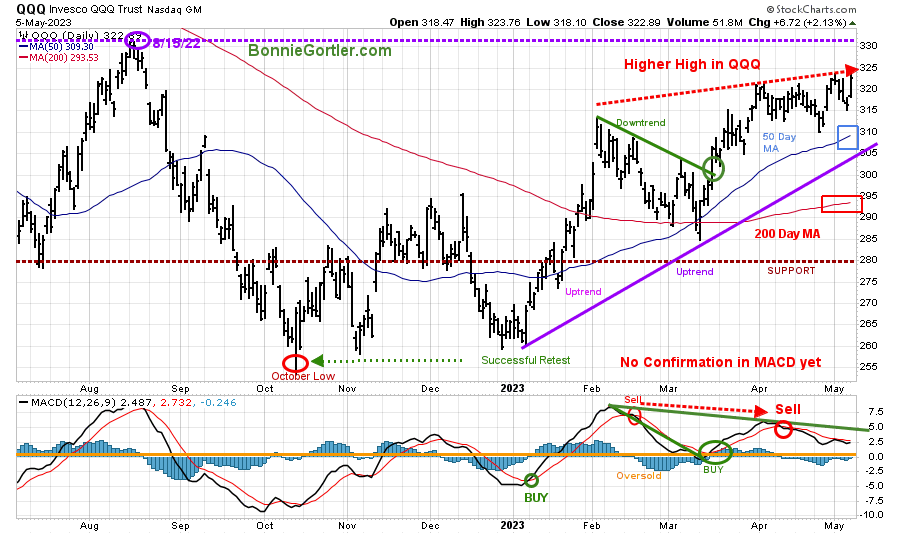
050523 QQQ Daily
Source: Stockcharts.com
The chart shows the daily Invesco QQQ, an exchange-traded fund based on the Nasdaq 100 Index. QQQ made a low in October 2022 (red circle), followed by a successful retest of the low in early January 2023.
The 2023 uptrend remains in effect but has diminishing momentum.
QQQ rose +0.10% last week, closing at 322.89, near the high for the week, up 2.13% on Friday following positive earnings from Apple (AAPL). It’s favorable, a sign of strength QQQ continues to close above the 50-Day Moving Average and the 200-Day Moving Average (red rectangle).
Resistance is at the old high, made in August 2022 (purple circle) at 331.16. Support is at 314.00, 310.00, 305.00, 293.00 and 280.00.
The middle chart is MACD (12, 26, 9), a measure of momentum remains on a sell with a negative divergence (higher high in price and lower high in MACD) and in a downtrend from February.
If QQQ continues the pattern of higher lows, the benefit of the doubt goes to the bulls. However, it’s prudent to be cautious with the Nasdaq Advance Decline Line, near its lows, showing a negative divergence (Figure 6 above).
Figure 14: Weekly Invesco QQQ Trust (QQQ) Price (Top) and 12-26-9 MACD (Bottom)
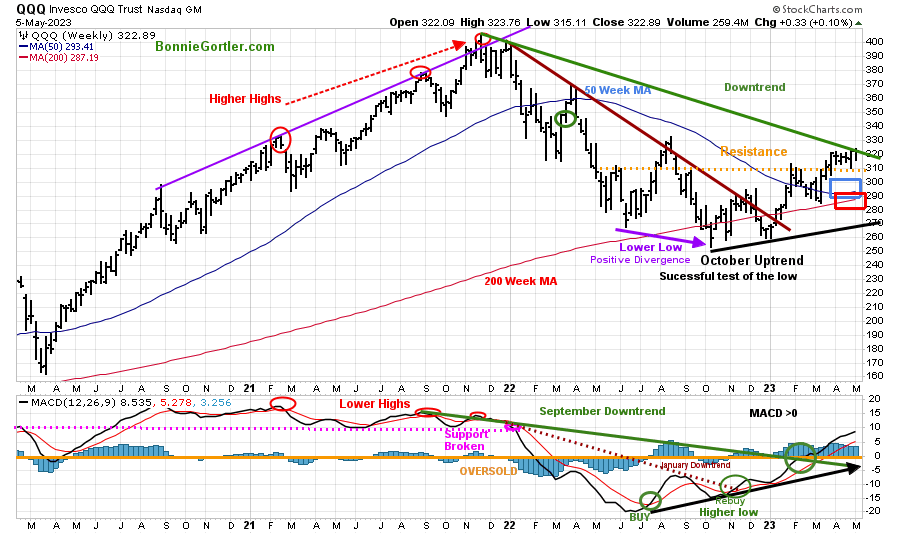
050523 QQQ Weekly
Source: Stockcharts.com
The intermediate trend remains up and is close to penetrating the 2022 price downtrend (green line top chart) above the August highs (pink circle).
Its positive QQQ continues to close above the 50 Week and 200 Week MA and remains above the old resistance at 310.00, acting as key support.
MACD remains above 0, rising after breaking the September momentum downtrend.
The bulls remain in control for now, but keep a close eye on Apple (APPL) and Microsoft (MSFT), the largest holdings in QQQ that comprise about 25% of QQQ, but if they stop rising and turn down, then expect downside pressure to follow.
Figure 15: The S&P 500 Index (SPY) Daily (Top) and 12-26-9 MACD (Bottom)
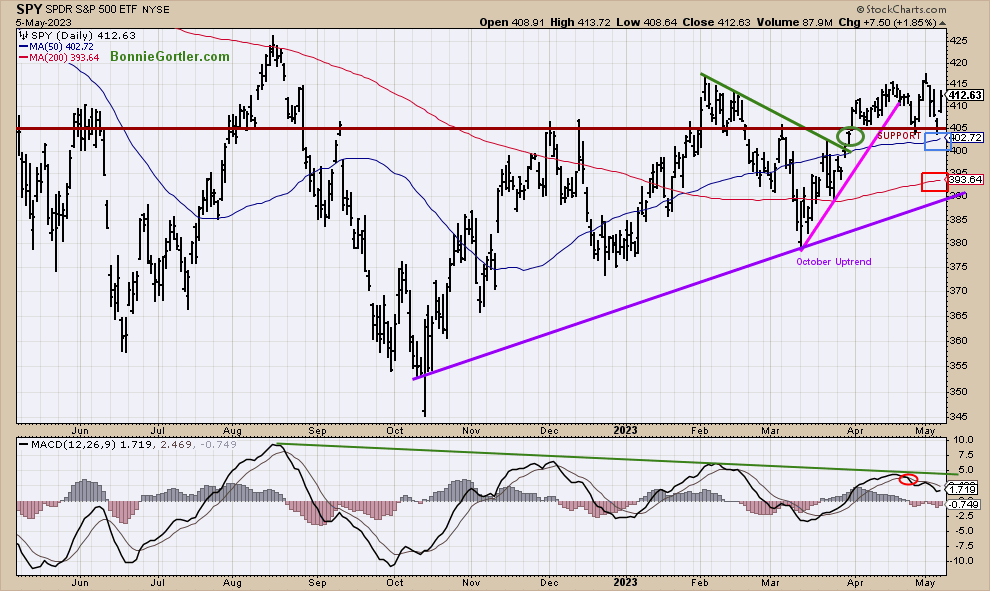
050523 SPY Daily
Source: Stockcharts.com
The S&P 500 (SPY) made a high in April 2023 and then turned lower.
SPY tested support at 405.00 (brown line) on Thursday, followed by a recovery of most of its weekly losses on Friday. For the week, SPY fell -0.79% remaining above the 50-Day Moving Average (blue rectangle) and above the 200-Day Moving Average (red rectangle), a sign of underlying strength.
MACD (bottom chart) remains on a sell as momentum has slowed since SPY has been in a trading range for the past few months.
Resistance is at 417.00 and 425.00. Support is at 405.00, 400.00, and 390.00.
Two closes below 390.00 would imply a test of the March low. On the other hand, two closes above 417.00 on the SPY could trip the stops and fuel the SPY higher towards 425.00, followed by 450.00.
Summing Up:
Mega Cap Tech continues to lead the Nasdaq higher in 2023 on poor market breadth, which is concerning. The major averages remain in a trading range, unable to penetrate overhead resistance. Daily momentum patterns in the major averages and S&P SPDR Sectors are weakening. Support levels have held so far, but if there is selling pressure in the Financial sector, Technology, and Semiconductors, the selling could intensify. With the Nasdaq Advance Decline Line near its lows, it’s wise to be more cautious than aggressive.
Remember to manage your risk, and your wealth will grow.
Let’s talk investing. You are invited to set up your Free 30-minute Wealth and Well-Being Strategy session by clicking here or emailing me at Bonnie@BonnieGortler.com. I would love to schedule a call and connect with you.
Disclaimer: Although the information is made with a sincere effort for accuracy, it is not guaranteed that the information provided is a statement of fact. Nor can we guarantee the results of following any of the recommendations made herein. Readers are encouraged to meet with their own advisors to consider the suitability of investments for their own particular situations and for determination of their own risk levels. Past performance does not guarantee any future results.


Create more wealth in your life
with these simple strategies.
As an added bonus you will also
receive BG’s Updates and Ezine

Discover how to quickly create more well-being in your life with these simple strategies.
As an added bonus you will also
receive BG’s Updates and Ezine

As an added bonus you will receive BG’s Updates and Ezine

All work listed on BonnieGortler.com is licensed under a Creative Commons Attribution - Noncommercial - No Derivative Works 3.0 Unported License.


Free Report:
Grow and Sustain Your Wealth
Discover how to grow your money with these easy, simple steps.

