

10 Simple Tips for Financial Well-Being
07/01/2026
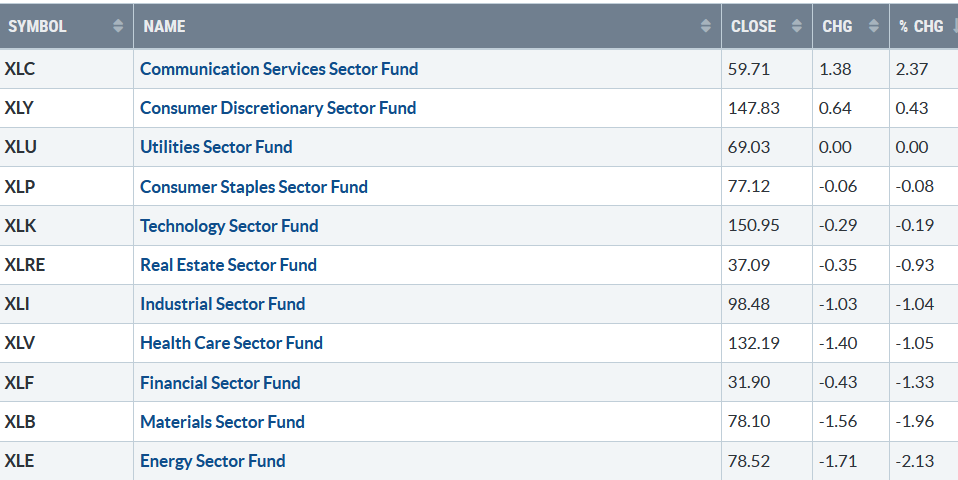
Sloppy market action last week, with only three of the eleven S&P SPDR sectors higher or flat. Communication Services (XLC) and Consumer Discretionary (XLY) were the best sectors, while Materials (XLB) and Energy (XLE) were the worst, with the SPDR S&P 500 ETF Trust (SPY) down -0.13%.
S&P SPDR Sector ETFs Performance Summary 5/05/23-05/12/23
05122323 SPDR Sectors
Source: Stockcharts.com
Listen to a video recap of the SPDR Sectors daily charts, including the technical indicators, MACD, RSI, MFI, and Bollinger Bands, as of the close on 5/12/23.
Watch Here: https://youtu.be/VMm9v74D3hM
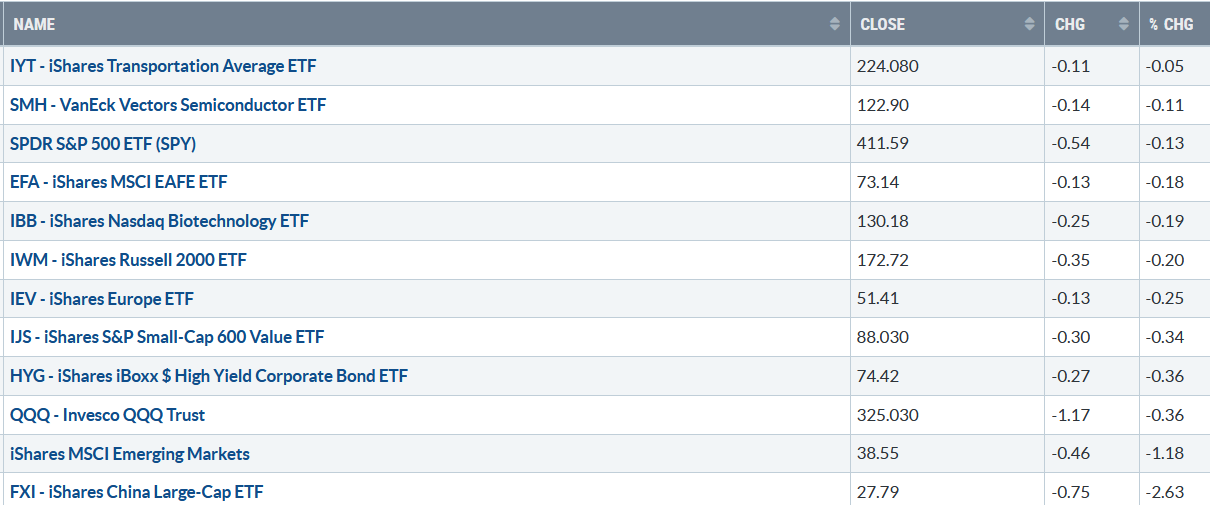
Figure 2: Bonnie’s ETFs Watch List Performance 5/05/23-05/12/23
051223 Week ETFs
Source: Stockcharts.com
No new trends developed last week, and little change in Transport, Semiconductors, and Biotechnology, while Emerging Markets and China were weak.
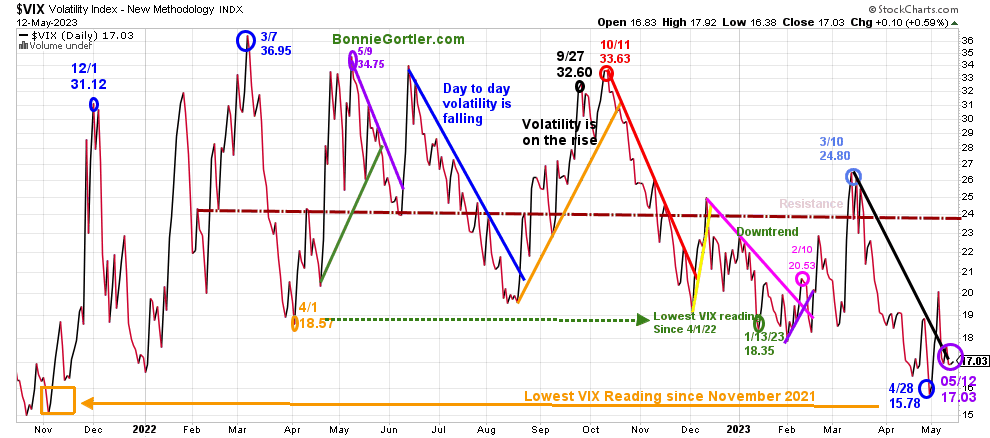
Figure 3: CBOE Volatility Index VIX
051223 VIX Daily
Source: Stockcharts.com
The CBOE Volatility Index (VIX), a measure of fear, traded above 20.00 for most of 2022, with a high at 36.95 on 3/7 (blue circle) and a low on 4/1/22 at 18.57. A new VIX low did not occur until 1/13/23 at 18.35 (green circle).
There was only a slight change in the Volatility Index (VIX) last week, with VIX (purple circle) closing at 17.13.
Watch for increasing daily fluctuations and a more severe pullback if VIX closes above 20.00 and then closes above 24.00.
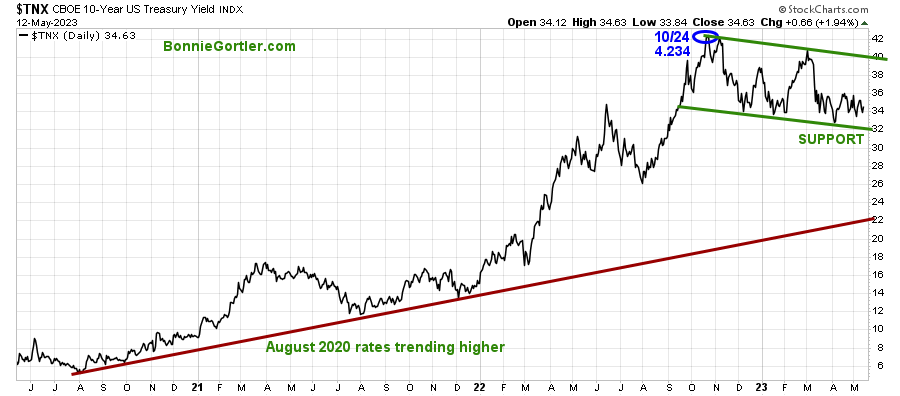
Figure 4: UST 10YR Bond Yields Daily
0512523 UST 10 Yr Bond Yields Daily
Source: Stockcharts.com
The 10-Year U.S. Treasury yields rose slightly last week, closing at 3.463%. Support remains at 3.20%, with resistance between 3.6% and 4.00%.
The major market averages finished mixed last week. The Dow fell all five days last week, down -1.11%, the S&P 500 down -0.29.%, and the Nasdaq gained +0.40%. The Russell 2000 Index fell -1.08% but stabilized above the March low.
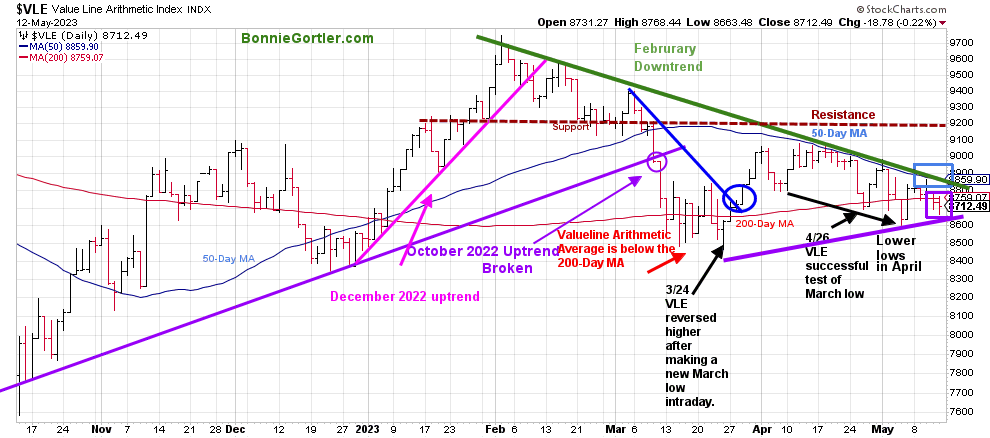
Figure 5: Value Line Arithmetic Average
05123 VLE Daily
Source: Stockcharts.com
The Value Line Arithmetic Index ($VLE) is a mix of approximately 1700 stocks. VLE broke the October 2022 uptrend in early March, headed lower, and on 3/24, bottomed and reversed higher.
The February downtrend (green line) remains -1.18% last week below the 200-Day MA and the 50-Day MA (blue rectangle), 8859.90 as of 5/12.
A negative pattern of lower lows formed in April. However, the decline held above the May low, which is a positive sign if it can hold.
Key resistance remains at 9200, and first support is at 8600. If the Value Line Index closes below the April 26 low and breaks the March uptrend (purple line), the odds will favor a decline toward the 3/24 low at 8466. A close below would be a warning a significant decline could begin.
Learn more about charting in my Free 33-minute training. Sign up here
Weak market breadth continues to be concerning.
Weekly market breadth was negative gain on the New York Stock Exchange Index (NYSE) and for the Nasdaq. The NYSE had 1189 advances and 1961 declines, with 140 new highs and 213 new lows. There were 2017 advances and 2884 declines on the Nasdaq, with 282 new highs and 502 new lows.
For a broad advance to start, you want to see an expansion in the weekly number of New Highs and New Lows to contract.
Poor market breadth puts the rally in Nasdaq in jeopardy of continuing
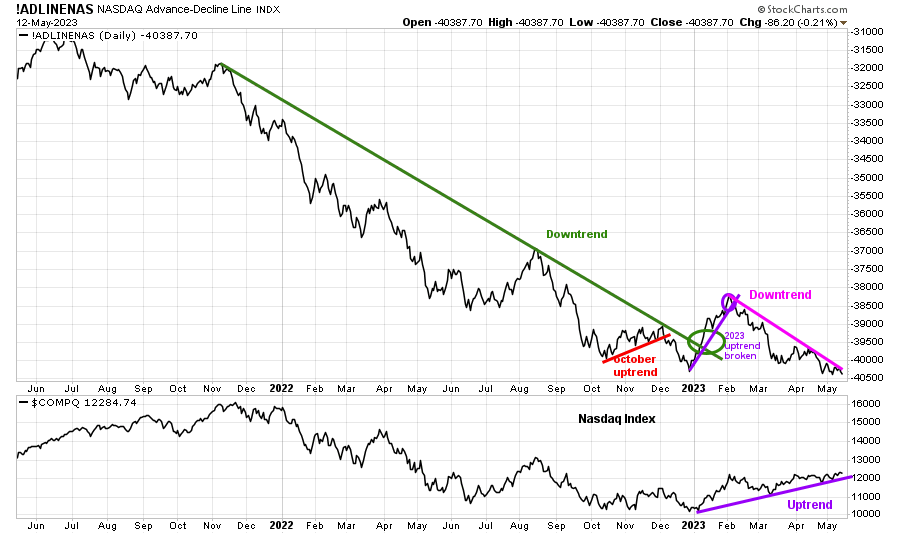
Figure 6: Nasdaq Advance Decline Line Daily (Top) and Nasdaq (Bottom)
051223 Daily Nasdaq Cumulative Advance-Decline Line and Nasdaq
Source: Stockcharts.com
The chart is the Nasdaq Daily Advance-Decline Line, a technical indicator that plots the difference between the number of advancing and declining stocks.
In January, the October 2022 downtrend was broken (green line). However, the improvement in market breadth was short-lived. It remains concerning the Nasdaq Advance-Decline line has deteriorated since February 2023, staying in a downtrend (pink line top chart) despite the uptrend and gains in the Nasdaq, which closed near its 2023 high (bottom chart).
For further confirmation of continued highs in the near term, the downtrend needs to break with an expansion of net advances, more daily new highs, and fewer new lows. On the other hand, if there are more declines than advances and an increase in new lows and fewer new highs, it would imply further weakness in the broad market.
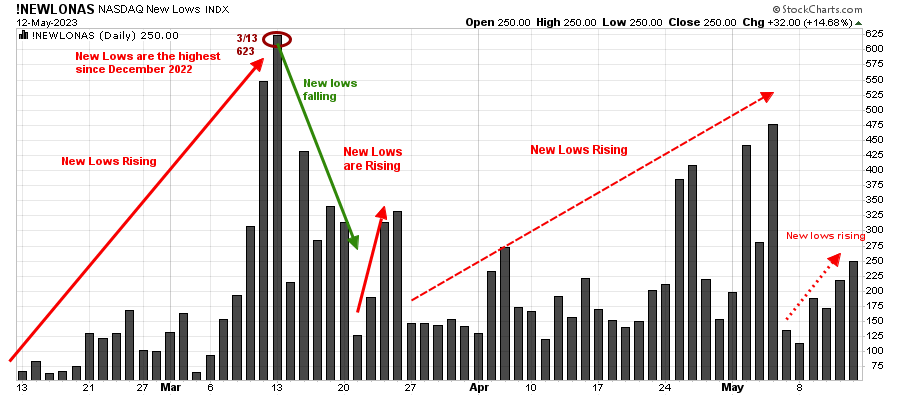
Figure 7: Nasdaq New Lows
051323 Nasdaq New Lows Daily
Source: Stockcharts.com
Nasdaq New Lows have increased in May (red dotted line on the right) but stayed below 475, which is a plus. A rise above would be negative and increase the odds of a pullback.
On the other hand, If Nasdaq New Lows contracts immediately, it would be positive in the short term,
Learn about coaching with Bonnie. Ask questions. Discover more about the coaching processes in this 15-minute call by signing up here or emailing me at Bonnie@BonnieGortler.com. I would love to schedule a call and connect with you.
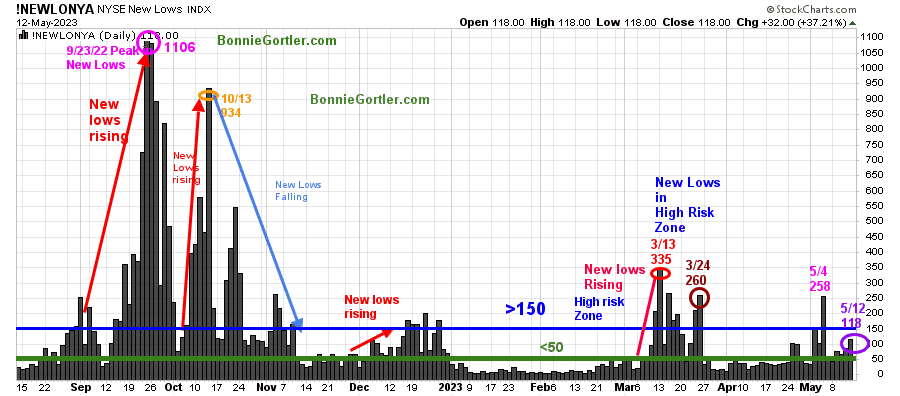
Figure 8: Daily New York Stock Exchange (NYSE) New Lows
051223 NYSE New Lows Daily
Source: Stockcharts.com
Watching New Lows on the New York Stock Exchange is a simple technical tool that helps awareness of the immediate trend’s direction.
New lows warned of a potential sharp pullback, high volatility, and “panic selling” for most of 2022, closing above 150. The peak reading was 9/23/22 when New Lows made a new high of 1106 (pink circle), and New Lows expanded to their highest level in 2023 on 3/13 (red circle) to 335, which have not been taken out in late March or during the weakness in early May.
New Lows inched up last week, closing at 118 (purple circle) below the high-risk zone of >150 (blue horizontal line), but could not stay in the lower-risk zone between 25 and 50.
I want New Lows to fall next week to the lowest risk zone below 25, stay there consistently, and see a quick increase of the New Highs to more than 203 for a sign of a potential broadening rally to begin.
On the other hand, two closes above 150 New Lows would imply an increased risk of a decline forthcoming.
Learn more about the significance of New Lows in my book, Journey to Wealth, published on Amazon. If you would like a preview, get a free chapter here.
Small Caps downtrend remains.
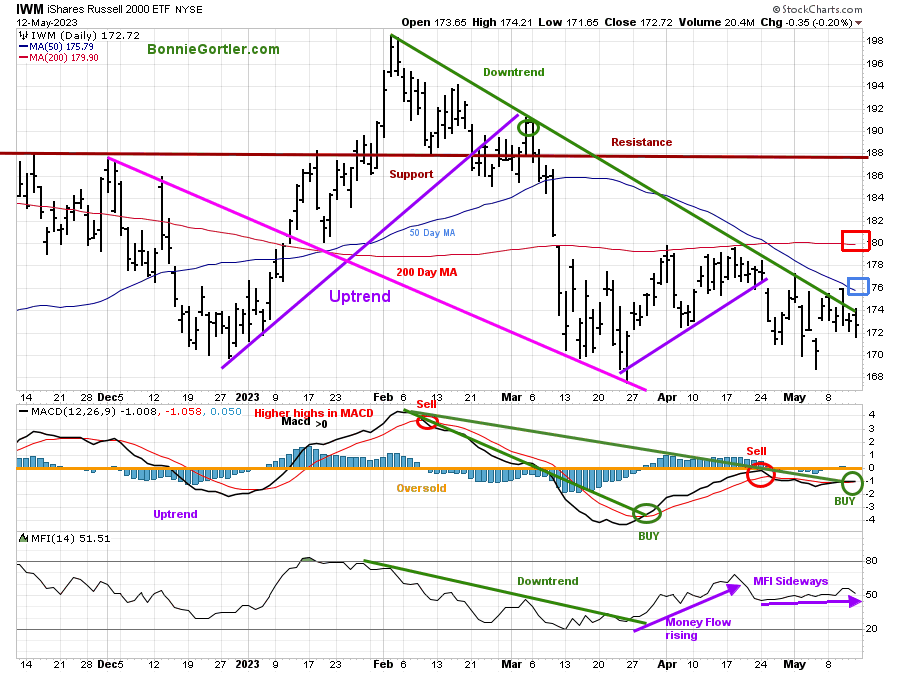
Figure 9: Daily iShares Russell 2000 (IWM) Price (Top) and 12-26-9 MACD (Middle and Money Flow (Bottom)
051223 IWM Daily
Source: Stockcharts.com
The top chart is the daily iShares Russell 2000 Index ETF (IWM), the benchmark for small-cap stocks, with a 50-Day Moving Average (MA) (blue line) and 200-Day Moving Average (MA) (red line) that traders watch and use to define trends.
The February downtrend in IWM remains (solid green line) and is weaker than the major averages. IWM closed below the 50-Day MA (blue rectangle) and 200-Day MA (red rectangle), implying underlying weakness.
IWM closed at 172.72, down -0.99% on continued selling and volatility in Regional Banks.
Resistance is at 178.00, 180.00, and 188.00, where IWM broke down in March. Support is at 169.00 and 166.00.
MACD is on a buy but not showing great momentum, with Money Flow (lower chart) falling. However, I would be more confident in a short-term rally if IWM can overcome resistance at 180.00 and MFI rises above the recent high.
Penetration of Resistance
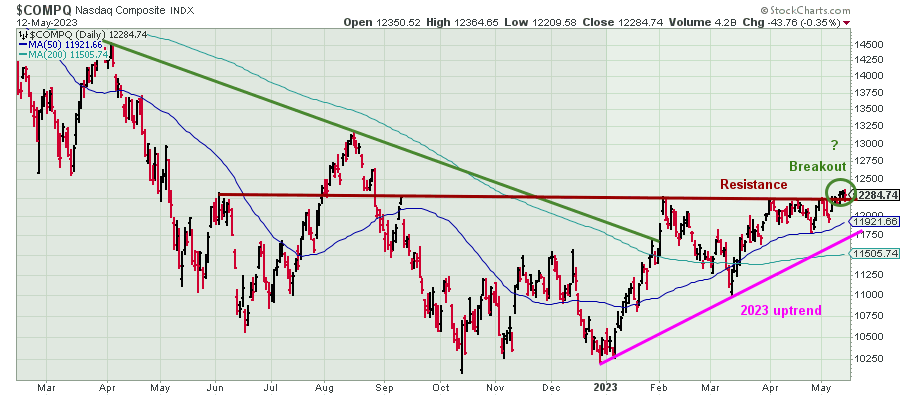
Figure 10: Nasdaq Composite
051223 Nasdaq Composite Daily
Source: Stockcharts.com
Nasdaq penetrated resistance at 12300 but stalled, closing at 12284.74, and a close above 12300 for two days could push the Nasdaq Index toward the August highs.
Overhead Resistance Remains
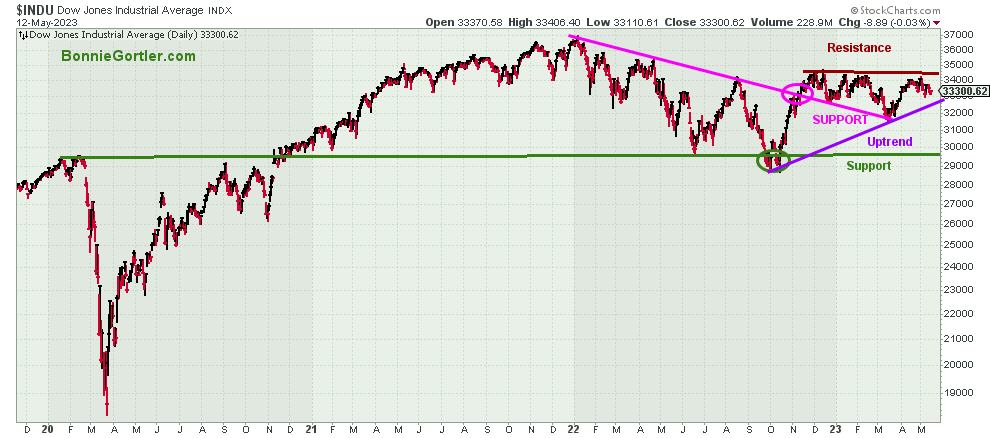
Figure 11: Dow Jones Industrial Average
051223 Dow Jones Industrial Daily
Source: Stockcharts.com
The Dow Industrials closed lower by -1.11% at 33300.38, below resistance at 34250, and a close above for two days could fuel investors to go bargain hunting as the Dow has underperformed in 2023.
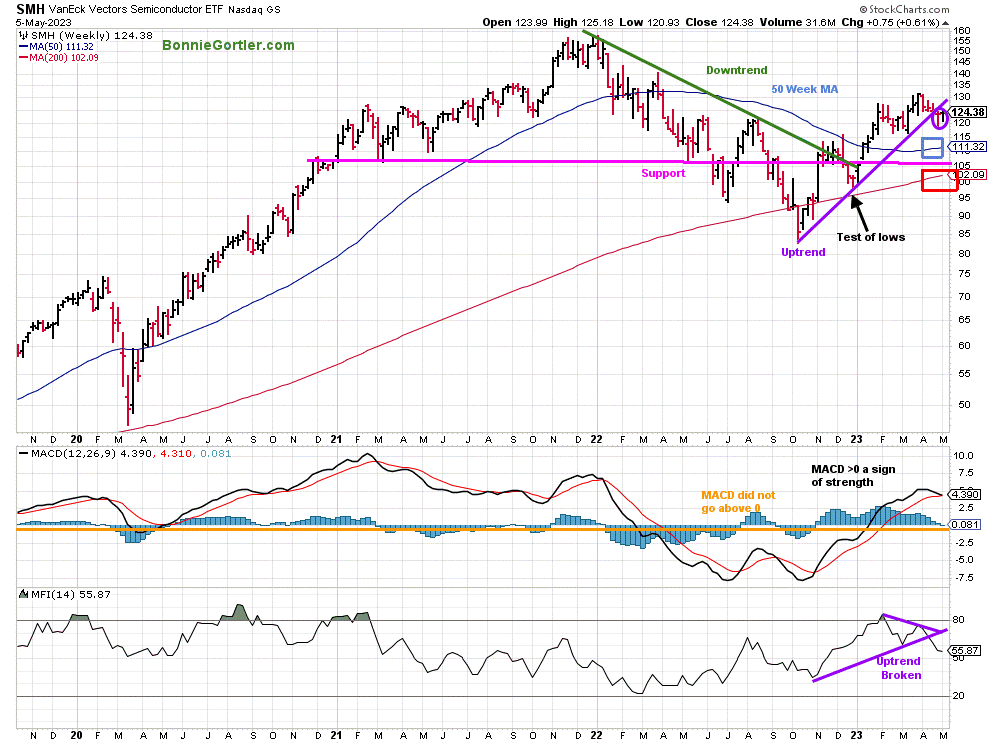
Figure 12: Weekly Vaneck Vectors Semiconductors (SMH) Price (Top) and 12-26-9 MACD (Middle) and Money Flow (Bottom)
050523 SMH Weekly
Source: Stockcharts.com
The top chart shows the Weekly Semiconductors (SMH) ETF, concentrated mainly in US-based Mega-Cap Semiconductors companies. SMH tends to be a lead indicator for the market when investors are willing to take on increased risk and the opposite when the market is falling. SMH broke its downtrend in October 2022 (green line) and retraced the breakout in late December and March.
Last week SMH was weak, falling -1.19%. It’s positive that SMH has held the previous week’s low and closed above the 50 and 200-week MA (blue and red rectangle), but not enough strength to get above the uptrend from October (purple line) or above the March high.
MACD, (the middle chart) is on a sell with momentum weakening, breaking the uptrend from October.
Money Flow (MFI) broke the October uptrend in April and continues to move lower.
Many times, before a correction occurs, weakness in the SMH is a clue that there will be a decline forthcoming. With MACD on a sell and Money Flow still falling, it’s wise to be more cautious than aggressive now.
SMH continues to weaken based on Relative Strength vs. QQQ
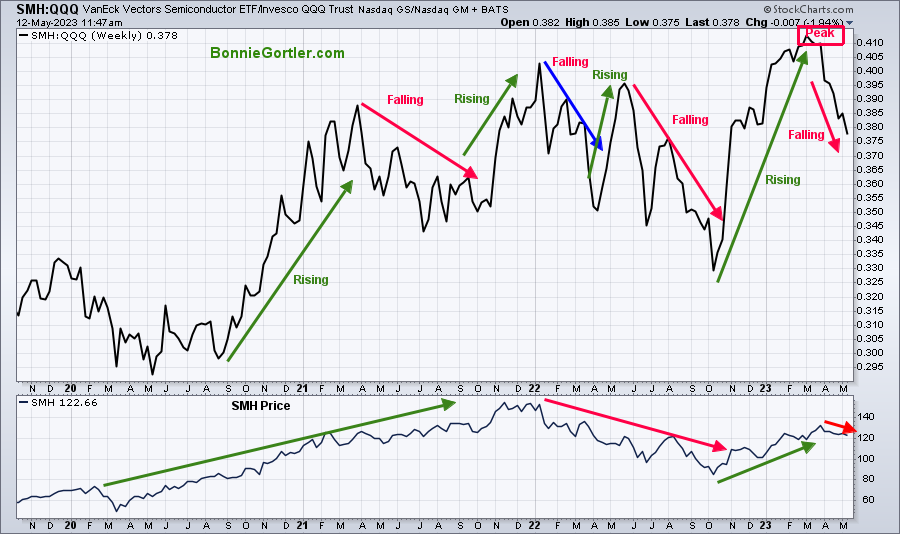
Figure 13: VanEck Vectors Semiconductor/Invesco QQQ Trust (SMH/QQQ) Weekly Relative Strength Index Ratio
SMH QQQ Weekly Relative Strength Index Ratio
Source: Stockcharts.com
The top part of the chart is the weekly VanEck Vectors Semiconductor/Invesco QQQ Trust (SMH/QQQ) Index Ratio. A rising line means the SMH is stronger, and if falling, the QQQ is stronger.
The SMH/QQQ ratio peaked in March and continues to fall, for a sign of strength to begin in Semiconductors, which would likely help the overall market.
I would like to see SMH begin next week to outperform QQQ by a minimum of 3 to 1. However, further weakness in SMH would be a short-term negative.
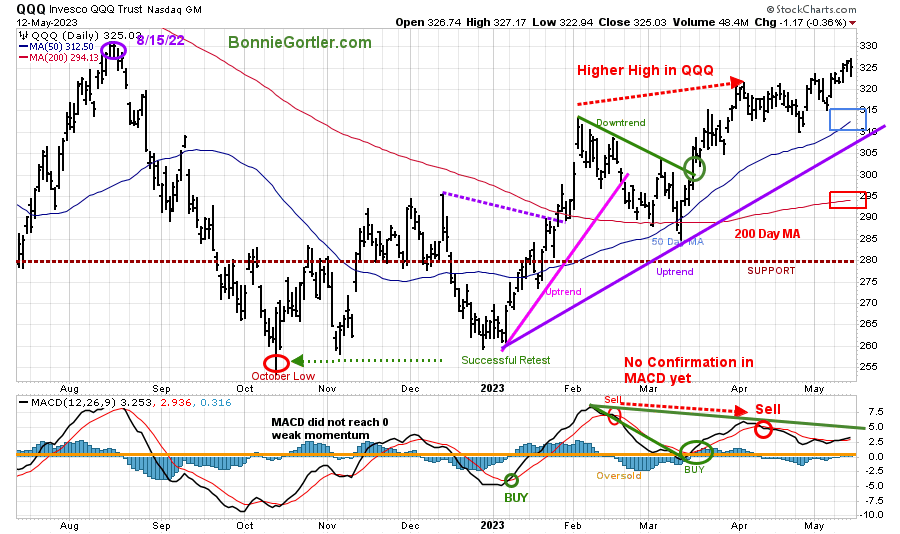
Figure 14: Daily Invesco QQQ Trust (QQQ) Price (Top) and 12-26-9 MACD (Middle) and Money Flow (Bottom)
051223 QQQ Daily
Source: Stockcharts.com
The chart shows the daily Invesco QQQ, an exchange-traded fund based on the Nasdaq 100 Index. QQQ made a low in October 2022 (red circle), followed by a successful retest of the low in early January 2023.
The 2023 uptrend remains in effect but has had diminishing momentum since February.
QQQ rose +0.66% last week, closing at 325.03, near the upper range for the week and breaking the downtrend from late December 2022. It’s a sign of strength QQQ continues to close above the 50-Day Moving Average and the 200-Day Moving Average (red rectangle).
Resistance is at the old high, made in August 2022 (purple circle) at 331.16. Support is at 320.00, 310.00, and 295.00.
The bottom chart is MACD (12, 26, 9), a measure of momentum remains on a sell with weakening momentum since February.
If QQQ continues the pattern of higher lows, the benefit of the doubt goes to the bulls. However, it’s prudent to be cautious with the Nasdaq Advance Decline Line near its lows (Figure 6 above).
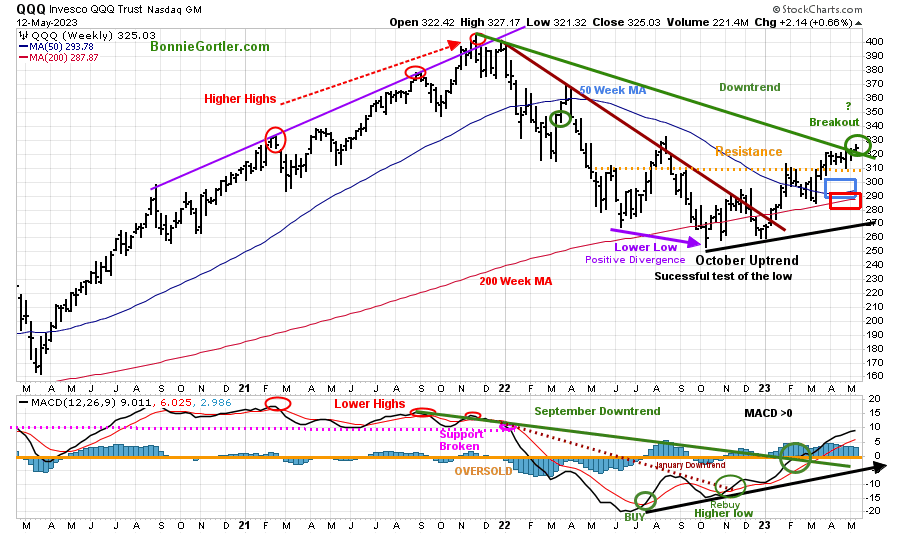
Figure 15: Weekly Invesco QQQ Trust (QQQ) Price (Top) and 12-26-9 MACD (Bottom)
051223 QQQ Weekly
Source: Stockcharts.com
The intermediate trend remains up.
Last week QQQ broke the 2022 price downtrend (green line top chart).
Its positive QQQ continues its pattern of higher lows and higher highs, closing above the 50 and 200 Week MA and remaining above the old resistance at 310.00, acting as key support.
Its positive MACD remains above 0, rising after breaking the September momentum downtrend.
The bulls remain in control for now, but keep a close eye on Apple (APPL) and Microsoft (MSFT), the largest holdings in QQQ that comprise about 25% of QQQ, if they stop rising and turn down, then expect downside pressure to follow.
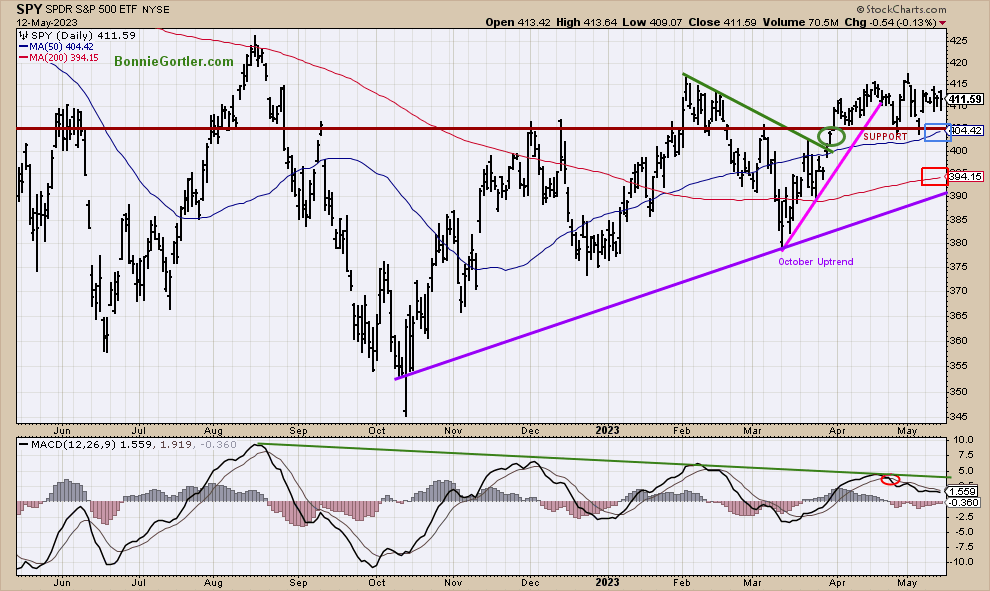
Figure 16: The S&P 500 Index (SPY) Daily (Top) and 12-26-9 MACD (Bottom)
051223 SPY Daily
Source: Stockcharts.com
The S&P 500 (SPY) made a high in April 2023 and then turned lower.
SPY fell -0.25% remaining above the 50-Day Moving Average (blue rectangle) and above the 200-Day Moving Average (red rectangle), a sign of underlying strength.
MACD (bottom chart) remains on a sell as momentum has slowed since SPY has been in a trading range for the past few months.
Resistance is at 417.00 and 425.00. Support is at 405.00, 400.00, and 390.00.
Two closes below 390.00 would imply a test of the March low. On the other hand, two closes above 417.00 on the SPY could trip the stops and fuel the SPY higher towards 425.00, followed by 450.00.
Figure 17: Daily SPDR S&P 500 ETF Trust (SPY), (Top) and below SPDR S&P MidCap 400 (MDY), iShares Core S&P Small-Cap (IJR), and iShares Micro-Cap (IWC) ETF
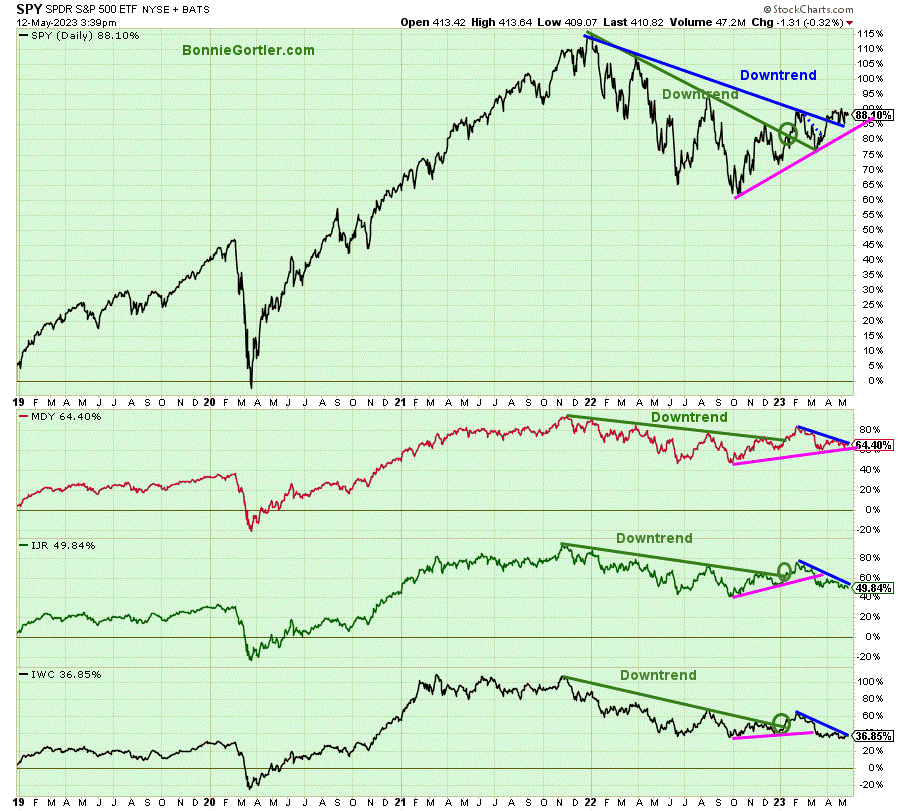
051223 SPY MDY, IJR, and IWC ETF Daily
The above chart is The SPDR S&P 500 ETF Trust (SPY), SPDR S&P MidCap 400 ETF (MDY), iShares Core S&P Small-Cap (IJR), and iShares Micro-Cap (IWC).
All four ETFs broke the longer-term downtrends earlier this year (green lines), but the rally has been narrow in 2023, with SPY the only one trading above the February downtrend (blue line).
For confirmation, the advance will broaden, and strength is needed in MDY, IJR, and IWC to confirm the breakout in SPY. Otherwise, the S&P 500 will likely falter, and risk rises a short-term decline will occur.
Summing Up:
The major averages remain in a trading range, unable to penetrate overhead resistance. Weak market breadth continues to be concerning. Mega Cap Tech continues to lead the Nasdaq higher in 2023. For a broad advance, you want to see market breadth improve by the number of New Highs expanding and New Lows contracting on the New York Index and Nasdaq. Continue to be more cautious than aggressive until leadership in Small and Midcap sectors and Semiconductors shows strength to confirm higher prices.
Remember to manage your risk, and your wealth will grow.
Let’s talk investing. You are invited to set up your Free 30-minute Wealth and Well-Being Strategy session by clicking here or emailing me at Bonnie@BonnieGortler.com. I would love to schedule a call and connect with you.
Disclaimer: Although the information is made with a sincere effort for accuracy, it is not guaranteed that the information provided is a statement of fact. Nor can we guarantee the results of following any of the recommendations made herein. Readers are encouraged to meet with their own advisors to consider the suitability of investments for their own particular situations and for determination of their own risk levels. Past performance does not guarantee any future results.


Create more wealth in your life
with these simple strategies.
As an added bonus you will also
receive BG’s Updates and Ezine

Discover how to quickly create more well-being in your life with these simple strategies.
As an added bonus you will also
receive BG’s Updates and Ezine

As an added bonus you will receive BG’s Updates and Ezine

All work listed on BonnieGortler.com is licensed under a Creative Commons Attribution - Noncommercial - No Derivative Works 3.0 Unported License.


Free Report:
Grow and Sustain Your Wealth
Discover how to grow your money with these easy, simple steps.

