

10 Simple Tips for Financial Well-Being
07/01/2026
The last week of the ugly September ended with only three S&P SPDR sectors finishing higher. Energy (XLE) and Materials (XLB) were the best sectors, while Consumer Staples (XLP) and Utilities (XLU) were the weakest. The SPDR S&P 500 ETF Trust (SPY) was down -0.68%.
S&P SPDR Sector ETFs Performance Summary 9/22/23-9/29/23
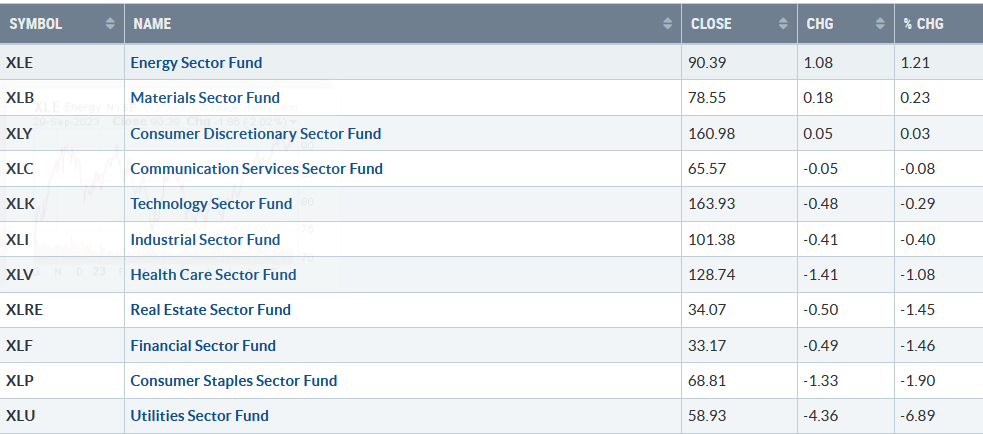
Source: Stockcharts.com
Figure 2: Bonnie’s ETFs Watch List Performance Summary 9/22/23-9/29/23
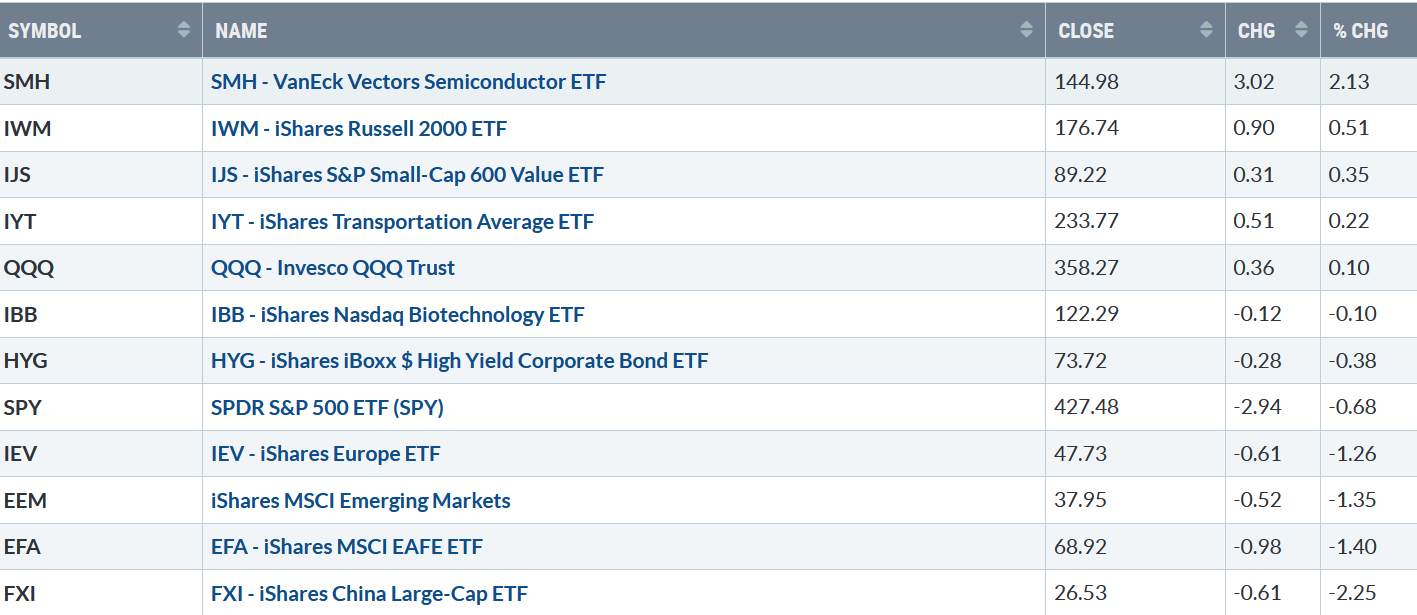
092923 Week ETFs
Source: Stockcharts.com
Small Cap Value and Growth stabilized, while the International markets lagged last week and were much weaker than the U.S. market.
Where do we go from here?
Figure 3: CBOE Volatility Index VIX
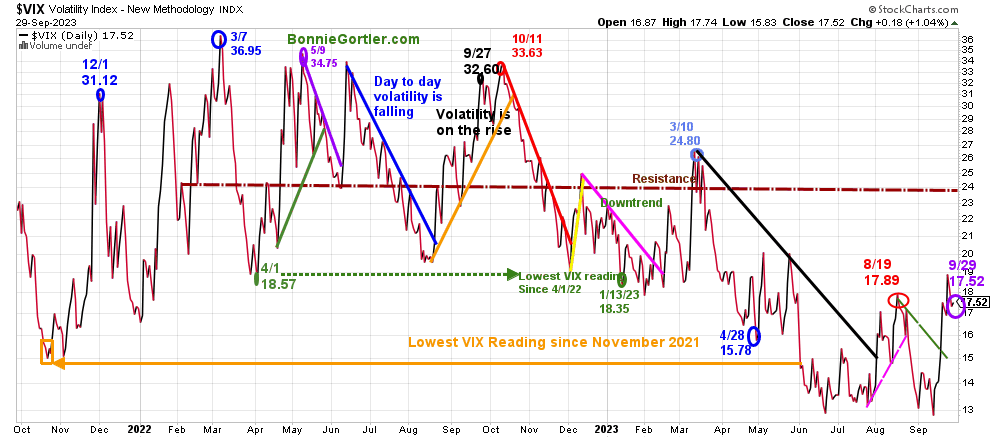
092923 VIX Daily
Source: Stockcharts.com
The CBOE Volatility Index (VIX), a measure of fear, traded above 20.00 for most of 2022, with a high at 36.95 on 3/7 (blue circle). A new VIX low did not occur until 1/13/23 at 18.35 (green circle) after peaking in October 2022 at 33.63 (red circle).
VIX rose slightly, closing at 17.52 (purple circle), below the week’s high of 18.94, and below the 8/19/23 high at 17.89 (red circle). Be alert to a close above 20.00, implying wider daily intraday swings and increased risk.
Higher Yields pressure equities.
Figure 4: UST 10YR Bond Yields Daily
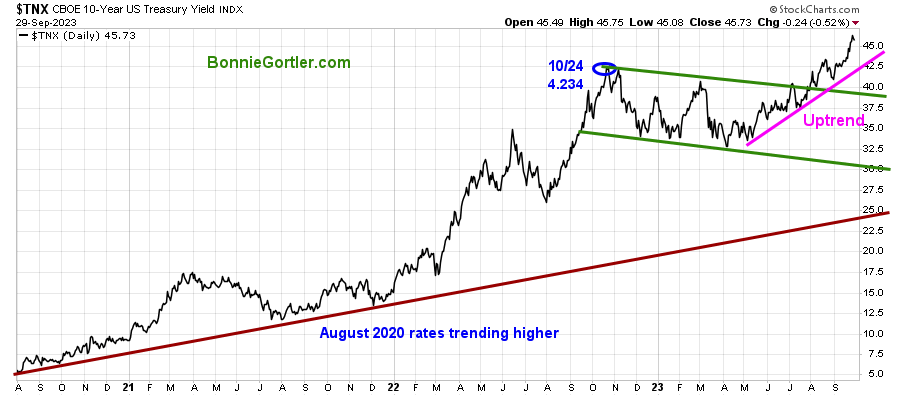
092923 UST 10 Yr Bond Yields Daily
Source: Stockcharts.com
The 10-year U.S. Treasury yields continued to trend higher, closing at 4.573%, remaining in the May uptrend (pink line). Further rise in yields is likely to result in continued pressure on equities.
Last week, the major market averages were mixed. The Dow fell -1.34%, the S&P 500 was down -0.74%, Nasdaq was up +0.06%, while the Russell 2000 Index rose +0.48%, the strongest market average, a positive sign for potential follow-through this week.
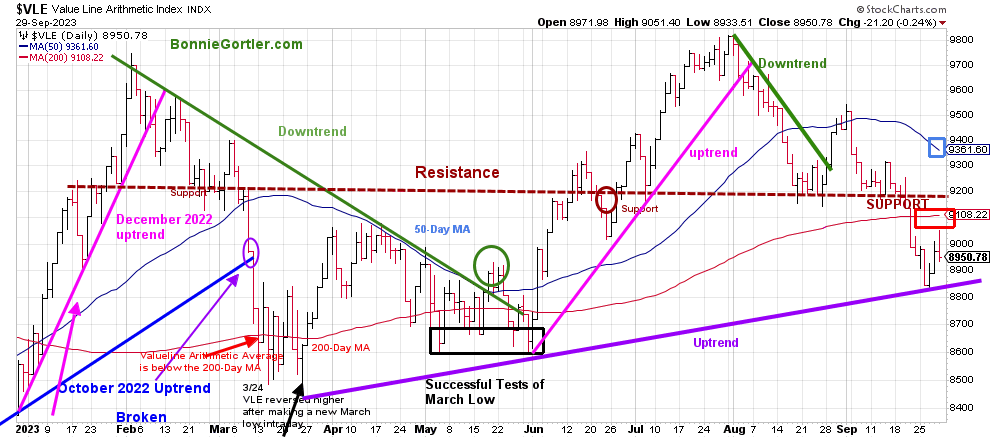
Figure 5: Value Line Arithmetic Average
092923 VLE Daily
Source: Stockcharts.com
The Value Line Arithmetic Index ($VLE) is a mix of approximately 1700 stocks. VLE broke the October 2022 uptrend in early March (blue line), and April, May, and June had successful tests of the March low.
VLE was down only -0.06% after testing the March uptrend but closed below the 200-day MA (red rectangle) and 50-day MA (blue rectangle), an underlying sign of weakness.
Resistance remains at 9100, 9200, and 9400. Support remains at 8800.
For now, the uptrend is intact from March (purple line). However, two closes below 8800 would break the uptrend and be a warning the decline may accelerate further.
Do you want to go deeper into charting? Learn more in the comfort of your home today with my Free 33-minute Training, Charting Strategies to Cut Risk and Trade with the Trend. Sign up here
Weekly market breadth was negative on the New York Stock Exchange Index (NYSE) and for the Nasdaq. The NYSE had 1238 advances and 1796 declines, with 102 new highs and 467 new lows. There were 2173 advances and 2533 declines on the Nasdaq, with 131 new highs and 803 new lows.
Market breadth remains concerning, with more stocks making weekly New Lows and fewer stocks making weekly New Highs on the NYSE and Nasdaq. Breadth needs to improve for a broad rally to occur and be sustainable.
If you want to go more in-depth with charts, I invite you to join my FB group Wealth Through Market Charts.
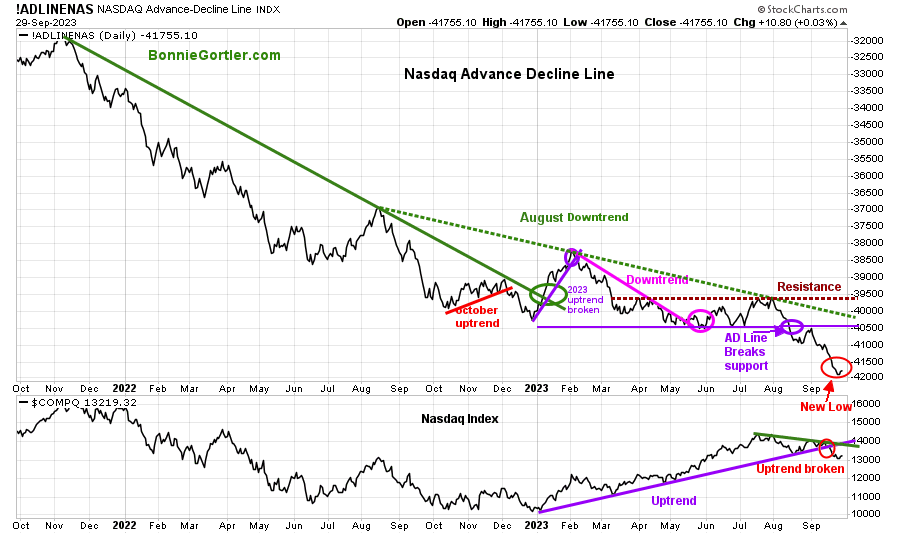
Nasdaq breadth remains worrisome
Figure 6: Nasdaq Advance Decline Line Daily (Top) and Nasdaq (Bottom)
092923 Daily Nasdaq Cumulative Advance-Decline Line
Source: Stockcharts.com
The top chart is the Nasdaq Daily Advance-Decline Line, a technical indicator that plots the difference between the number of advancing and declining stocks. In January 2023, the October 2022 downtrend was broken (solid green line) but quickly reversed lower in February 2023, when most of the stock participation was the large Mega Cap Stocks.
The AD-Line (top chart) broke support (purple circle) in August and remains weak, continuing to make new lows in 2023. It remains negative that breadth remains below support (purple line) and in a downtrend from August (green dotted line).
The Nasdaq (lower chart) had a slight turn-up last week but no real strength to get excited about.
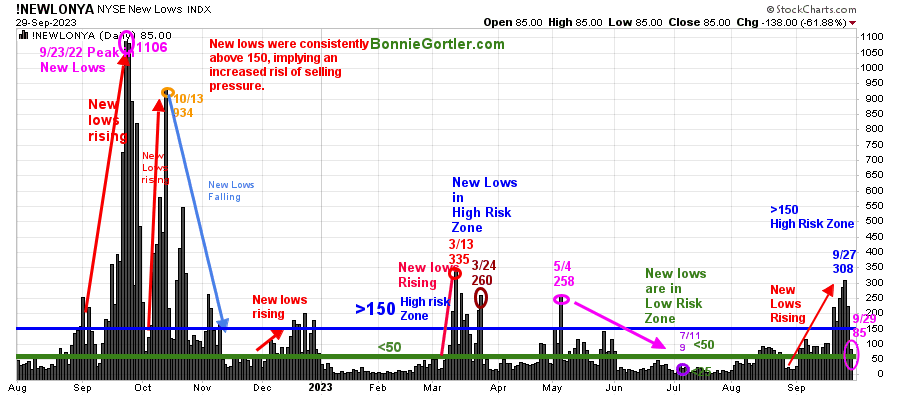
Figure 7: Daily New York Stock Exchange (NYSE) New Lows
092923 NYSE New Lows Daily
Source: Stockcharts.com
Watching New Lows on the New York Stock Exchange is a simple technical tool that helps awareness of the immediate trend’s direction. New lows warned of a potential sharp pullback, high volatility, and “panic selling” for most of 2022, closing above 150. The peak reading was 9/23/22 when New Lows made a new high of 1106 (pink circle), and New Lows expanded to their highest level in 2023 on 3/13/23 (red circle) to 335.
New Lows rose in September (red arrow on the right), reaching the high-risk zone early in the week, peaking at 308 on 9/27. However, on 9/29, New lows contracted, a positive sign, closing at 85 (pink circle), now below the high-risk zone but not yet in the low-risk zone.
It will be favorable if the New Lows remain below 150 and contract towards 50, ultimately closing below 25 (the lowest risk zone), implying less selling pressure.
On the other hand, if New Lows rise above 150, it will imply an increased risk of a short-term decline.
Learn more about the significance of New Lows in my book, Journey to Wealth, published on Amazon. If you would like a preview, get a free chapter here.
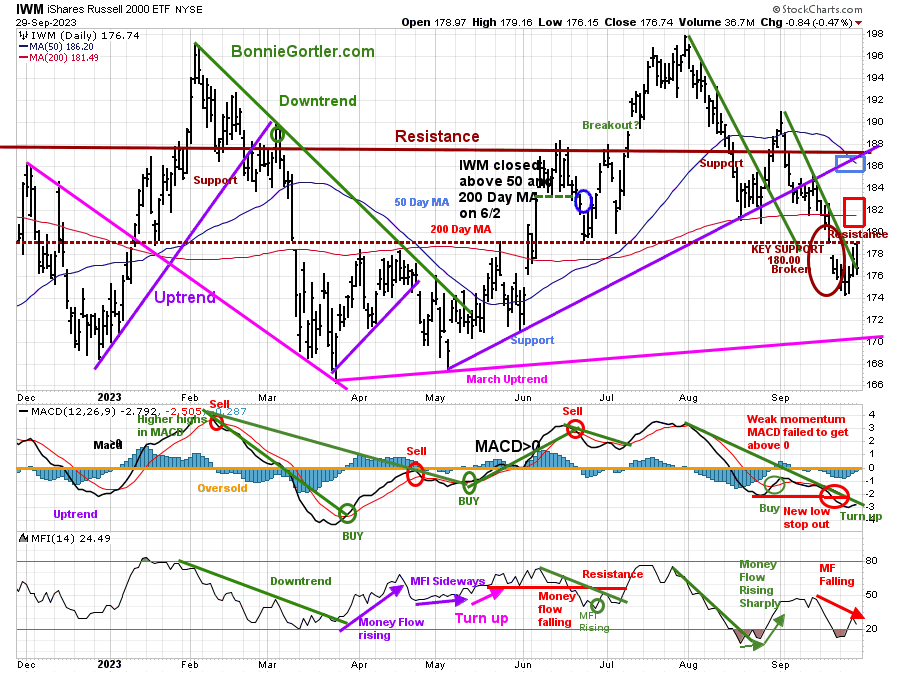
Figure 8: Daily iShares Russell 2000 (IWM) Price (Top) and 12-26-9 MACD (Middle and Money Flow (Bottom)
092923 IWM Daily
Source: Stockcharts.com
The top chart is the daily iShares Russell 2000 Index ETF (IWM), the benchmark for small-cap stocks, with a 50-Day Moving Average (MA) (blue line) and 200-Day Moving Average (MA) (red line) that traders watch and use to define trends.
IWM showed strength while the other averages moved lower, gaining +0.51%, closing at 176.74, remaining below the 200-day MA (blue rectangle) and the 50-day MA.
Support is at 174.00 and 170.00. Resistance is at 180.00,184.00, and 188.00.
MACD (middle chart) is on a sell after making a lower low but is now rising and close to generating a buy signal, and bears watching for a trend change.
Money Flow (lower chart) is falling after reaching an oversold condition below 20.
In sum, the downside momentum has subsided. However, there is the risk of extending the decline if IWM closes below 170.00. On the other hand, a close above 180.00 is likely to lead to another rally toward 184.00 and 188.00.
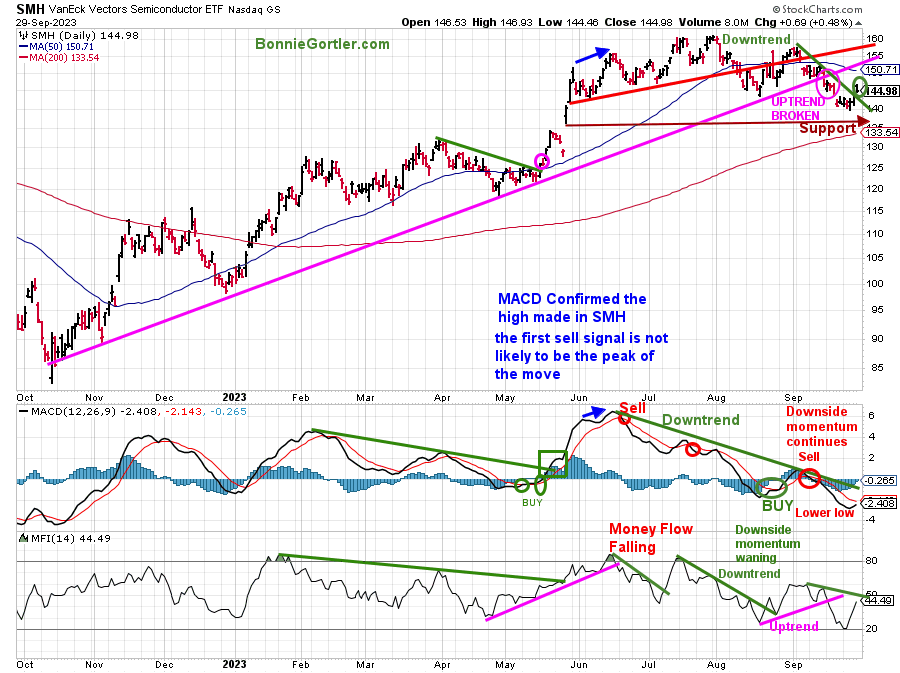
Figure 9: Daily Semiconductors (SMH) (Top) and 12-26-9 MACD (Middle and Money Flow (Bottom)
092923 SMH Daily
Source: Stockcharts.com
The top chart shows the Daily Semiconductors (SMH) ETF, concentrated mainly in US-based Mega-Cap Semiconductors companies. SMH tends to be a lead indicator for the market when investors are willing to take on increased risk and the opposite when the market is falling.
Semiconductors (SMH) rose +2.13%, one of the best areas last week, a positive sign for the near term.
Support is at 140.00 and 133.00. Resistance is at 147.00, 151.00, and 160.00.
SMH broke the 2022 October uptrend (bottom pink line). However, last week’s rise in SMH remains below where the uptrend from October broke down, implying the rally is nothing more than a relief rally. However, a close above 151.00 followed by above 160.00 would likely cause the bears to close their shorts.
MACD (middle chart) remains on a sell. However, downside momentum slowed as MACD turned up after making a lower low the previous week and in striking distance of a MACD buy. Money Flow (lower chart) broke its uptrend from August (pink line) and is rising and not far from breaking the September downtrend.
In Sum
It’s positive SMH turned up last week and was stronger than the QQQ. However, MACD made a new momentum low in September. Therefore, the risk of a retest of last week’s low may occur, and a safer buying opportunity potentially in 2-5 weeks.
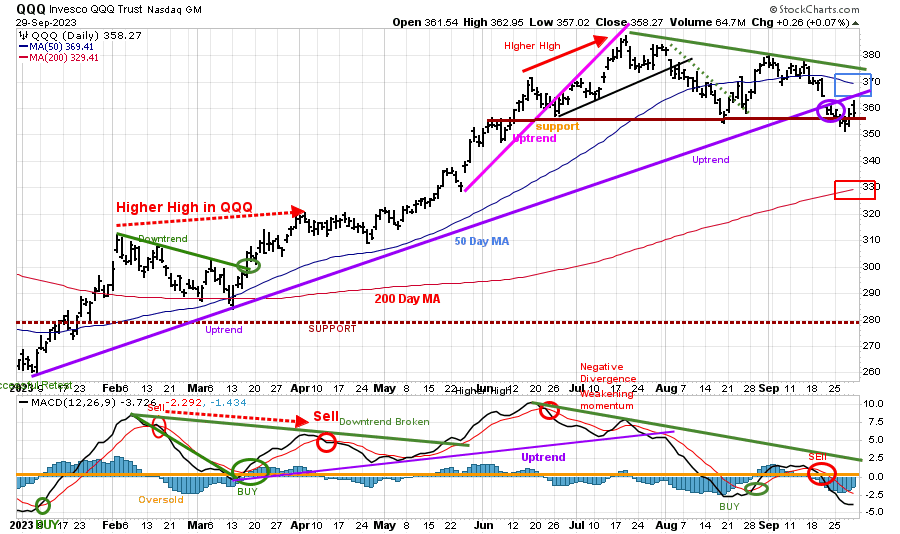
Figure 10: Daily Invesco QQQ Trust (QQQ) Price (Top) and 12-26-9 MACD (Middle) and Money Flow (Bottom)
092923 QQQ Daily
Source: Stockcharts.com
The chart shows the daily Invesco QQQ, an exchange-traded fund based on the Nasdaq 100 Index. QQQ made a low in October 2022 (red circle), followed by a successful retest of the low in early January 2023 and the start of an uptrend.
QQQ broke its 2023 uptrend (purple circle) after a few attempts at the July high.
Last week, QQQ gained only +0.10%, closing at 358.27, remaining below the 50-day Moving Average (blue rectangle) and above the 200-day Moving Average (red rectangle), which is positive.
Support is 355.00 and 335.00, with resistance at 365.00, 375.00, and 380.00.
The bottom chart is MACD (12, 26, 9) is on a sell, failing to break the downtrend from June. More strength is needed to get the bulls more excited.
Be cautious before taking aggressive positions and wait for confirmation that the downside momentum is complete.
Figure 11: The S&P 500 Index (SPY) Daily (Top) and 12-26-9 MACD (Bottom)
092923 SPY DailySource: Stockcharts.com
The S&P 500 (SPY) uptrend remains since October 2022 (purple line).
The SPY fell -0.68 %, closing at 427.48 below the falling 50-day Moving Average (blue rectangle) but remaining above the 200-day Moving Average (red rectangle).
Resistance is 435.00, 446.00, and 452.00. Support is at 425.00, 415.00, and 405.00.
MACD (bottom chart) is on a sell and continuing to make lows, implying downside momentum remains. A safer bottom is not likely for 2-5 weeks.
If the SPY closes below 425.00, that would imply further downside is likely towards 415.00 and 405.00
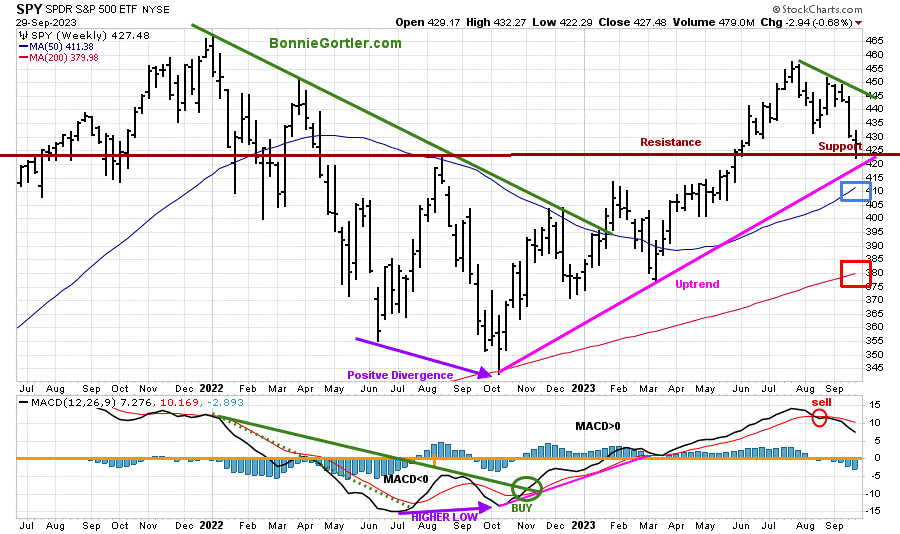
Figure 12: The S&P 500 Index (SPY) Weekly (Top) and 12-26-9 MACD (Bottom)
Source: Stockcharts.com
The intermediate trend remains up (pink line), with SPY closing above the 50-week (blue rectangle) and 200-week Moving Average (red rectangle).
However, be alert to a potential intermediate trend change if the uptrend breaks and the decline accelerates.
MACD (lower chart) is on a sell, clearly showing momentum is weakening.
Summing Up:
September was an ugly month. A further decline is not out of the woods if the tape action doesn’t improve. Short-term momentum oscillators are oversold, in the position where bottoms occur and potential buying opportunities develop. The first rally will likely fail before a safer bottom develops in 2-5 weeks.
Remember to manage your risk, and your wealth will grow.
Let’s talk investing. You are invited to set up your Free 30-minute Wealth and Well-Being Strategy session by clicking here or emailing me at Bonnie@BonnieGortler.com. I would love to schedule a call and connect with you.
Disclaimer: Although the information is made with a sincere effort for accuracy, it is not guaranteed that the information provided is a statement of fact. Nor can we guarantee the results of following any of the recommendations made herein. Readers are encouraged to meet with their own advisors to consider the suitability of investments for their own particular situations and for determination of their own risk levels.


Create more wealth in your life
with these simple strategies.
As an added bonus you will also
receive BG’s Updates and Ezine

Discover how to quickly create more well-being in your life with these simple strategies.
As an added bonus you will also
receive BG’s Updates and Ezine

As an added bonus you will receive BG’s Updates and Ezine

All work listed on BonnieGortler.com is licensed under a Creative Commons Attribution - Noncommercial - No Derivative Works 3.0 Unported License.


Free Report:
Grow and Sustain Your Wealth
Discover how to grow your money with these easy, simple steps.

