

10 Simple Tips for Financial Well-Being
07/01/2026
The major averages, Dow, S&P 500, and Nasdaq, closed lower for the week. All 11 S&P sectors for the week ending 1/29/21 finished the lower. A volatile week as stocks were under pressure, investors reduced risk and rotated assets into the defensive sectors. Real Estate (XLRE) and Utilities (XLU) were the best sectors, only losing -0.16% and -1.10%, respectively. Materials (XLB) and Energy (XLE), high-risk sectors, followed through on their previous weeks’ heavy losses, down -5.03% and -6.54%. The S&P 500 (SPY), in comparison, lost – 3.3%.
S&P SPDR SECTOR ETFs SUMMARY
Week of 01/29/21
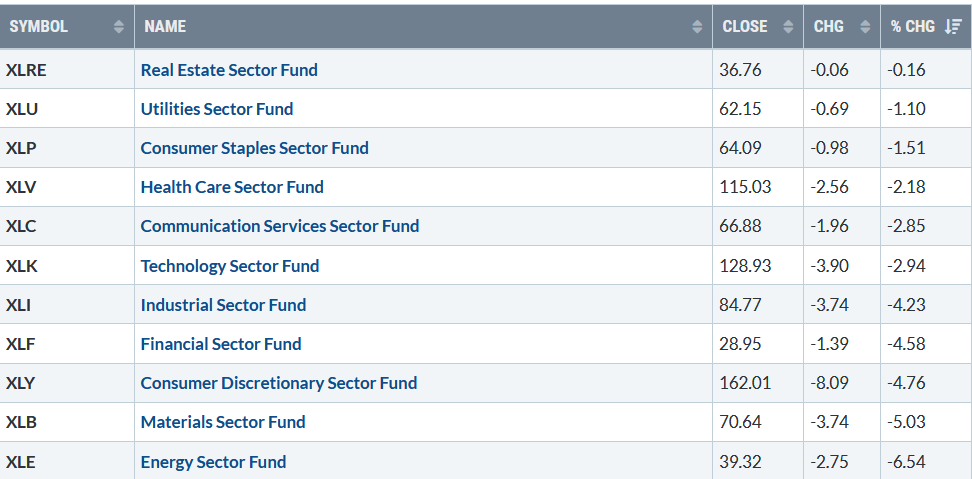
Chart Source: Stockcharts.com
What a difference a week makes. The advance-decline line on the New York Stock Exchange Index (NYSE) made a new high the previous week, confirming the market’s strength. The week’s market breadth on the (NYSE) weakened significantly with 739 advances and 2523 declines. However, there were only five new lows during Friday’s big down day, fewer than on 1/27/21, not a significant expansion of New Lows, which I believe is bullish.
Stocks reversed to the downside last week. All three major averages, Dow, S&P 500, and the Nasdaq, closed lower, all losing over -3.00% for the week. For the month, the Dow, lost -2.04%, S&P 500 fell -1.12%, and the Nasdaq rose +1.42%. The Russell 2000, the benchmark for small-cap stocks, had a 5-day losing streak, which hasn’t happened since February 2019, falling -4.39%. On the plus side, for the month, the Russell 2000 gained +5.00%, is short term oversold, and holding above its short-term support.
What to keep an eye on now? Watch SPDR S&P 500 ETF (SPY) and Volatility Index (VIX)
Daily SPDR S&P 500 (SPY) Price (Top) and 12-26-9 MACD (Bottom)
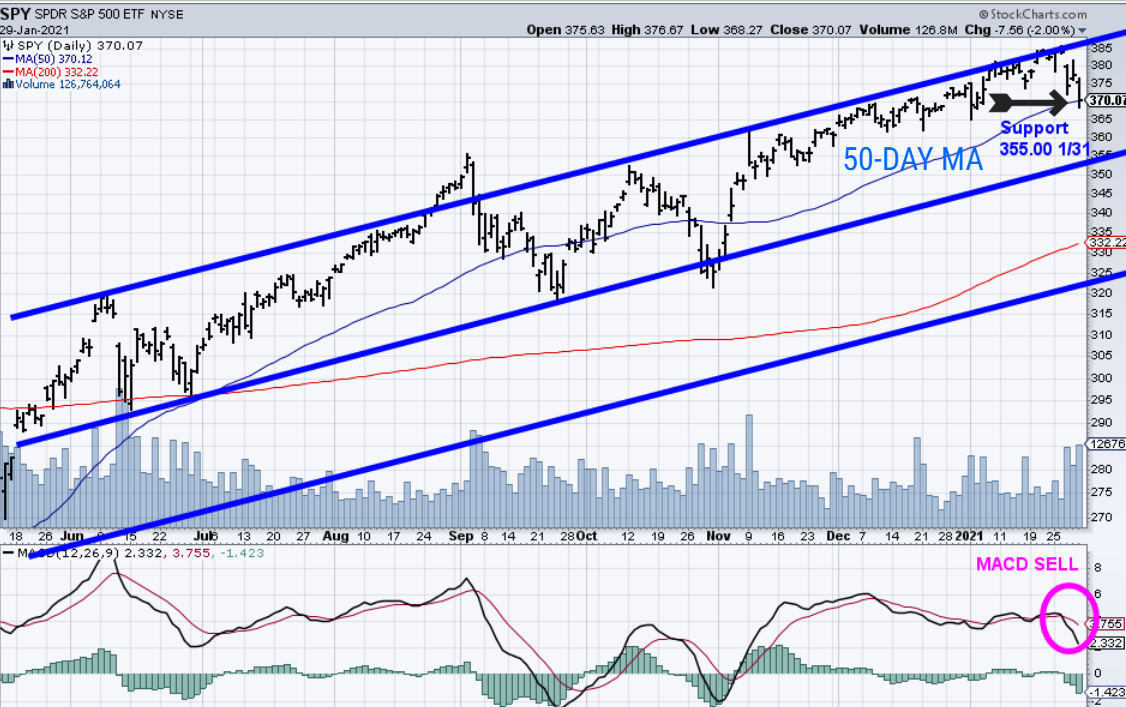
Chart Source: Stockcharts.com
The top portion of the chart shows the S&P 500 (SPY) fell to a low of 368.27 on 1/29/21, falling below its 50-Day MA of 370.12, causing some stops to hit intraday, but closed right there at 370.07 (black arrow).
However, MACD, a momentum indicator, is on a sell and not yet below 0 (pink circle in the lower chart). A close below 370.07 would imply that the decline may continue to test the next support area at 355.00 (mid-channel), followed by 325.00 if the selling pressure accelerates. The hourly charts based on are oversold after last week’s decline, are in position for a short-term rally.
This past week’s pandemic news, which had been the focus of the media shifted to GameStop and other stocks with large short positions. Record-setting volume in call options, hedge funds, and retail investors went head-to-head, outages at big and smaller brokerage houses, along with some restrictions on buys and sell orders of certain stocks, became center stage. It would be a positive sign if the S&P 500 (SPY) could hold and turn up immediately, preferably by 11 AM on Monday 2/1 after the dust settles.
If you have any questions or comments, click here.
Volatility Index (VIX)
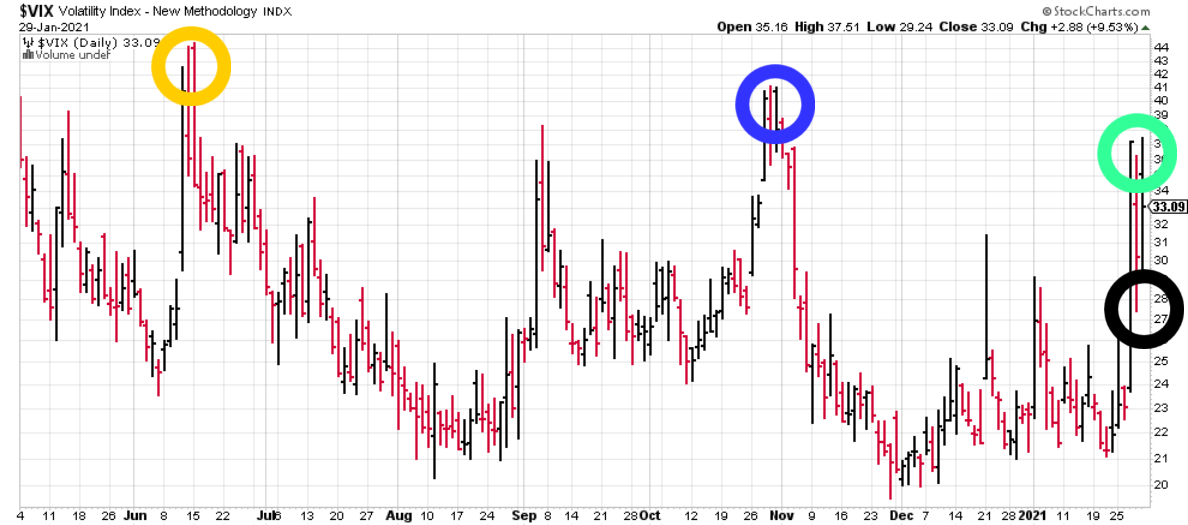
A volatile week, with daily volatility rising sharply last week as measured by the CBOE Volatility (VIX), the fear index (a contrary market indicator). VIX closed at 33.09 on 1/29 (green circle). VIX rose from 21.91 on 1/22 only a week ago (black circle).High VIX readings suggest high risk, while low VIX readings suggest lower or minimal risk. VIX fell from its intraday high of 37.5, on 1/29 of its highest reading since 41.16 on 10/29/20 (blue circle) and 6/16/20 (yellow circle) before the market rallied sharply.
The good news is that when VIX peaks, many times, a noteworthy bottom occurs. Time will tell if this indeed is the case. A VIX close below 29.00 would imply the recent decline is over for now. A close above 41.16 would suggest more immediate selling is likely.
Another measure of fear has increased quickly among investors.
Fear and Greed Index
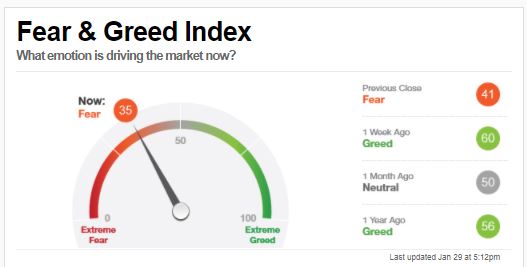
Source: CNN.com
In one week, the CNN fear and greed index (a contrary indicator) fell from 60 to 35. Emotions of investors shifted quickly from greed to fear. It’s a bullish sign that investors do not show high levels of greed and are more cautious, implying a turn could be imminent sooner rather than later.
Summing Up
The averages fell sharply last week, and market breadth deteriorated, but new lows remain low. Anxiety is high among investors. Day to day volatility increased with unusual buying in highly shorted stocks and investors and hedge funds selling stocks to raise cash. Stocks that have been leaders have fallen more than the market averages, and support lies just below. It’s too early to say that a market top has occurred. Watch the S&P 500 (SPY) for a close below 370.07. Keep an eye if the VIX closes below 29.00. The odds favor at least one more rally toward new highs and beyond after the latest decline ends.
If you are concerned with the stock market volatility, unsure of what to do next, and would like some simple strategies to follow, learn how here:
If you liked this article, you would love my Free report, Grow and Sustain Your Wealth. Please get it here
Disclaimer: Although the information is made with a sincere effort for accuracy, it is not guaranteed that the information provided is a statement of fact. Nor can we guarantee the results of following any of the recommendations made herein. Readers are encouraged to meet with their own advisors to consider the suitability of investments for their own particular situations and for determination of their own risk levels. Past performance does not guarantee any future results.


Create more wealth in your life
with these simple strategies.
As an added bonus you will also
receive BG’s Updates and Ezine

Discover how to quickly create more well-being in your life with these simple strategies.
As an added bonus you will also
receive BG’s Updates and Ezine

As an added bonus you will receive BG’s Updates and Ezine

All work listed on BonnieGortler.com is licensed under a Creative Commons Attribution - Noncommercial - No Derivative Works 3.0 Unported License.


Free Report:
Grow and Sustain Your Wealth
Discover how to grow your money with these easy, simple steps.

