

10 Simple Tips for Financial Well-Being
07/01/2026
Friday’s rally propelled nine of the eleven S&P sectors higher for the week ending 3/26/21. Real Estate (XLRE) and Consumer Staples (XLP), defensive sectors lead the way up +4.32% and +3.87%, respectively. The weakest sector (Consumer Services Sector (XLC) fell by -3.97%, while Consumer Discretionary (XLY) was down -0.08%. The SPDR S&P 500 ETF Trust (SPY), in comparison, gained +1.67%, closing at a record high.
S&P SPDR SECTOR ETFs SUMMARY
Week of 3/26/21
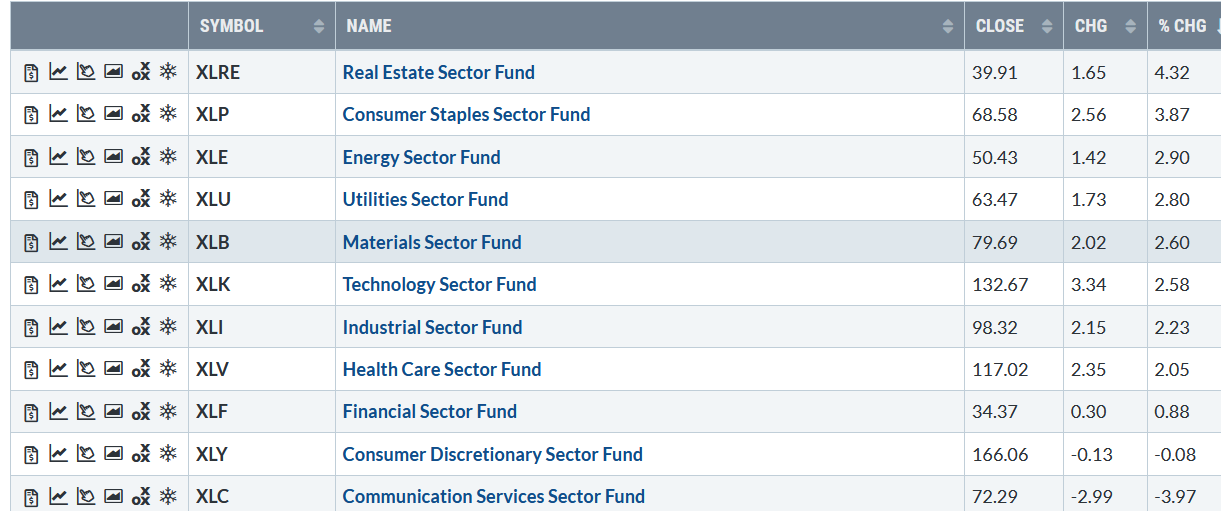
Source: Stockcharts.com
What to watch now?
10-Year Treasury yields stopped rising, closing at 1.66%, falling from 1.73% the previous week. (see Figure:1). Watch this week if yields trend up after rising on 3/26.
A close below 1.60 for two days would be a positive sign that rising rates may pause more in the near term. On the other hand, if yields increase, growth stocks’ weakness could continue and ignite more selling in different market sectors.
Figure 1:10-Year Treasury Yields
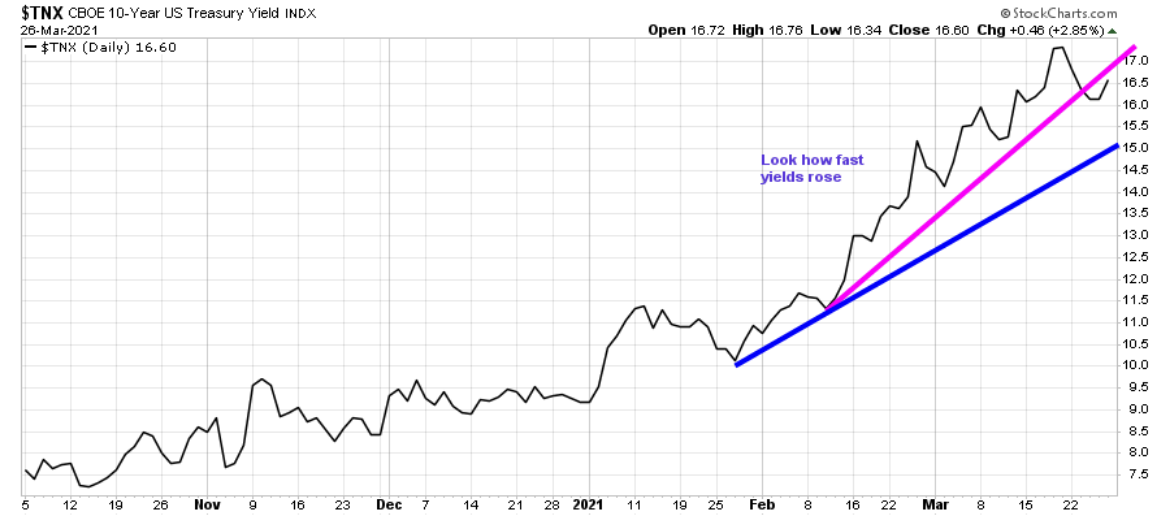
Source: Stockcharts.com
Market internals was mixed last week. Weekly market breadth on the New York Stock Exchange Index was slightly negative, an improvement from last week with 1564 advances and 1787 declines. However, Nasdaq breadth was worse with 1122 advances and 3166 declines.
The Dow gained +1.36% for the week, the S&P 500 was up +1.57%, and the Nasdaq was lower by -0.58%, its fifth weekly decline in the past six weeks.
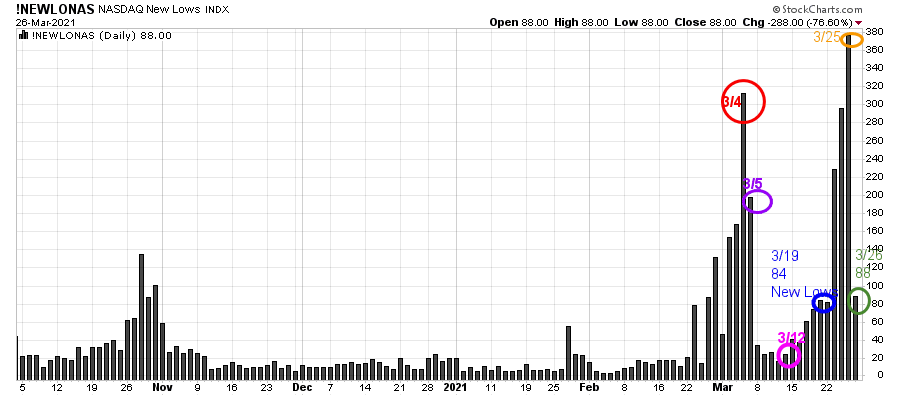
Figure 2: Nasdaq New Lows
 Source: Stockcharts.com
Even though Nasdaq was down for the week and breadth was terrible, it’s encouraging that new lows contracted quickly on Friday to 88 (green circle), after expanding to 376 on 3/25 (a higher reading than on 3/4). It would be a bullish sign for the Nasdaq to advance if new lows can remain low.
Professional investors always have an exit strategy before they invest. Knowing your exit strategy is an important investment fundamental. – Rich Dad Poor Dad
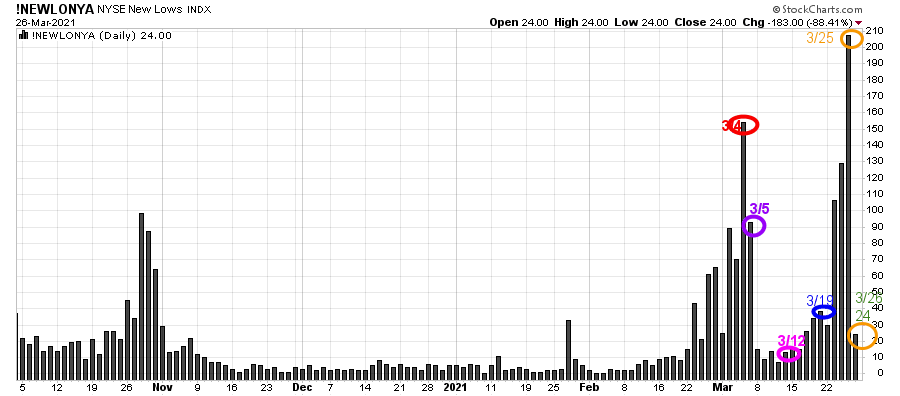
Figure 3: New York Stock Exchange New Lows
Source: Stockcharts.com
On 3/25, the NYSE New Lows were 207 (see Figure: 3), a higher reading than 150 on 3/4 (orange circle). It’s positive that new lows contracted immediately to 24, the most bullish zone.
Watching the New lows on the New York Stock exchange is a simple technical tool that helps awareness about the immediate trend’s direction. In my book Journey to Wealth, when the New Lows are below 25, the market is very strong (Very Low Risk, and prices tend to rise).
Watch closely if New lows on the New York Stock Exchange expand or contract this week. As long as New lows are between 25 and 50, the odds of a further rally are likely. On the other hand, if new lows expand to more than 207, then it would suggest a higher risk environment and more caution warranted in the near term.
Figure 4: Important ETFs to Monitor
Week of 3/26/21
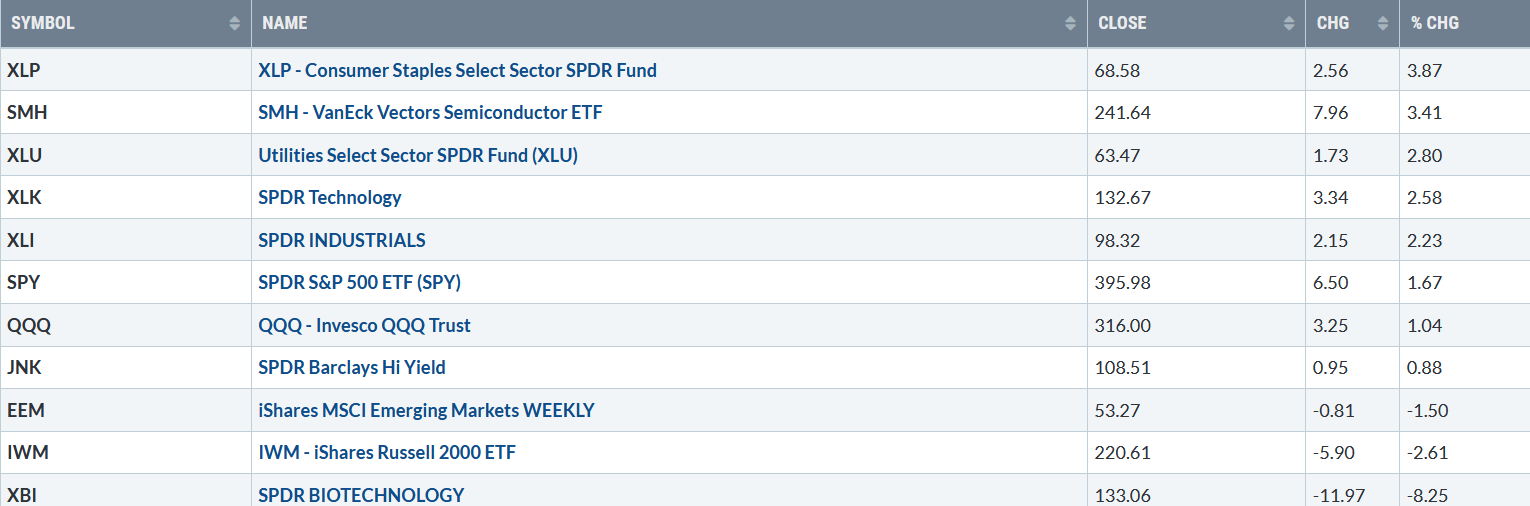
Source: Stockcharts.com
Positives
Negatives
Figure 5: Daily iShares Russell 2000 (IWM) Price (Top) and 12-26-9 MACD (Bottom)
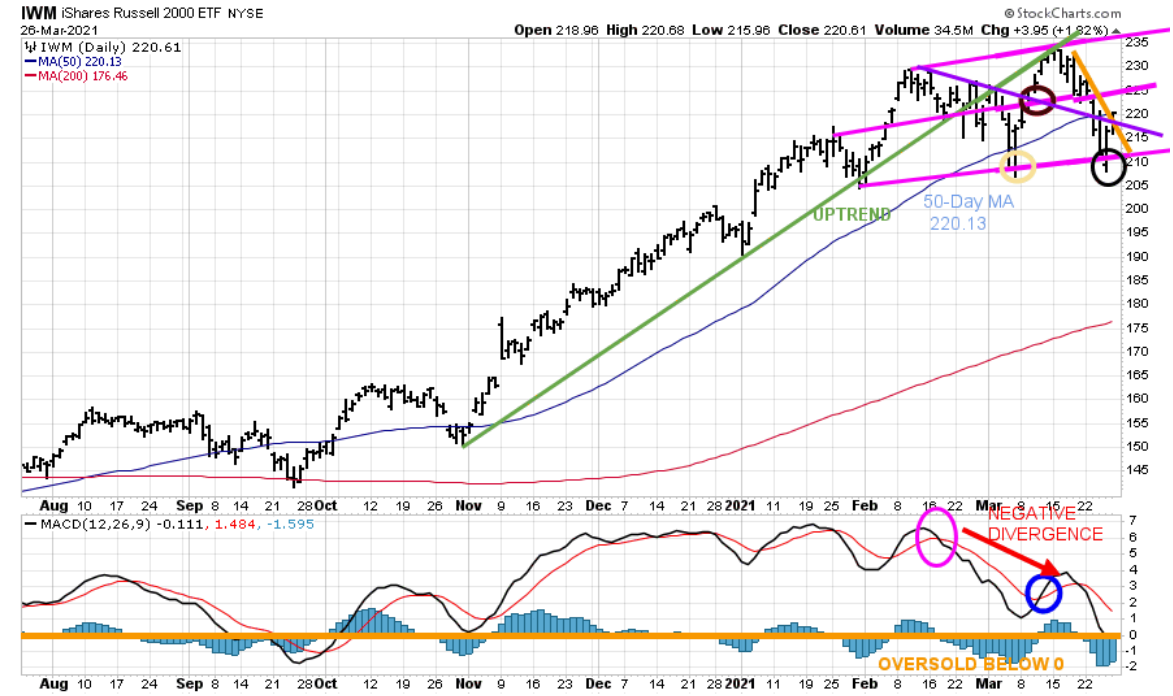
Source: Stockcharts.com
The top portion of the chart is the daily iShares Russell 2000 Index ETF (IWM), the benchmark for small-cap stocks, with a 50-Day Moving Average (blue line) and 200-Day Moving Average (red line) that traders watch and use to define trends.
After slightly penetrating the bottom of the channel at 209.00 and the 50-Day Moving Average (yellow circle), IWM rallied to break the daily downtrend (purple line) penetrating resistance at 220.00 (brown circle) stalling at 234.15, the upper channel and old uptrend line from November (in green).
Unable to get through the upper channel, IWM reversed lower, falling below the 50-Day MA (blue line). IWM immediately fell to the lower channel (black circle), where the buyers stepped in, successfully testing the March 4 low. With the strong close on 3/26, IWM broke its downtrend and closed at the 50-Day MA. Support is 220.00, followed by 210.00. Resistance is at 225.00.
The bottom half of the chart is MACD (12, 26, 9), a measure of momentum. MACD remains on its February sell (pink circle). In early March, MACD did not get below 0, an oversold condition (orange line) where a proper reset and buy would occur before turning up (blue circle).
After IWM made a high at 234.15, MACD did not confirm the high. MACD showed clear signs of weakening momentum turning down, forming a bearish negative divergence (red arrow). A negative divergence forms when price makes a higher high, and MACD forms a lower high.
MACD is close to being oversold, below 0. However, there is no sign yet of improving momentum. More time and base building are needed before a safe buying pattern develops.
Figure: 6 Daily Invesco QQQ Trust Nasdaq (QQQ) Price (Top) and 12-26-9 MACD (Bottom)
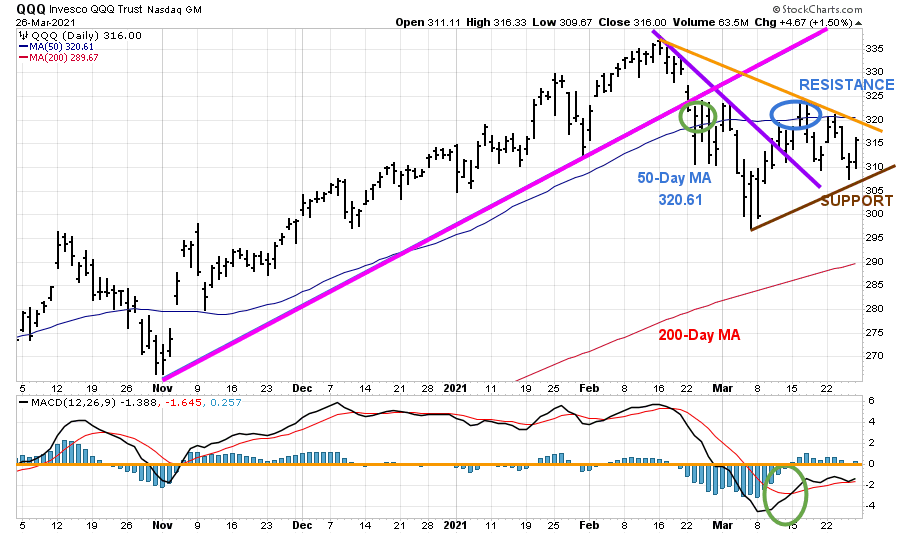
Source: Stockcharts.com
The top part of the chart shows the daily Invesco QQQ, an exchange-traded fund based on the Nasdaq 100 Index with its 50-Day Moving Average and 200-Day Moving Average. The daily uptrend of QQQ from November (pink line) was violated in February (green circle), shifting the daily trend down.
On 3/12, QQQ broke the downtrend (purple line), a positive sign, but failed to sustain enough momentum to stay above the 50-Day MA (blue circle) and turned lower. QQQ lagged last week but joined the rally late Friday afternoon. QQQ gained 1.3% in the last 15 minutes of trading generating and hourly MACD (chart not shown) buy along with an increase in money flow. This combination bodes well for the near term.
Support is at 305.00. A close below 305.00 would imply further downside is likely. Resistance is at 321.00, followed by 325.00.
The bottom half of the chart is MACD (12, 26, 9, a measure of momentum. MACD remains on a buy, turning up from below 0, an oversold condition (green circle). However, so far, MACD is not showing any sign of strength, moving sideways, weak momentum, no thrust to the upside yet. It will be favorable if QQQ closes above resistance at 325.00, which would form a favorable double bottom formation.
Figure 7: 03/26/21 A Strong Close:

Source: Stockcharts.com
The last hour of trading was extremely strong, leading to a broad advance led by SMH up 5.02%, EEM up 2.6%, and XLK up 2.54% of all areas under recent selling pressure. SMH (Figure 8), strong close was enough to break the downtrend (green line) and form a favorable MACD double bottom buy formation.
Figure 8 Daily Vaneck Vectors Semiconductor (SMH) Price (Top) and 12-26-9 MACD (Bottom)
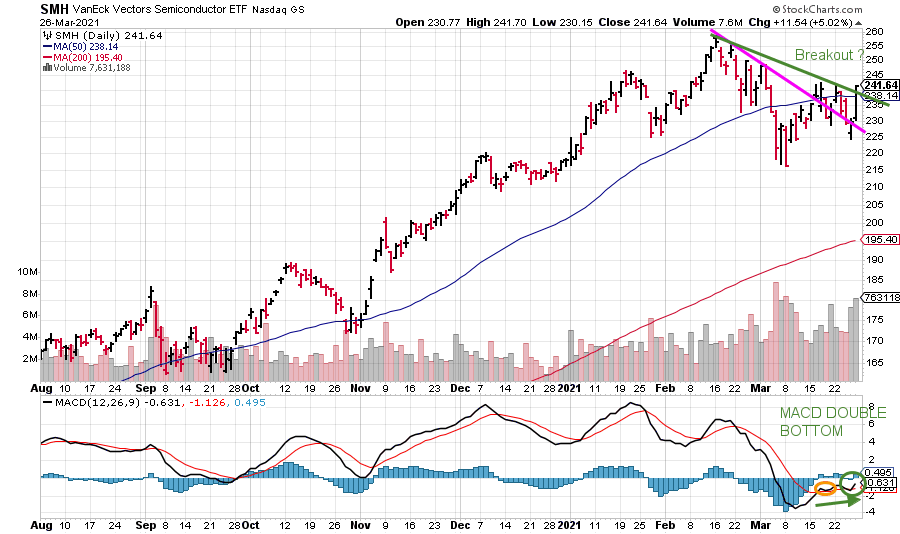
Source: Stockcharts.com
Summing Up:
Friday’s close was encouraging after early in the week it had looked like a severe decline may have started. New highs were made in the Dow and the S&P 500. IWM successfully tested its March 4th low, recovering to close at its 50-Day MA. Semiconductors led the advance breaking its downtrend. Watch new lows on NYSE and Nasdaq if they remain low, and if 10-year Treasury yields move lower, then it’s likely to fuel the advance ahead of final quarterly window dressing and rebalance this week. For now, continue to give the benefit of the doubt to the bulls until there is a weekly close below 207.21 for IWM and below 300.00 for QQQ. Remember to manage your risk, and your wealth will grow.
I would love to hear from you. If you have any questions or comments, click here.
If you liked this article, you would love my Free report, Grow and Sustain Your Wealth. Please get it here

Disclaimer: Although the information is made with a sincere effort for accuracy, it is not guaranteed that the information provided is a statement of fact. Nor can we guarantee the results of following any of the recommendations made herein. Readers are encouraged to meet with their own advisors to consider the suitability of investments for their own particular situations and for determination of their own risk levels. Past performance does not guarantee any future results.


Create more wealth in your life
with these simple strategies.
As an added bonus you will also
receive BG’s Updates and Ezine

Discover how to quickly create more well-being in your life with these simple strategies.
As an added bonus you will also
receive BG’s Updates and Ezine

As an added bonus you will receive BG’s Updates and Ezine

All work listed on BonnieGortler.com is licensed under a Creative Commons Attribution - Noncommercial - No Derivative Works 3.0 Unported License.


Free Report:
Grow and Sustain Your Wealth
Discover how to grow your money with these easy, simple steps.

