

10 Simple Tips for Financial Well-Being
07/01/2026
Ten of the eleven S&P sectors finished higher for the week ending 08/13/21. Five gained more than the SPDR S&P 500 ETF Trust (SPY), up +0.78%. Materials (XLB) and Staples (XLP) were the leading sectors, +2.75% and +2.21%, while Real Estate (XLRE) and Energy (XLE) were the weakest.
S&P SPDR Sector ETFs Performance Summary
Week Ending 8/13/21
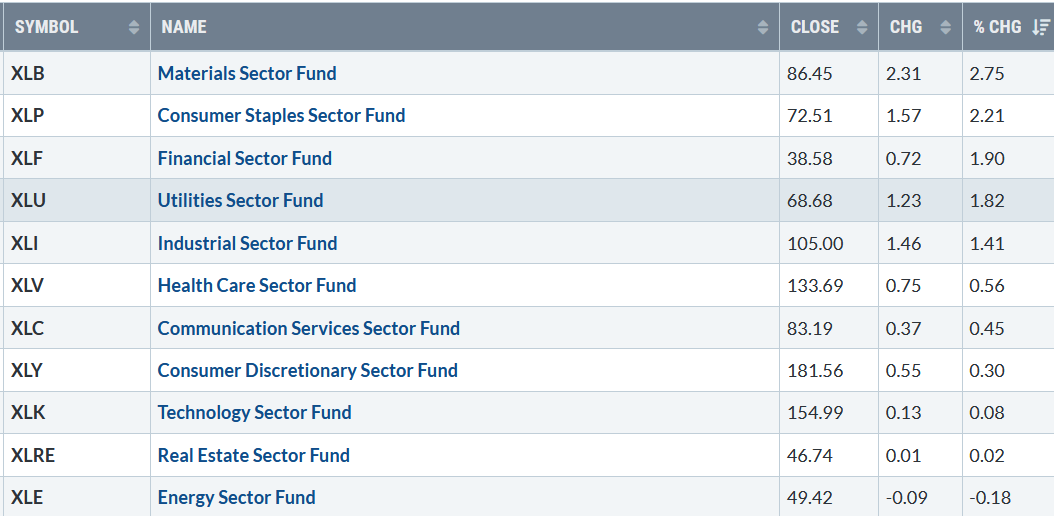
Source: Stockcharts.com
10-Year Treasury yields fell Friday for the first time in 9 days closing at 1.297% (Figure 1). A potential test of the August low is likely. A decline in yields to 1.15% could slow the gains in the financials and likely attract buying into growth stocks. On the other hand, a rise in rates above 1.42% would imply higher yields towards 1.60% and potentially higher.
Figure 1: 10-Year Treasury Yields
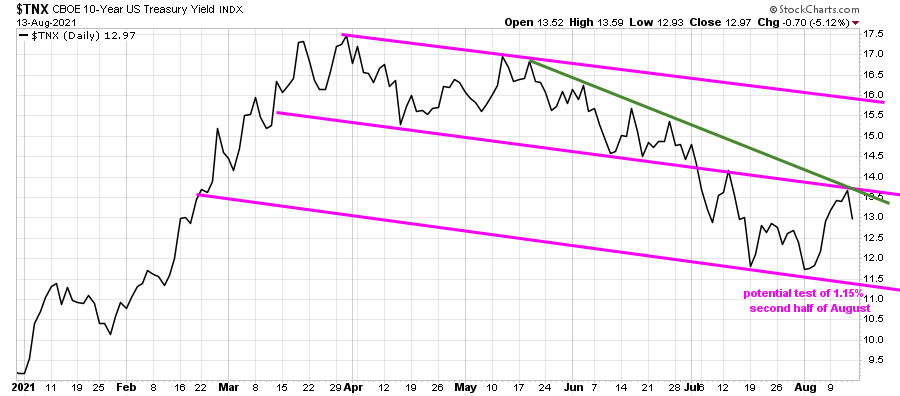
Source: Stockcharts.com
The S&P 500 and Dow Jones Industrial Average closed at new all-time highs in quiet light summertime trading volume. The Dow gained +0.87%, S&P 500 up +0.71%, and Nasdaq fell -0.09%. The Russell 2000 index continues to underperform, down -1.10%.
Weekly market breadth was negative for both the NYSE and Nasdaq. The New York Stock Exchange Index (NYSE) had 1688 advances and 1814 declines. Despite finishing the week slightly below a record high, Nasdaq breadth was even worse, with 1932 advances and 2763 declines.
Figure 2: Daily New York Stock Exchange (NYSE) New Lows
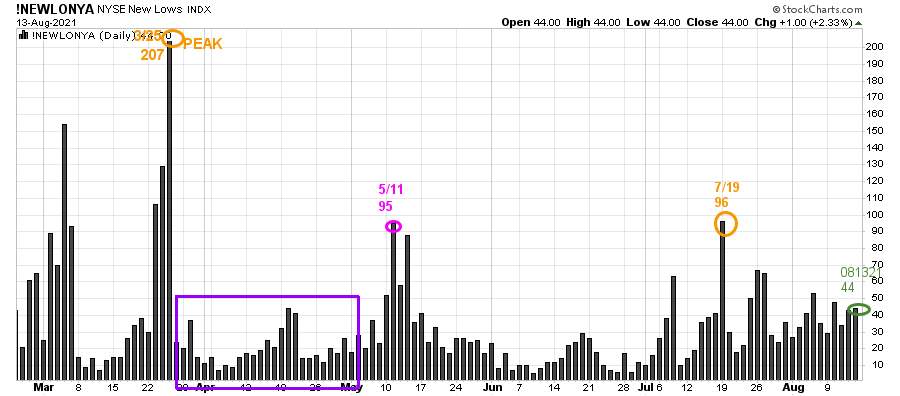
Source: Stockcharts.com
On 3/25/21, the NYSE New Lows peaked at 207 (orange circle) and immediately contracted (purple rectangle). On 5/11, New lows on NYSE jumped to 95, flashing a warning sign, but New Lows immediately dropped. On 7/19, they closed at 96 (orange circle) but then contracted again.
New Lows closed on 8/13 at 44 (green circle) in a low-risk zone, where stock prices tend to rise.
Watching New lows on the New York Stock exchange is a simple technical tool that helps awareness about the immediate trend’s direction. In my book, Journey to Wealth, the market is very strong when the New Lows are below 25 (Very Low Risk, and prices tend to rise). When New Lows are between 25 and 50, the risk is low.
If New Lows begin to expand and have a succession of days over 96 (the 7/19 high), this will imply more risk and a possible shift in trend. On the other hand, if they remain low, the odds favor the continuation of the rally.
“If it doesn’t challenge you, it doesn’t change you.” Fred Devito”
Bonnie’s favorite ETFs to Monitor
Figure 3: Performance week of 8/9/21 – 08/13/21
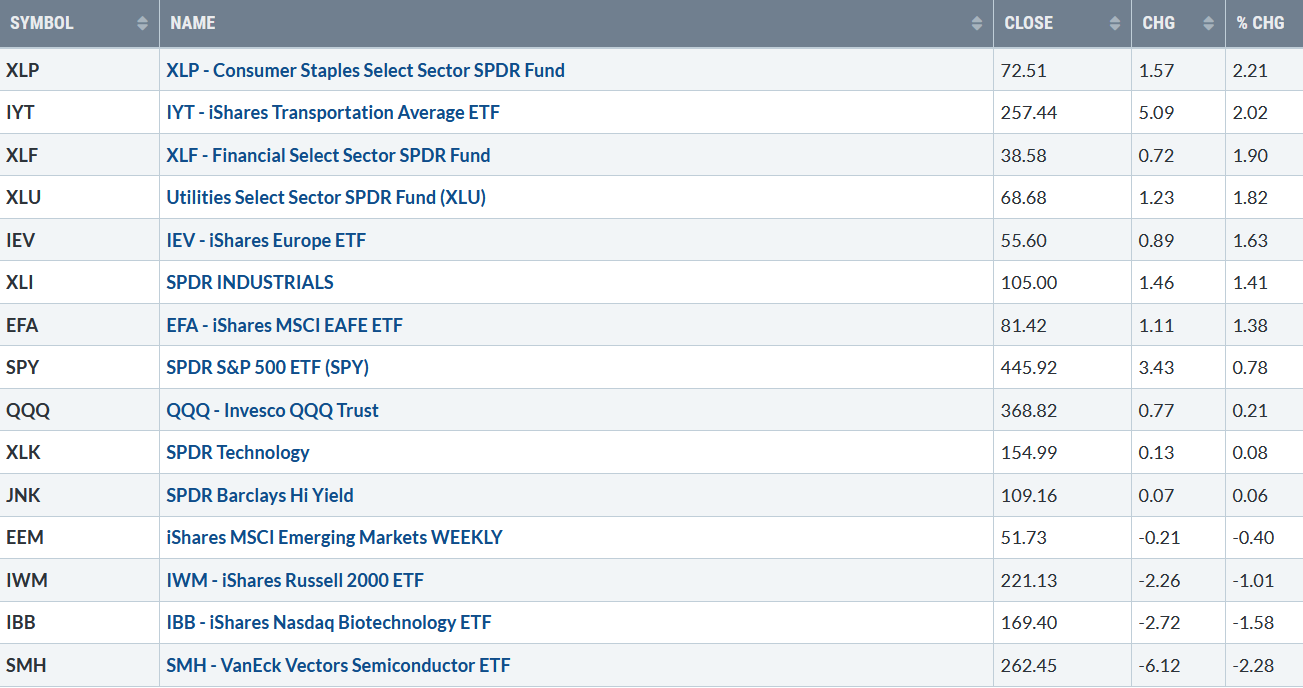
Source: Stockcharts.com
Positives
Negatives
Figure 4: LORD Abbett High Yield Fund
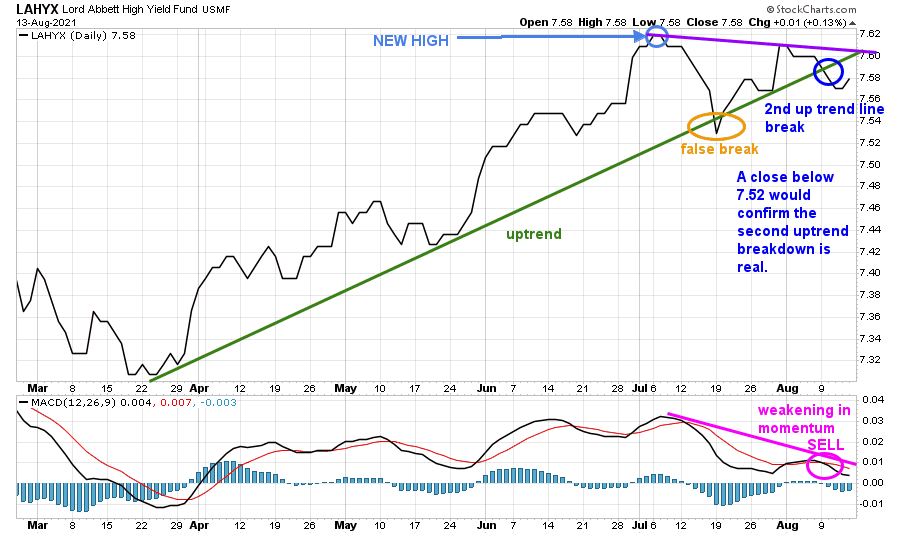
Source: Stockcharts.com
Lord Abbett High Yield, an open-end high yield corporate bond fund, broke its uptrend for the second time since July (Figure 4). More weakness in Hi Yields will not bode well for the broad market. If LAHYX takes out their high, then look for U.S. Equities to rise.
Figure 5: CNN Fear and Greed Index
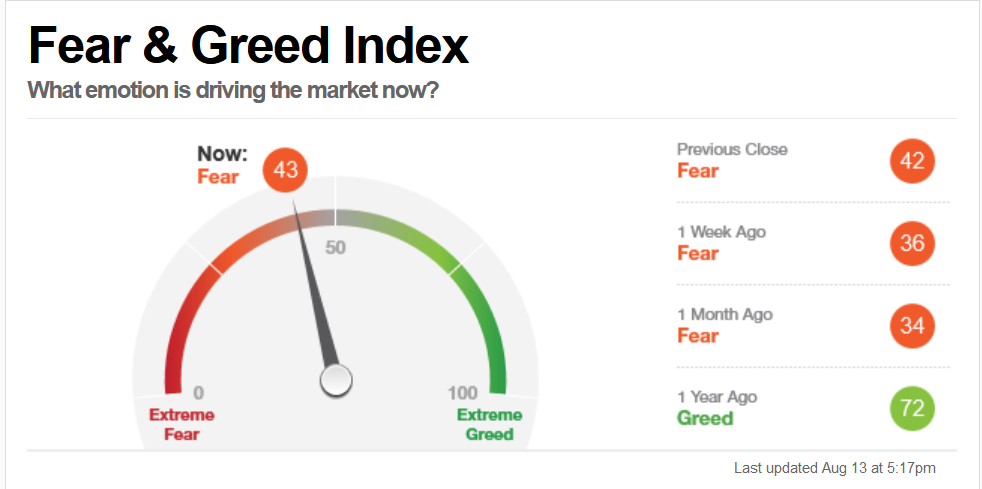
Source: CNN Business
It’s favorable that investors are showing fear as the major averages rise and not showing greed.
Figure 6: Nasdaq New Highs
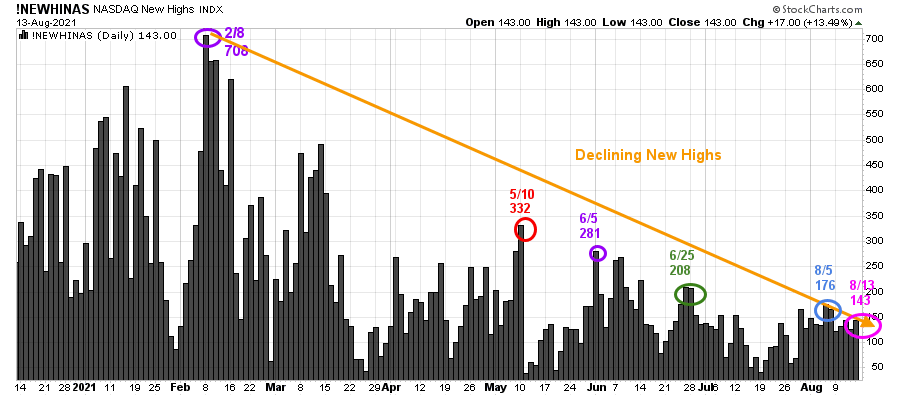 Source: Stockcharts.com
Despite the new high in the Nasdaq, stocks making New Highs on 8/13 were only 143, continuing to contract and below the peak reading of 708 set on 2/8. Watch if New Highs expand to over 208, it would be positive in the short term. On the other hand, if New Highs drop, a short-term correction could begin.
Figure 7: Nasdaq New Lows
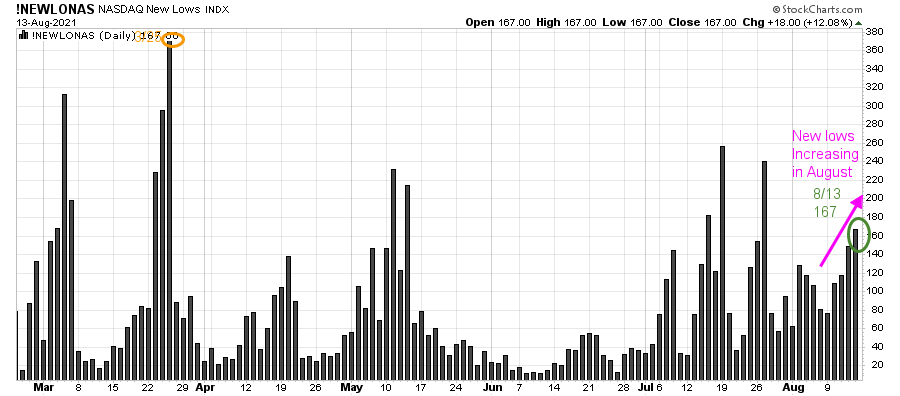 Source: Stockcharts.com
Nasdaq New Lows are increasing in August, not a positive sign.
Figure 8: The Nasdaq Advance-Decline Line
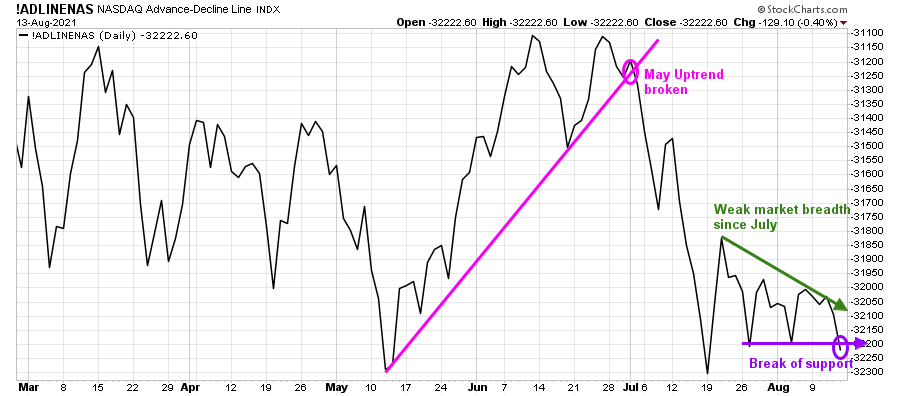
Source: Stockcharts.com
The Nasdaq-line AD-Line is weakening and closed below support. Further deterioration in breadth would be bearish for the Nasdaq.
Figure 9: New York Stock Exchange Advance-Decline Line Top and S&P 500 Index Bottom
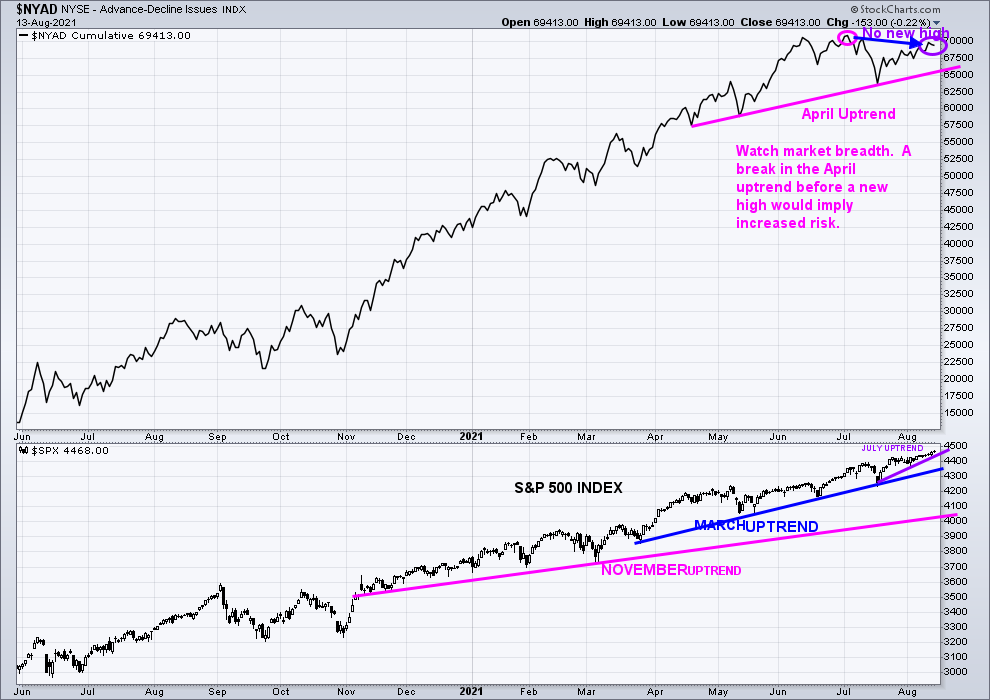
Source: Stockcharts.com
In the top portion of the chart (Figure: 9), The NYSE A/D line failed to make a new high (blue arrow), confirming the S&P 500 high. Watch market breadth. A break in the April uptrend in the AD Line without making a new high would be negative. Historically the market rarely makes a final peak when the cumulative advance-decline line makes a new high.
The lower chart is the S&P 500 Index in an uptrend (blue line) from March (blue line), closing at 4468.70. A close below 4400.00 (purple line) would break the short-term uptrend from July.
Even more disturbing would be a close below 4250.00 that would break the March uptrend and warn of more than 10% potential decline.
Figure 10: CBOE Volatility Index (VIX)
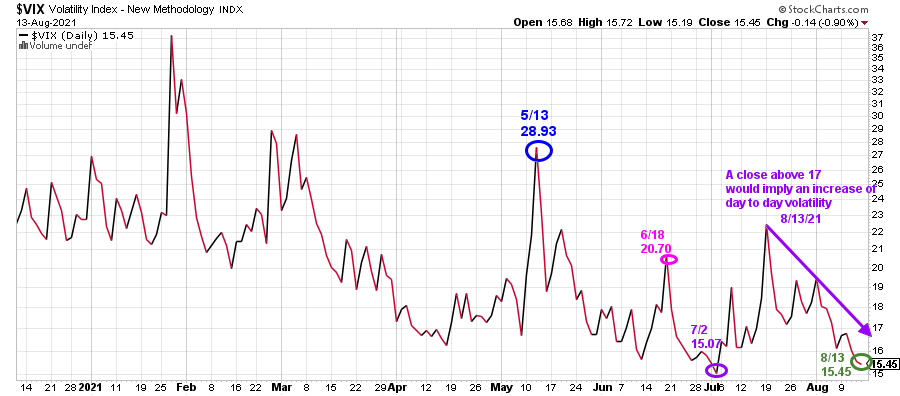
Source: Stockcharts.com
CBOE Volatility Index (VIX) closed at 15.45, its lowest reading since 7/2.
A close above 17.00 would imply an increase in day-to-day volatility and a warning of a potential correction to begin.
Figure 11: Daily iShares Russell 2000 (IWM) Price (Top) and 12-26-9 MACD (Bottom)
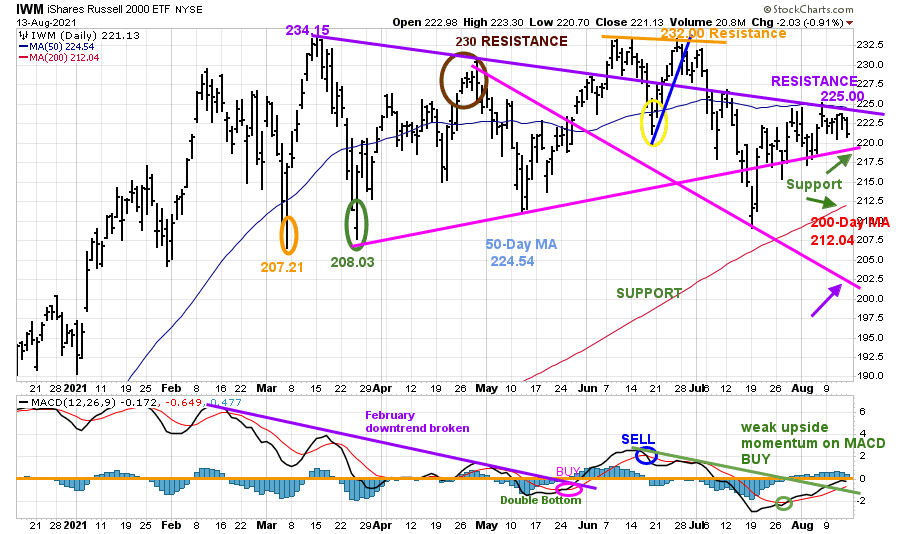
Source: Stockcharts.com
The top portion of the chart is the daily iShares Russell 2000 Index ETF (IWM), the benchmark for small-cap stocks, with a 50-Day Moving Average (MA) (blue line) and 200-Day Moving Average (MA), that traders watch and use to define trends.
IWM made a low on 3/5 at 207.21 (orange circle), then peaked at 234.15. On 3/25, IWM successfully tested its low at 208.03 (green circle) and then stalled at 230.00, resistance (brown circle). In June, IWM failed to make a new high, stalled, and turned lower, but held the March low.
Last week, IWM closed at 221.13, down -1.01%, after failing to get through resistance above 225.00. It will not be a good sign if IWM closes below support at 217.50.
A close below 212.04, the 200 Day Moving Average would imply an increased risk of a potential top made and a decline to 185.00 or lower.
The bottom half of the chart is MACD (12, 26, 9), a measure of momentum. MACD is on a buy but not showing any sign of strength which is troublesome.
Figure 12: Weekly iShares Russell 2000/S&P 500 (IWM/SPY) Relative Strength Ratio
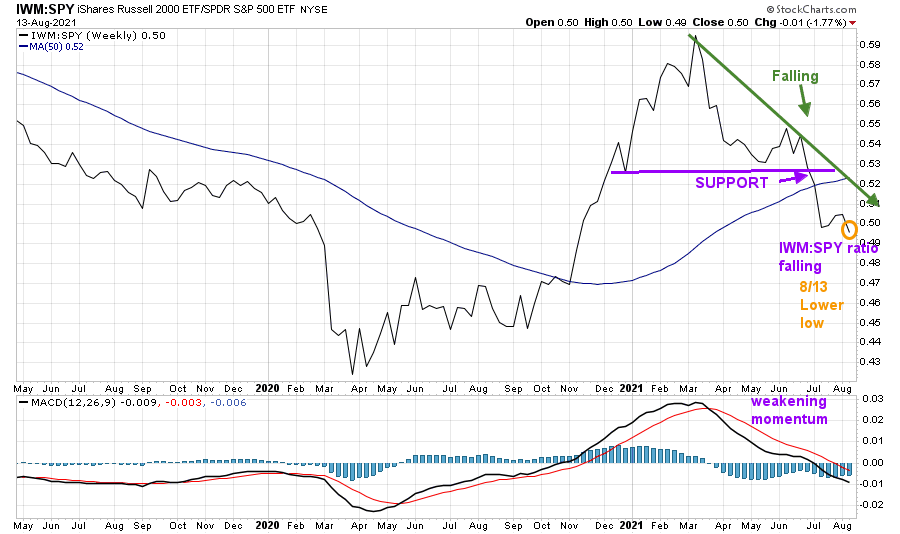
Source: Stockcharts.com
The weekly IWM /SPY ratio fell below support in June (purple line) and has continued to fall. The ratio remains below the 50-Week Moving Average (MA). Although the MA is rising, it’s not a positive sign that the ratio (orange circle) made a lower low.
MACD (in the lower chart) is falling and making lows. No sign yet of a turn up which would be favorable.
I expect IWM to remain weaker than the S&P 500 until IWM is stronger than the S&P 500 (SPY).
Figure 13: Weekly iShares Russell 2000 (IWM)
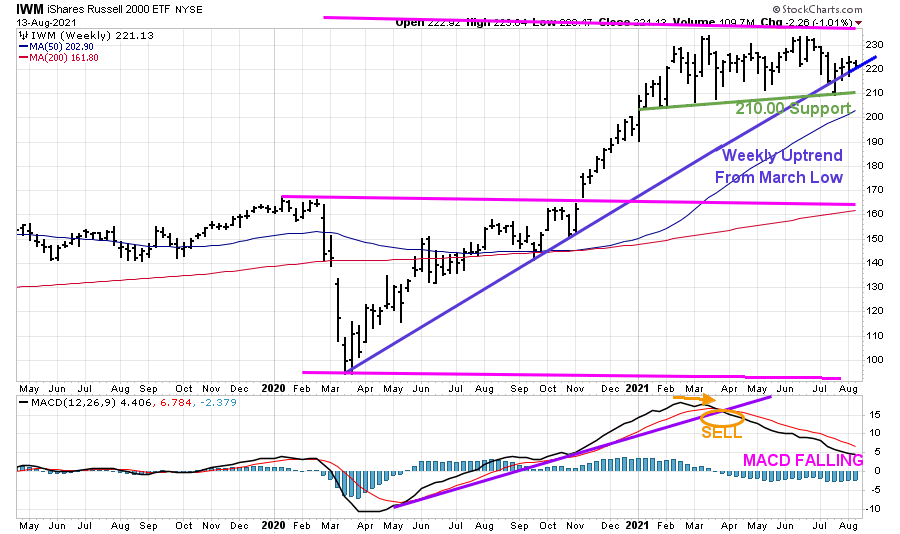
The Russell 2000 (IWM) (top chart) weekly support is 210.00. A weekly close below would be negative for the broad market.
MACD (lower chart) remains on a sell and is falling but is not yet oversold, below 0, in a favorable buy position.
Figure 14: Daily Invesco QQQ Trust Nasdaq (QQQ) Price (Top)
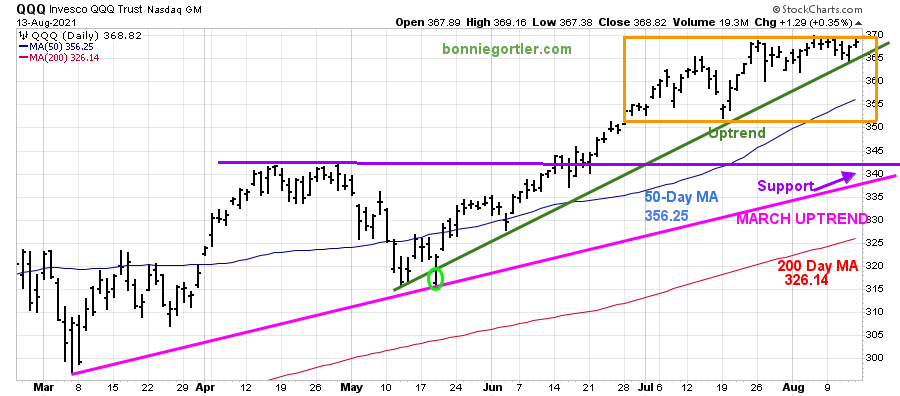
Source: Stockcharts.com
The chart shows the daily Invesco QQQ, an exchange-traded fund based on the Nasdaq 100 Index with its 50-Day Moving Average and 200-Day Moving Average. The March Uptrend remains intact (pink line). Since June, QQQ has been in a trading range (orange rectangle) and appears ready to either break out or break down.
QQQ gained 0.2% for the week closing at 368.82, just under the upside objective of 370.00. A close above for two days would imply higher prices. However, if QQQ closes below 360.00, expect short-term weakness to test 350.00, the bottom of the rectangle.
The next area of support would be at 342.50, which I would like to see hold. Any close below the March uptrend would imply a test of the 200-day MA which stands 326.14 at the time of this writing.
Until market breadth improves and QQQ closes two days above 370.00, I recommend caution.
Figure 15: Daily Vaneck Vectors Semiconductor (SMH) Price (Top) and 12-26-9 MACD (Bottom)
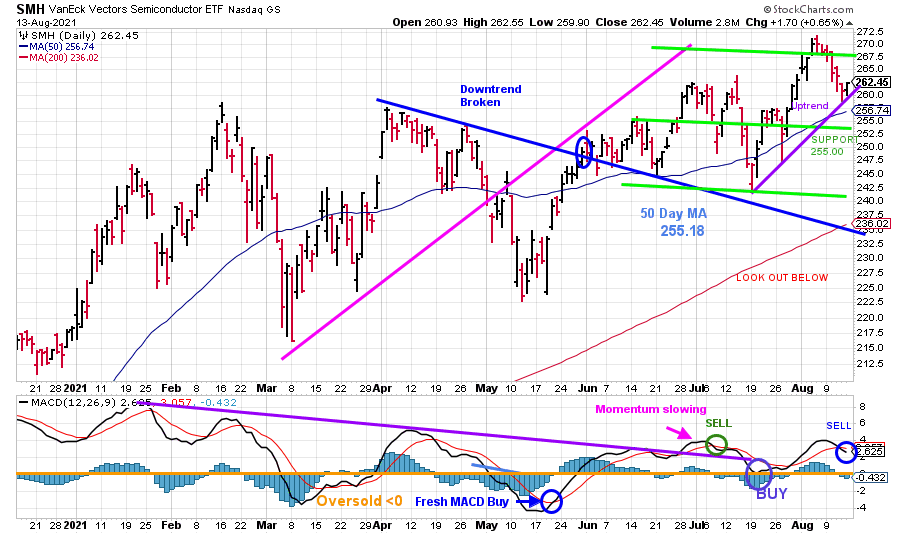
Source: Stockcharts.com
The top chart shows Semiconductors (SMH). Semiconductors (SMH) have risen since breaking their April downtrend (blue line) with an upside objective to 276.00. However, it achieved a high of only 271.79 and then turned down so far, holding the July uptrend (purple line)
SMH closed on 8/13 at 262.45, down -2.28% for the week. Support is at 255.00 followed by 240.00.
The lower chart is MACD, a measure of momentum. MACD is now on a sell.
I recommend caution unless SMH closes above 267.50 and a more favorable momentum pattern develops.
Summing Up:
Daily volatility is quiet as the major averages make new highs. Market breadth and momentum patterns are not favorable. Fewer and fewer stocks are participating in the advance. Technology, Small-caps, and Semiconductors look vulnerable to a market correction. Risk is increasing that a correction could begin at any time if support levels are violated.
Remember to manage your risk, and your wealth will grow.
If you liked this article, you would love my Free report, Grow and Sustain Your Wealth. Please get it here.

I would love to hear from you. If you have any questions or comments or would like to talk about the market, click here.
Disclaimer: Although the information is made with a sincere effort for accuracy, it is not guaranteed that the information provided is a statement of fact. Nor can we guarantee the results of following any of the recommendations made herein. Readers are encouraged to meet with their own advisors to consider the suitability of investments for their own particular situations and for determination of their own risk levels. Past performance does not guarantee any future results.


Create more wealth in your life
with these simple strategies.
As an added bonus you will also
receive BG’s Updates and Ezine

Discover how to quickly create more well-being in your life with these simple strategies.
As an added bonus you will also
receive BG’s Updates and Ezine

As an added bonus you will receive BG’s Updates and Ezine

All work listed on BonnieGortler.com is licensed under a Creative Commons Attribution - Noncommercial - No Derivative Works 3.0 Unported License.


Free Report:
Grow and Sustain Your Wealth
Discover how to grow your money with these easy, simple steps.

