

10 Simple Tips for Financial Well-Being
07/01/2026
Five of the eleven S&P sectors finished higher for the week ending 08/20/21. All stronger than the SPDR S&P 500 ETF Trust (SPY), down -0.57%. Lower risk, more defensive sectors Utilities (XLU) and Health Care (XLV) led the way gaining, +1.82%, and +1.81%, while Energy (XLE) was hit hard, down -7.14% and Materials (XLB) down -3.09%.
S&P SPDR Sector ETFs Performance Summary
Week Ending 8/20/21
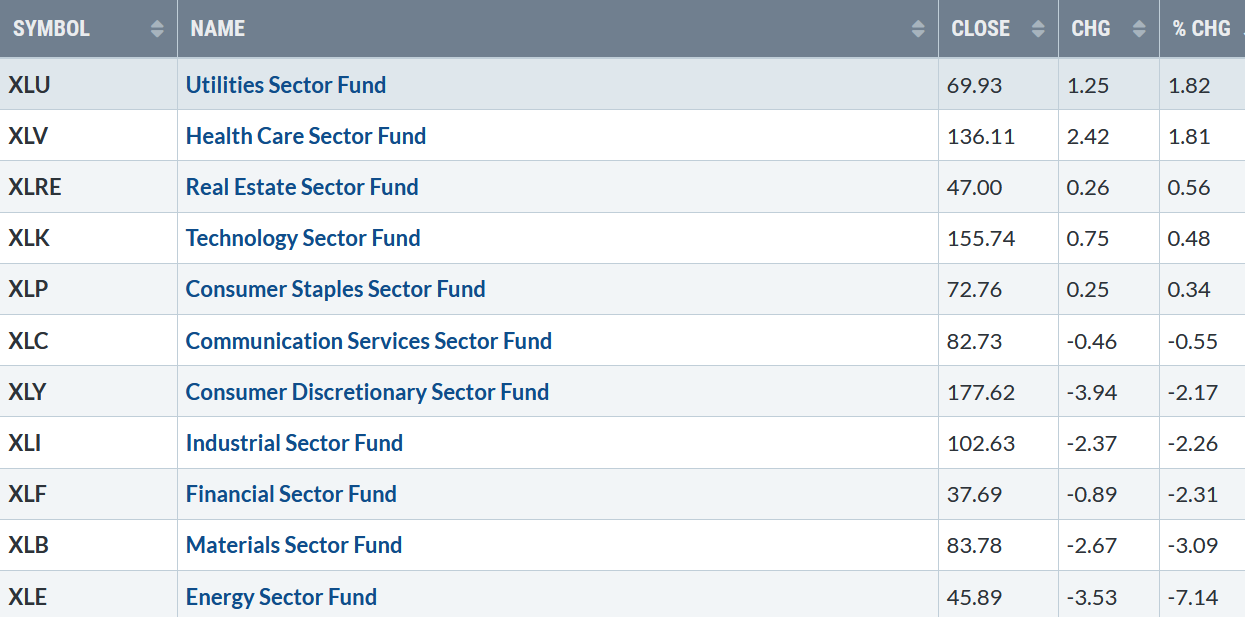
Source: Stockcharts.com
10-Year Treasury yields were lower for the week closing at 1.26% (Figure 1). A test of the August low to 1.15% remains a possibility which would slow the gains in the financials and could attract buying into growth stocks.
On the other hand, a close above 1.42% would imply higher yields towards 1.60%, helping Financial stocks putting pressure on Growth stocks potentially higher.
Figure 1: 10-Year Treasury Yields
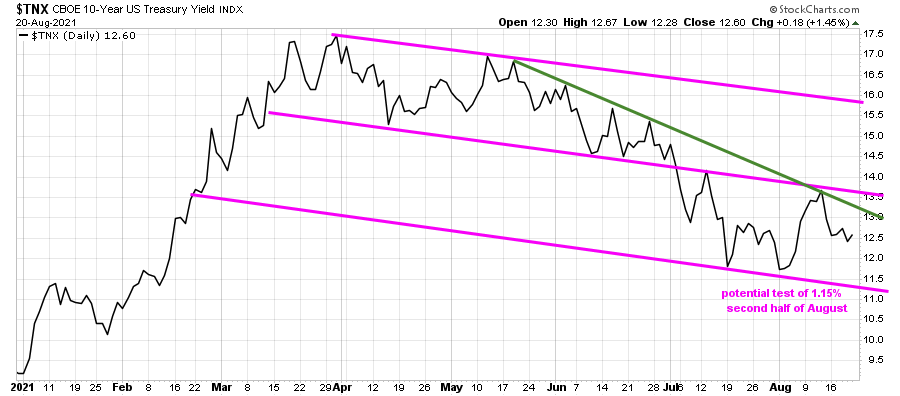
Source: Stockcharts.com
The major averages all closed lower last week despite the gains on Friday. The Dow fell -1.11%, S&P 500 down -0.59%, and Nasdaq fell -0.73%. The Russell 2000 index continues to underperform, down -2.50%.
Weekly market breadth was negative for both the NYSE and Nasdaq. The New York Stock Exchange Index (NYSE) had 894 advances and 2613 declines. Nasdaq breadth was 1170 advances and 3561 declines. Both NYSE and Nasdaq AD lines are showing underlying weakness that is worrisome.
Figure 2: Daily New York Stock Exchange (NYSE) New Lows
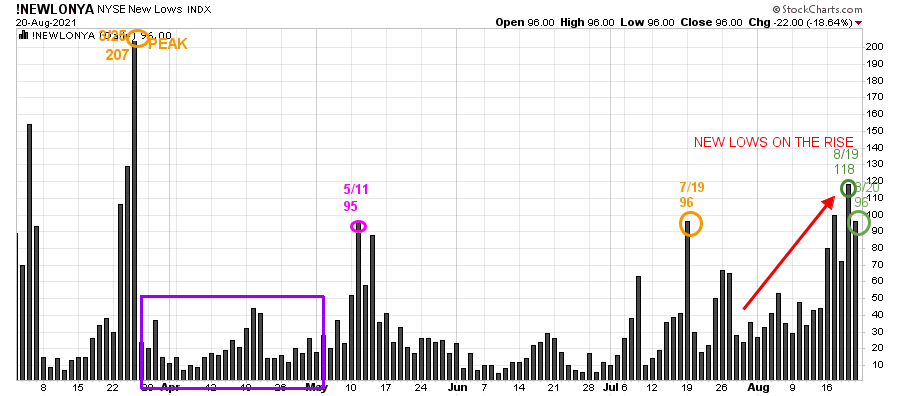
Source: Stockcharts.com
On 3/25/21, the NYSE New Lows peaked at 207 (orange circle) and immediately contracted (purple rectangle). On 5/11, New lows on NYSE jumped to 95, flashing a warning sign, but New Lows immediately dropped. On 7/19, they closed at 96 (orange circle) but then contracted again.
Watching New lows on the New York Stock exchange is a simple technical tool that helps awareness about the immediate trend’s direction. Learn more in my book, Journey to Wealth. The market is very strong when the New Lows are below 25 (Very Low Risk and prices tend to rise). When New Lows are between 25 and 50, the risk is low, and prices tend to rise.
The Market Wealth Update ending 08/13 stated that if New Lows begin to expand and have a succession of days over 96 (the 7/19 high), precisely what happened, implying more risk and a possible shift in trend will occur.
New Lows are on the rise closing on 8/19 at 118, and 96 (green circles), now implying the New Lows are no longer in a low-risk zone. When New Lows are above 50, it alerts or warns of possible market weakness or a change in market tone.
Be aware, it’s a good idea to make sure you are happy and comfortable with your portfolio. It is best not to have more volatile investments than you can handle where you feel uncomfortable. If the selling continues, you could have some serious losses occurring if the market falls further. Unless New Lows immediately contract, a change of trend may be on the horizon.
“Go confidently in the direction of your dreams. Live the life you have imagined”. ~Henry David Thoreau
Bonnie’s ETFs to Watch Now
Figure 3: Performance week of 8/13/21 – 08/20/21
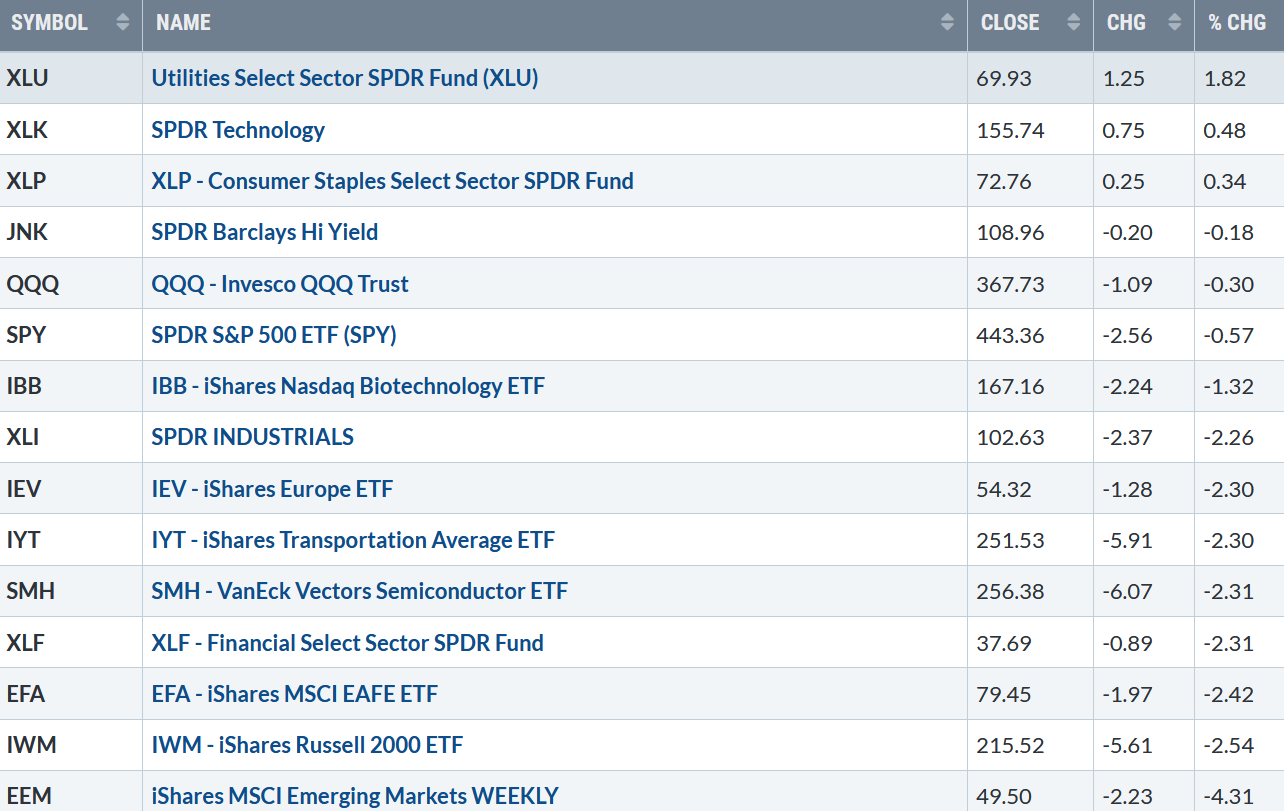 Source: Stockcharts.com
Market Tape is Negative
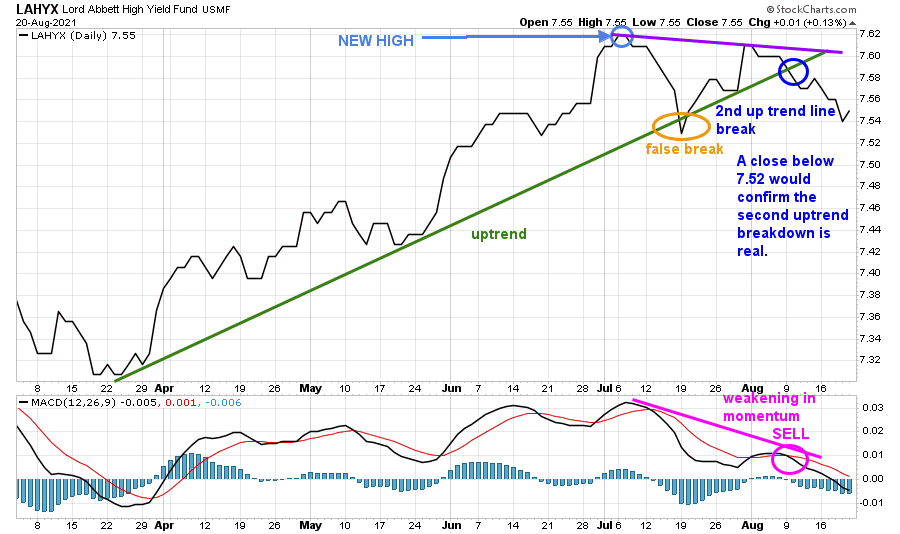
Figure 4: LORD Abbett High Yield Fund
Source: Stockcharts.com
Lord Abbett High Yield, an open-end high yield corporate bond fund, broke its uptrend (Figure 4). MACD continues to weaken. More weakness in Hi Yields will not bode well for the broad market. If you are overly exposed, reduce your holdings in case a sharp sell-off begins.
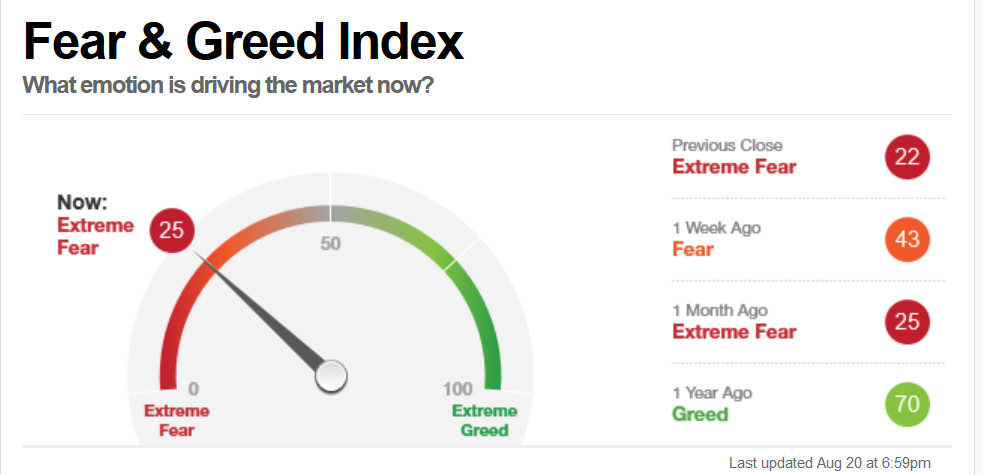
Figure 5: CNN Fear and Greed Index Source: CNN Business
Source: CNN Business
Based on CNN Fear and Greed Index (contrary indicator), market sentiment is improving, closing at 25 now, showing extreme fear falling from 43 a week ago.
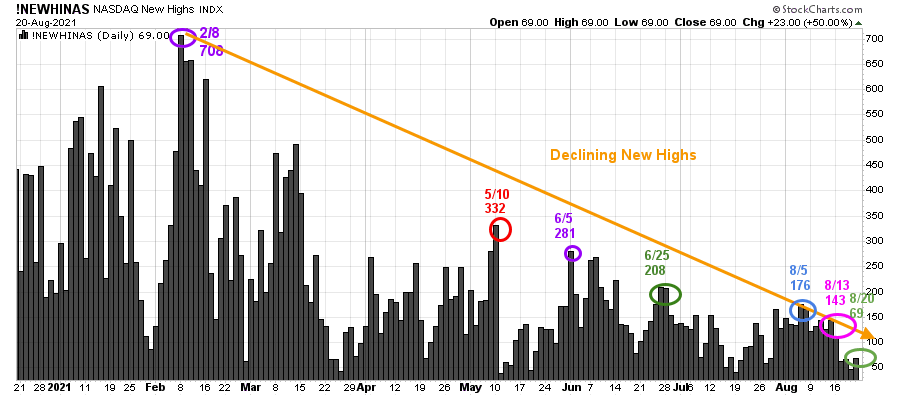
Figure 6: Nasdaq New Highs
Source: Stockcharts.com
Despite the Nasdaq being close to its new high, stocks making New Highs on 8/20 were only 69 (green circle), continuing to contract and below the peak reading of 708 set on 2/8. Watch if New Highs expand to over 208, then it would be positive in the short term. For now, New Highs are warning of further weakness. Be cautious.
Source: Stockcharts.com
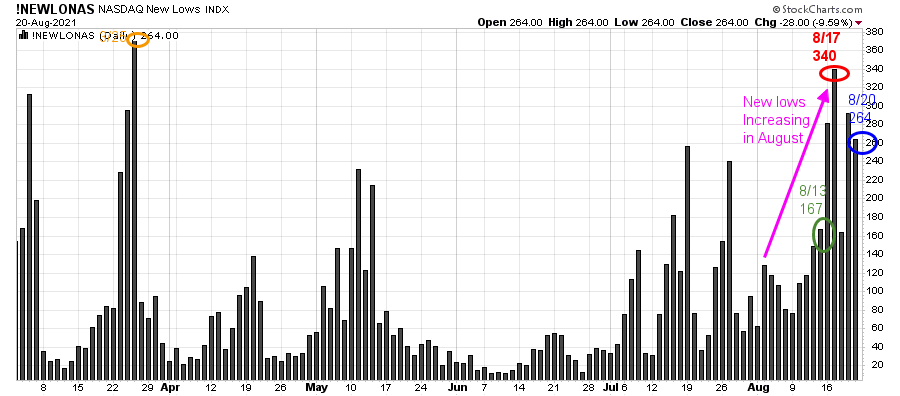
Nasdaq New Lows are increasing in August, with a high of 340 on 8/17, not a positive sign when the Nasdaq is near all-time highs.
Figure 8: Daily Nasdaq Advance-Decline Line
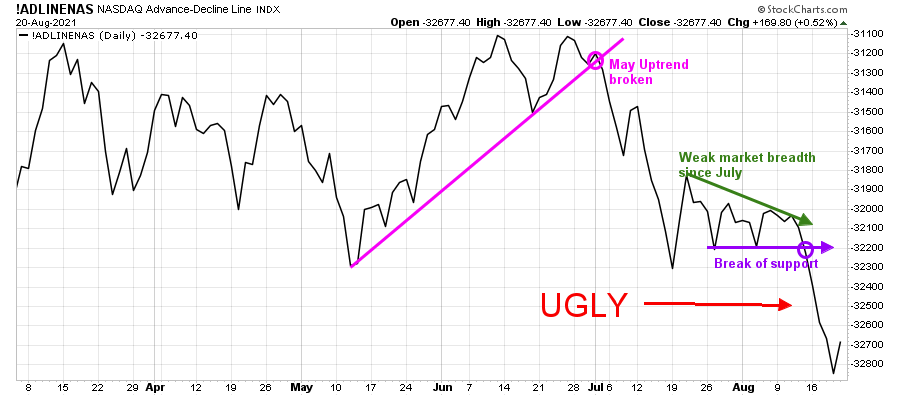
Source: Stockcharts.com
The Daily Nasdaq-line AD-Line is ugly, continuing to weaken after closing below support mentioned in the 081321 Market Update. Further deterioration in breadth is bearish for the Nasdaq.
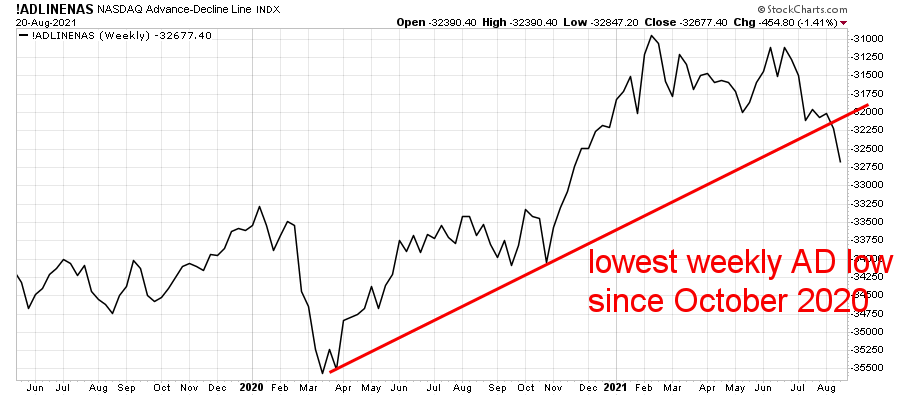
Figure 9: Weekly Nasdaq Advance-Decline Line
 Source: Stockcharts.com
The Nasdaq-line weekly AD-Line is disturbing, closing at its lowest low since October 2020.
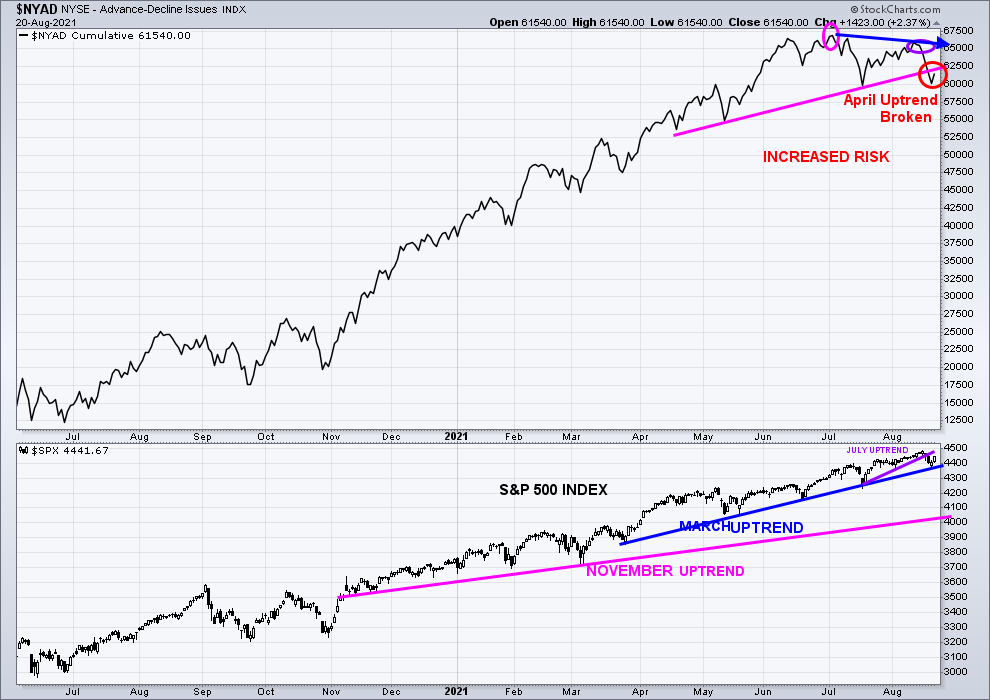
Figure 10: New York Stock Exchange Advance-Decline Line Top and S&P 500 Index Bottom
Source: Stockcharts.com
In the top portion of the chart (Figure: 9), the NYSE A/D line broke the April uptrend after failing to make a new high (blue arrow), confirming the S&P 500 high implying increased risk for the broad market.
The lower chart is the S&P 500 Index in an uptrend from March (blue line), closing at 4441.67. The July uptrend has been broken (purple line). However, the S&P 500 rally on Friday avoided a break in the March uptrend, a positive. A close below 4367.00 would break the March uptrend and likely to trip sell stops on the S&P 500 toward 4250.00 or potentially lower.
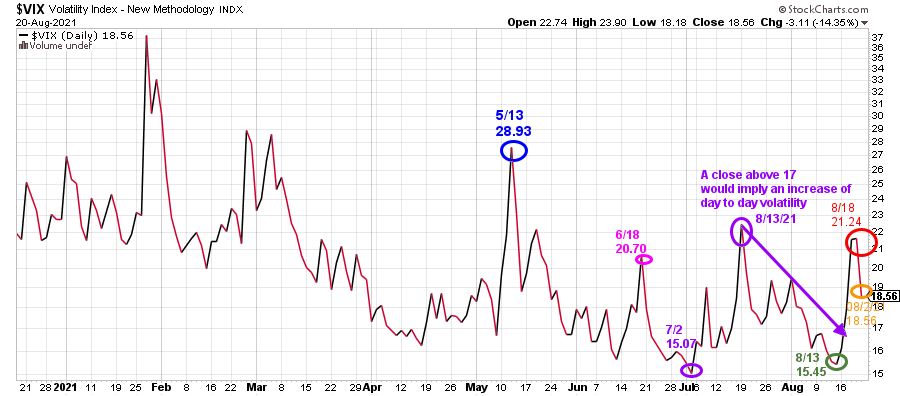
Figure 11: CBOE Volatility Index (VIX)
Source: Stockcharts.com
CBOE Volatility Index (VIX) rose sharply last week, hitting an intraday high of 23.90 on 8/20 and then falling, closing at 18.56.
When VIX closed above 17.00 on 8/18, a warning of a potential correction began, and day-to-day volatility increase.
Figure 12: Daily iShares Russell 2000 (IWM) Price (Top) and 12-26-9 MACD (Bottom)
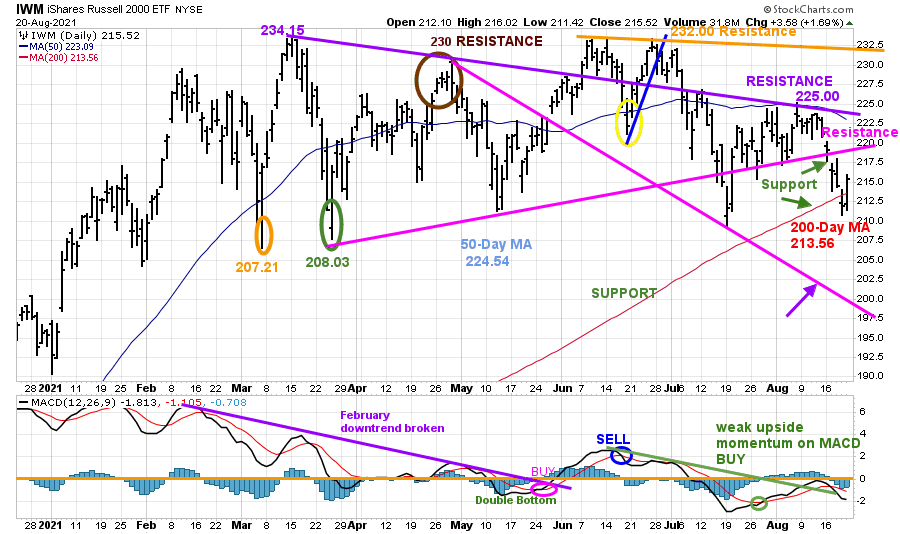
Source: Stockcharts.com
The top portion of the chart is the daily iShares Russell 2000 Index ETF (IWM), the benchmark for small-cap stocks, with a 50-Day Moving Average (MA) (blue line) and 200-Day Moving Average (MA), that traders watch and use to define trends.
IWM made a low on 3/5 at 207.21 (orange circle), then peaked at 234.15. On 3/25, IWM successfully tested its low at 208.03 (green circle) and then stalled at 230.00, resistance (brown circle). In June, IWM failed to make a new high, stalled, and turned lower, but held the March low.
Last week, IWM closed at 215.52, continuing to decline down -2.54%, closing below support at 217.50 (green arrow), falling below the 200-Day MA at 212.04. However, Friday’s rally closed above to give some hope to the bulls. So far, only a short-term bounce unless IWM can close two days above first resistance at 220.00 followed by 225.00.
A close below 213.56, the 200 Day Moving Average would imply the increased risk to 200.00 followed by 185.00.
The bottom half of the chart is MACD (12, 26, 9), a measure of momentum. MACD remains on a buy with no sign of strength, which continues to be troublesome.
Figure 13: Weekly iShares Russell 2000/S&P 500 (IWM/SPY) Relative Strength Ratio
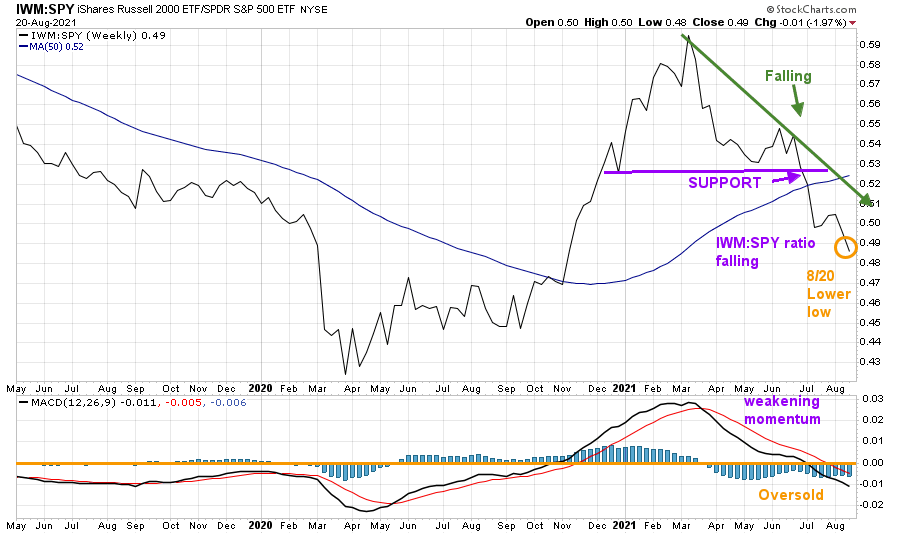
Source: Stockcharts.com
The weekly IWM /SPY ratio fell below support in June (purple line) and has continued to fall. The ratio remains below the 50-Week Moving Average (MA). Although the MA is rising, it’s not a positive sign that the ratio (orange circle) made a lower low.
MACD (in the lower chart) is falling and making lows. No sign yet of a turn up which would be favorable.
I continue to expect IWM to remain weaker than the S&P 500 until IWM shows some sign of being stronger than the S&P 500 (SPY).
Figure 14: Weekly iShares Russell 2000 (IWM)
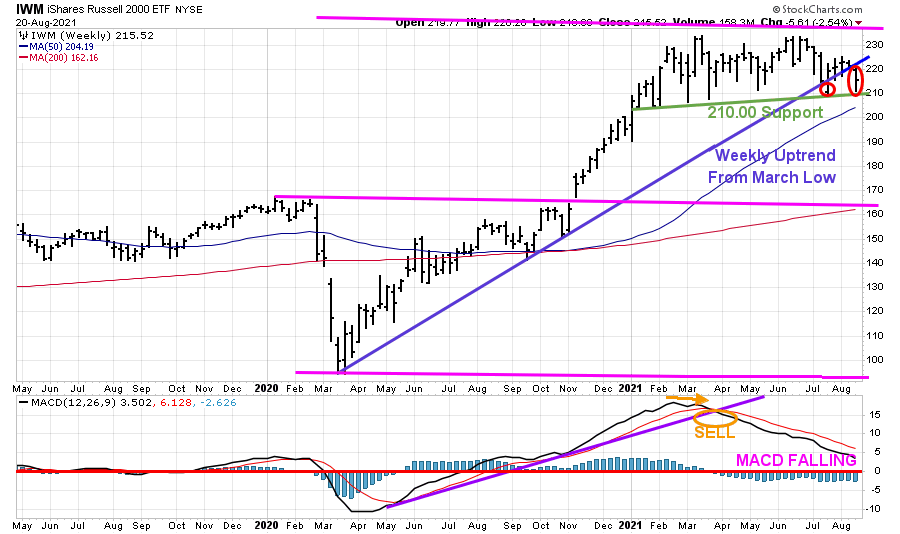
Source: Stockcharts.com
The Russell 2000 (IWM) (top chart) weekly support remains at 210.00, the low last week. A weekly close below would be negative for the broad market. It’s not a good sign that for the second time, IWM closed below the weekly uptrend from the March low (blue line).
MACD (lower chart) remains on a sell, falling but is not yet oversold, below 0, (red horizontal line) in a favorable buy position.
Figure 14: Daily Invesco QQQ Trust Nasdaq (QQQ) Price (Top)
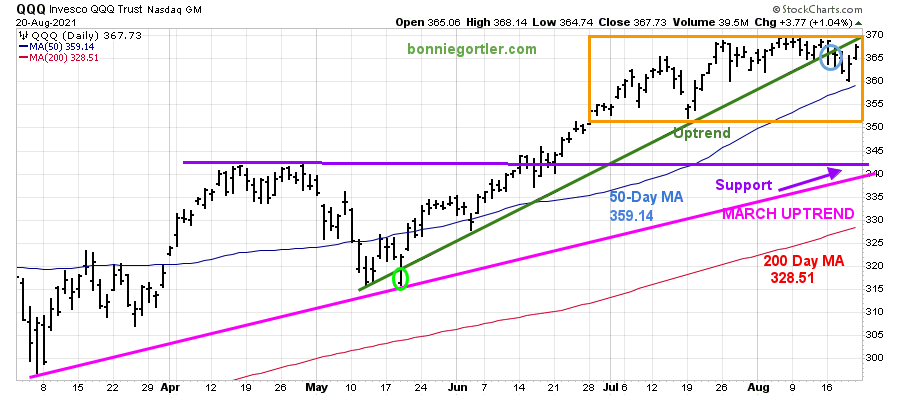
Source: Stockcharts.com
The chart shows the daily Invesco QQQ, an exchange-traded fund based on the Nasdaq 100 Index with its 50-Day Moving Average and 200-Day Moving Average. The March Uptrend remains intact (pink line). Since June, QQQ is in a trading range (orange rectangle),
QQQ fell -0.3% for the week closing at 367.73, remaining under the upside objective of 370.00 and within the trading range. A close above for two days would imply higher prices. QQQ rose late in the week after breaking the uptrend from May (green line) but held above its 50-Day MA.
Expect short-term weakness to 350.00, the bottom of the rectangle, if QQQ closes below 360.00.
The next area of support would be at 342.50, which I would like to see hold. Any close below the March uptrend would imply a test of the 200-day MA which stands 328.51 at the time of this writing.
Until market breadth improves and QQQ closes two days above 370.00, I recommend caution.
Summing Up:
Nasdaq breadth is ugly. Last week short-term price momentum indicators broke down to their lowest levels in more than a month. The recovery Friday appears at this time to be only a reflex rally from an oversold condition. With fewer and fewer stocks participating in the advance risk increasing, a short-term correction at any time, even though the major averages are near their highs. Expect increased volatility for the balance of August and into September. Review your portfolio to see if any of your investments are underperforming or if you are overly exposed in any sector. Consider lightening up and move part of your assets to cash, waiting for a safer buying opportunity to develop.
Remember to manage your risk, and your wealth will grow.
If you liked this article, you would love my Free report, Grow and Sustain Your Wealth. Please get it here.

I would love to hear from you. If you have any questions or comments or would like to talk about the market, click here.
Disclaimer: Although the information is made with a sincere effort for accuracy, it is not guaranteed that the information provided is a statement of fact. Nor can we guarantee the results of following any of the recommendations made herein. Readers are encouraged to meet with their own advisors to consider the suitability of investments for their own particular situations and for determination of their own risk levels. Past performance does not guarantee any future results.


Create more wealth in your life
with these simple strategies.
As an added bonus you will also
receive BG’s Updates and Ezine

Discover how to quickly create more well-being in your life with these simple strategies.
As an added bonus you will also
receive BG’s Updates and Ezine

As an added bonus you will receive BG’s Updates and Ezine

All work listed on BonnieGortler.com is licensed under a Creative Commons Attribution - Noncommercial - No Derivative Works 3.0 Unported License.


Free Report:
Grow and Sustain Your Wealth
Discover how to grow your money with these easy, simple steps.

