

10 Simple Tips for Financial Well-Being
07/01/2026
Quadruple witching and the first half of September, often a challenging time for the market, are complete. Friday finished weakly with ten of the eleven sectors down. Seven S&P sectors finished lower the week ending 09/10/21. Five sectors lost less than the SPDR S&P 500 ETF Trust (SPY), down -0.59%. Energy (XLE) +3.20% and Consumer Discretionary (XLY) +0.66% were the leading sectors, while Utilities (XLU) and Materials (XLB) were the weakest, down -2.99% and -3.19%, respectively.
S&P SPDR Sector ETFs Performance Summary
Week Ending 9/17/21
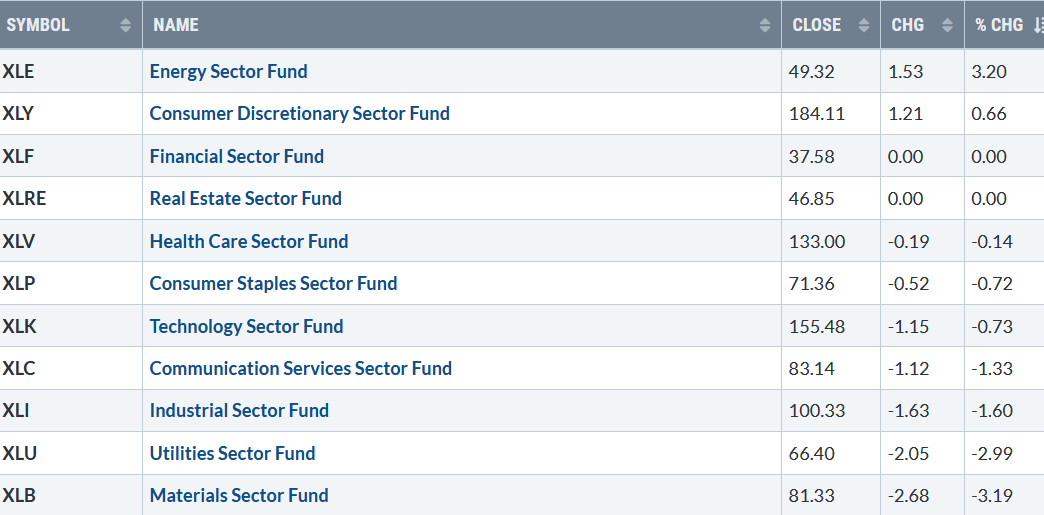
091721 SPY Sector ETFs Performance
Source: Stockcharts.com
Not much change for the major averages. The Dow fell -0.07% for the week; the S&P 500 fell -0.57%, and Nasdaq -0.47%. The Russell 2000 index fared better, gaining +0.47%. In September, the S&P 500 is down eight of the past ten days and off to its worst month since October 2020.
Market breadth for both the NYSE and Nasdaq was negative. The New York Stock Exchange Index (NYSE) had 1670 advances and 1801 declines. Nasdaq had 2266 advances and 2536 declines. Market breadth was better than the previous week but remains worrisome.
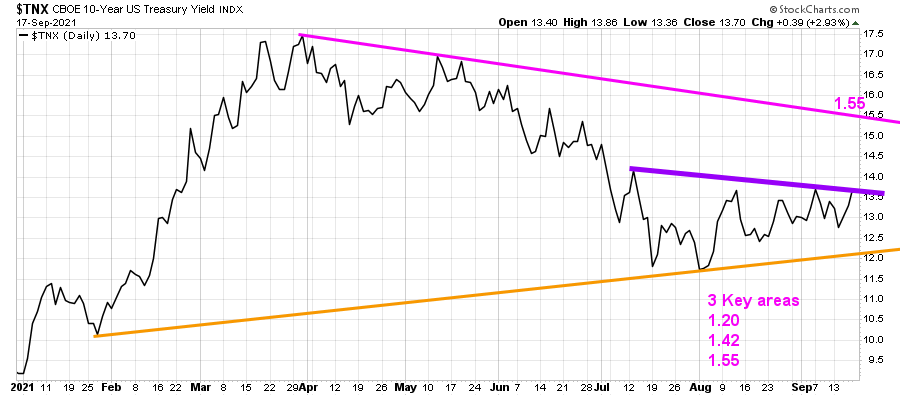
091721 10 Year Yields
Source: Stockcharts.com
10-Year Treasury yields rose last week, closing at 1.371% remaining below mid-August resistance and below the July high of 1.42% (purple line). A close above 1.42% implies yields to test 1.55% (pink line) Figure 1.
Figure 2: Daily New York Stock Exchange (NYSE) New Lows
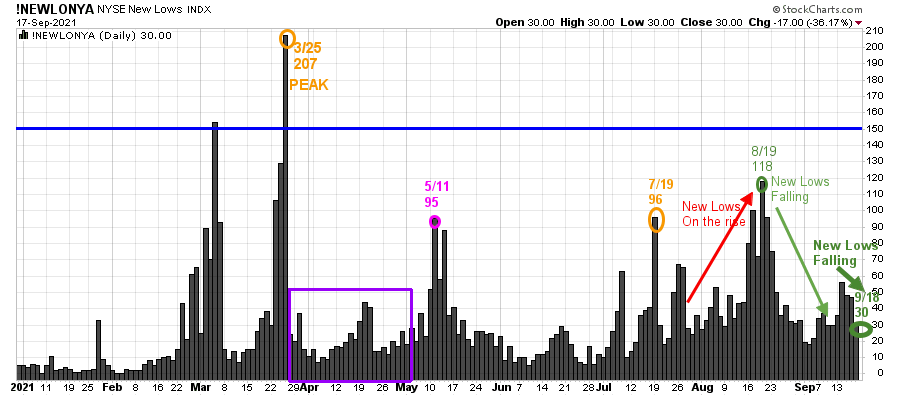
091721 New York New Lows
Source: Stockcharts.com
On 3/25/21, the NYSE New Lows peaked at 207 (orange circle) and immediately contracted (purple rectangle), followed by a jump to 95 on 5/11. New lows then contracted from May to 7/19, before rising to 96 (orange circle), peaking at 118 (green circle) on 8/19, then declined.
Watching New lows on the New York Stock exchange is a simple technical tool that helps awareness about the immediate trend’s direction. Learn more in my book, Journey to Wealth. The market is very strong when the New Lows are below 25 (Very Low Risk, and prices tend to rise). When New Lows are between 25 and 50, the risk is low, and prices tend to rise.
Despite market weakness last week, new lows closed on 9/17 at 30, the same as the previous week. Until new lows begin to rise and close above 150 (blue line), the major averages will likely work their way higher.
“The greatness of a man is not in how much wealth he acquires, but in his integrity and his ability to affect those around him positively.” – Bob Marley
Bonnie’s ETFs to Watch Now
Figure 3: Performance week of 9/10/21 – 09/17/21
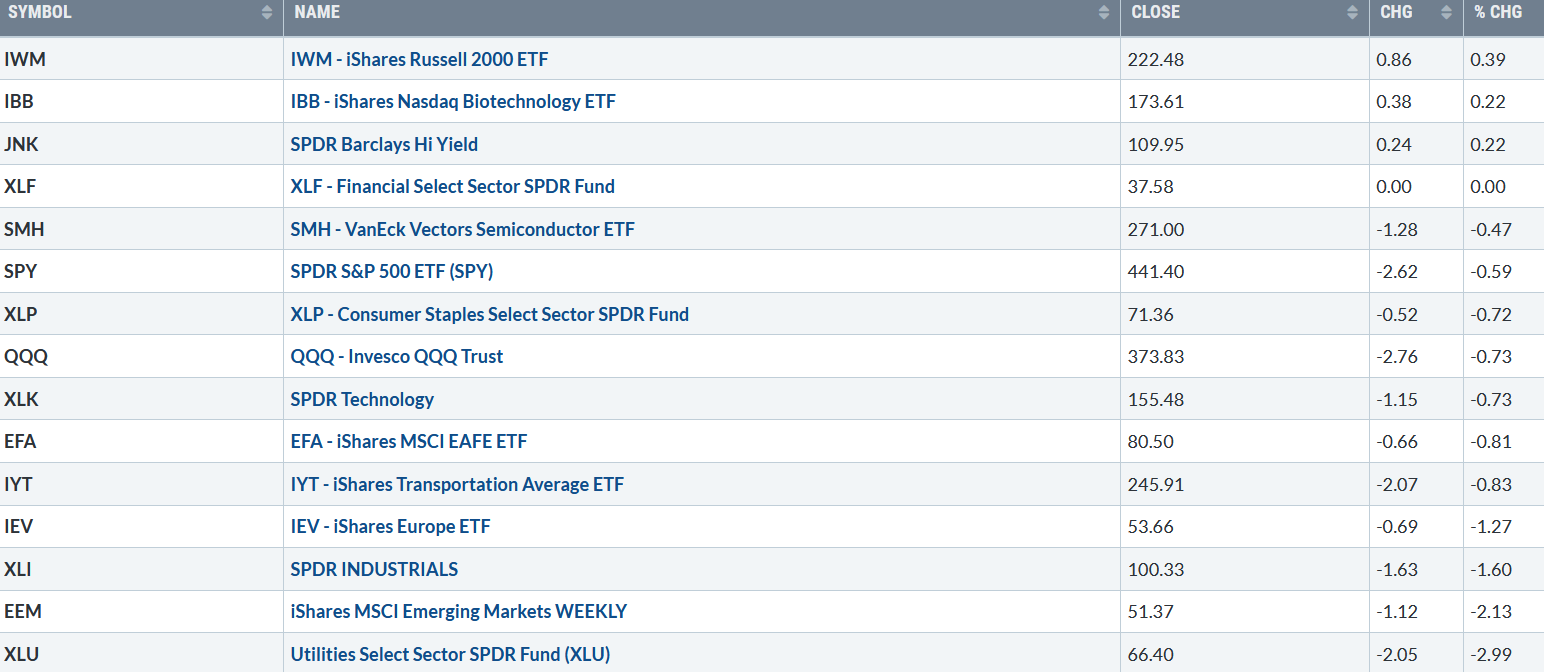
0917 ETFs Weekly Performance
Source: Stockcharts.com
Positives
Negatives
Figure 4: LORD Abbett High Yield Fund
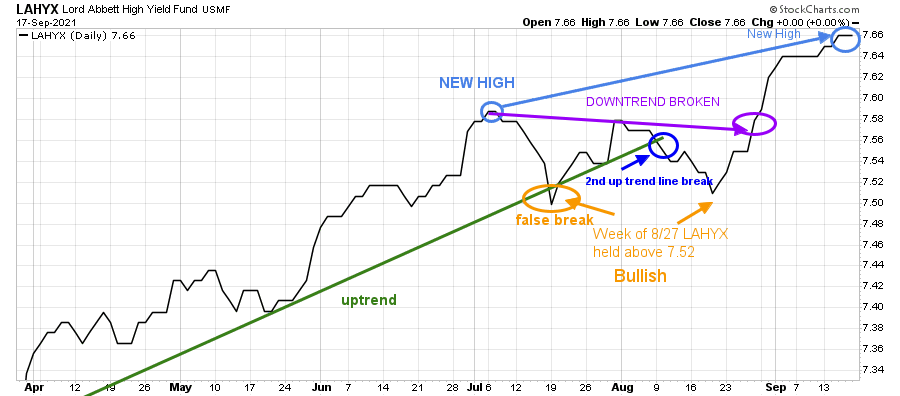
091721 Lord Abbett Hi Yield
Source: Stockcharts.com
Lord Abbett High Yield, an open-end high yield corporate bond fund, broke its uptrend in July, a false breakdown, and then recovered to make a new high.
Hi Yield mutual funds, and Hi Yield ETFs such as HYG and JNK closed higher for the week closing at or near all-time highs despite the decline in U.S. Equities. Continued strength in Hi Yields is positive for the broad market.
On the other hand, if they begin to fall now and take out the July low, it would signify that trouble lies ahead.
Figure 5: Nasdaq New Highs
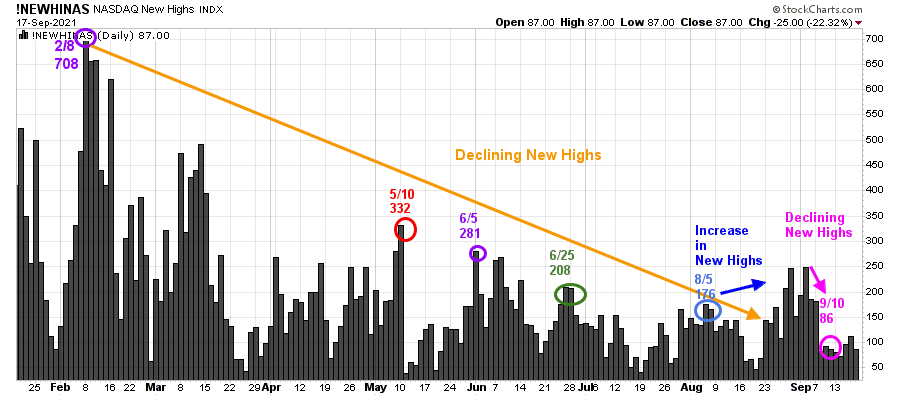
091721 Nasdaq New HIghs
Source: Stockcharts.com
Although the Nasdaq is near all-time highs, New Highs remain well below the peak reading of 708 set on 2/8, closing at a paltry 87 as of 9/17.
Watch if New Highs begin to expand over 250 and then close above the 5/10 high of 332. It will be favorable if new highs increase for the short term. The contraction of new lows is a warning the rally is narrow. Several days this past week, there were more new lows than new highs. If the trend of new lows outpaces new highs, more weakness is likely, and risk will increase of a market correction in the Nasdaq.
Figure 6: Daily Nasdaq Advance-Decline Line
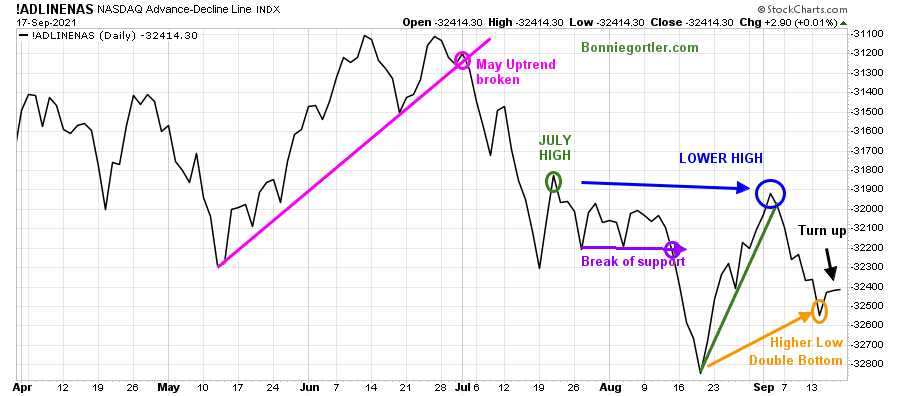
091721 Nasdaq Ad-Line
Source: Stockcharts.com
The Daily Nasdaq-line AD-Line broke down in July, improved in August but failed to take out the July high.
It’s positive the Nasdaq-line AD-Line has made a higher low and turned up forming a bullish rising double bottom (black arrow), an encouraging sign of a successful test of the August lows.
On the other hand, negative breadth breaking the August low would cancel the double bottom pattern and be bearish implying more weakness to follow.
Figure 7: Weekly Nasdaq Advance-Decline Line
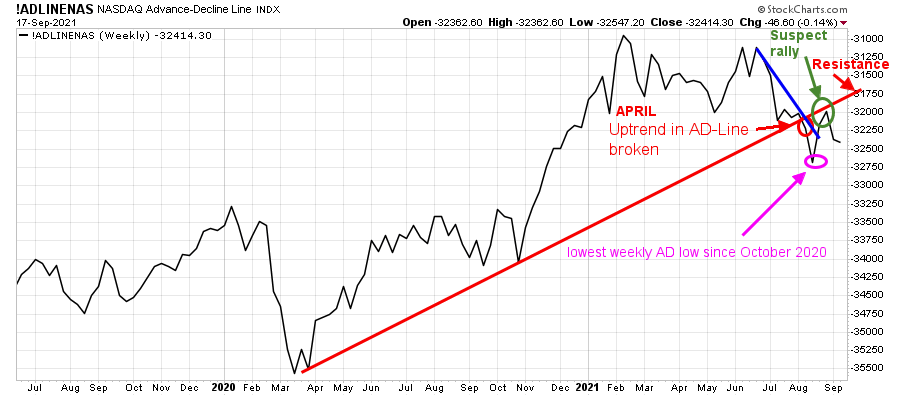
721 Nasdaq weekly Ad-Line
Source: Stockcharts.com
The Nasdaq-line AD-Line closed at its lowest low since October 2020 in early August. A suspect rally followed, failing to get above the uptrend line (red line), where it broke down in July (green circle). Breadth in Nasdaq has been weak in September.
A turn-up penetrating the downtrend line (in red) over resistance is needed for the rally in the Nasdaq to resume. Unless market breadth improves, look for weakness in the near term.
Figure 8: Transportation Average
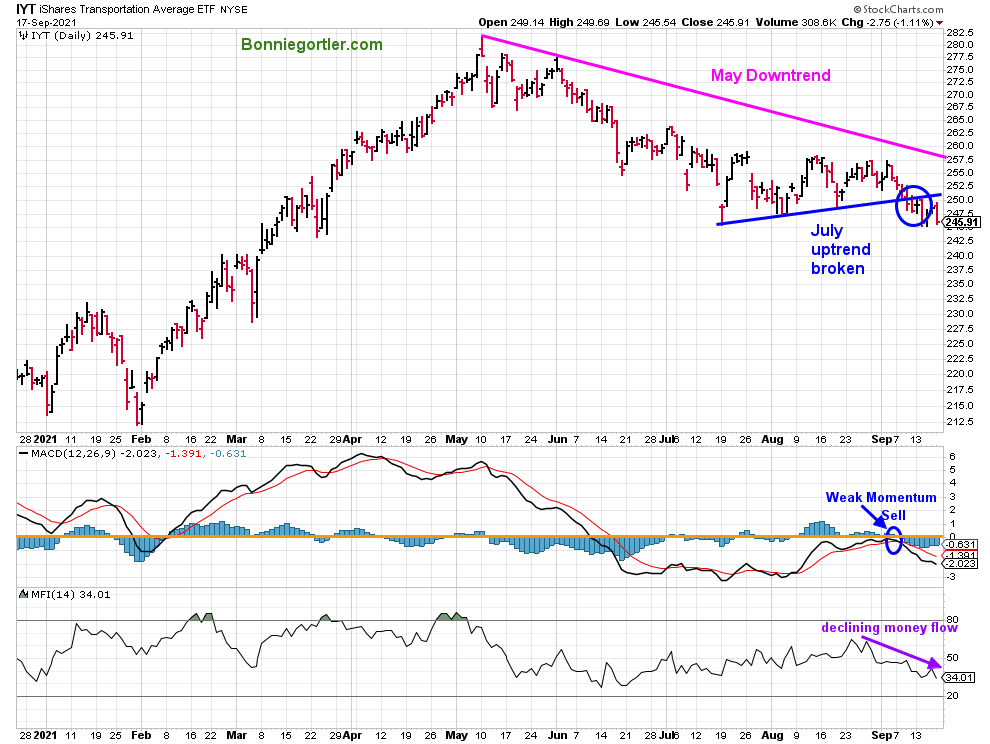
091721 Transportation Average IYT
Source: Stockcharts.com
Transports (IYT) have continued to lag and remain in a downtrend since May. MACD is on a sell, and money flow is declining. Short term objective is between 235.00 and 237.00.
Figure 9: Daily iShares Russell 2000 (IWM) Price (Top) and 12-26-9 MACD (Bottom)
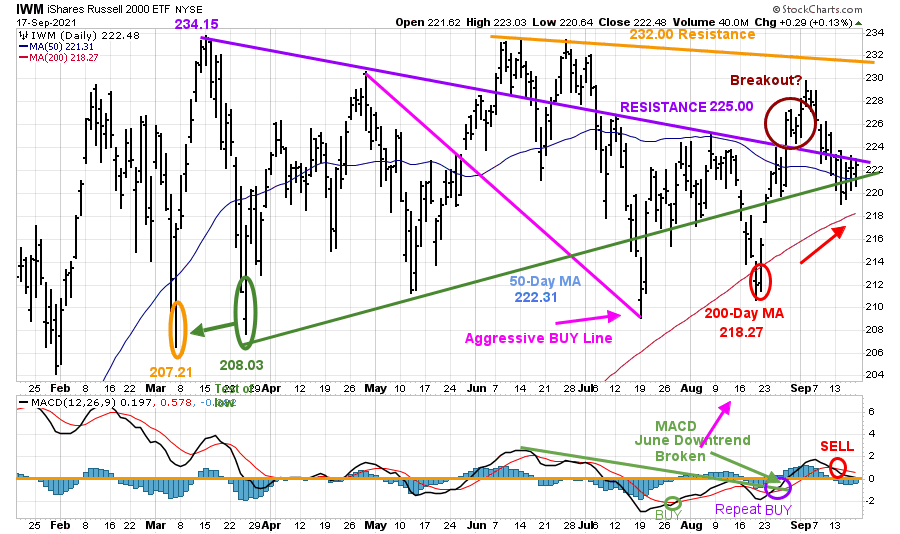
091721 Daily Russell 2000 IWM
Source: Stockcharts.com
The top portion of the chart is the daily iShares Russell 2000 Index ETF (IWM), the benchmark for small-cap stocks, with a 50-Day Moving Average (MA) (blue line) and 200-Day Moving Average (MA), that traders watch and use to define trends.
IWM made a low on 3/5 at 207.21 (orange circle), then peaked at 234.15, followed by a decline to 208.03, successfully testing the March low. In June and July, IWM, after successive attempts to make a new high failed near 232.00 and turned lower, holding above the March low. IWM cleared 225.00 (resistance) at the end of August 225.00 and above its 50-Day MA. However, IWM never closed above resistance at 232.00 and turned down.
IWM ended the week slightly higher at 222.48, closing in a critical support area. Only a few points separate the 50-Day MA and the 200-Day MA. A close below 218.27, the 200-Day Moving Average, would confirm the breakout failed and a potential decline to the March lows of 207.21 and potentially to 198.00.
The bottom half of the chart is MACD (12, 26, 9), a measure of momentum. MACD had no follow-through after breaking the June downtrend and is on a sell.
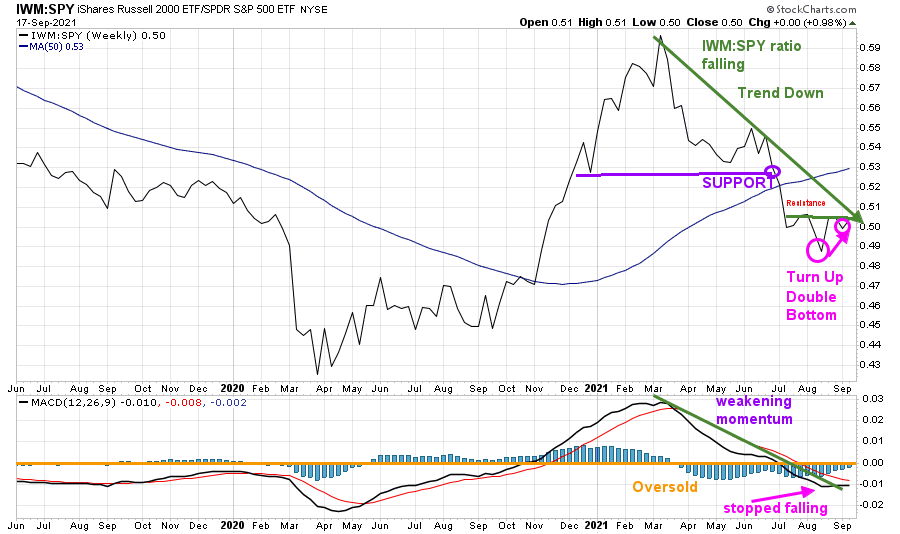
Figure 10: Weekly iShares Russell 2000/S&P 500 (IWM/SPY) Relative Strength Ratio
 Source: Stockcharts.com
The weekly IWM /SPY ratio fell below support in June (purple line).
With the late August gains in IWM, the IWM /SPY ratio turned up. However, it failed to get through the July resistance and the July downtrend. It would be positive if the ratio turns up this week and gets over the August high.
MACD (in the lower chart) stopped falling. Wait for a turn up above resistance for confirmation the decline is over, and the advance will resume.
Figure 11: Weekly iShares Russell 2000 (IWM) Price (Top) and 12-26-9 MACD (Bottom)
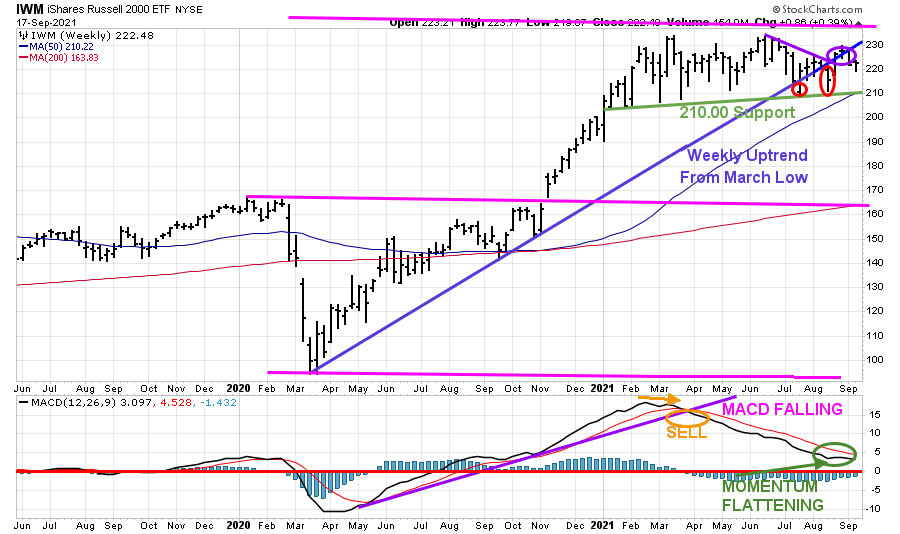
091721 IWM weekly
Source: Stockcharts.com
The Russell 2000 (IWM) (top chart) closed below the March Uptrend (blue line).
Support remains at 210.00 (green line. Resistance is at 232.00. A close below 210.00 would give a downside objective to 198.00 followed by 186.00.
MACD (lower chart) remains on a sell, falling, not yet oversold, and below 0 (red horizontal line) in a favorable buy position. Be patient and wait until a safer pattern develops.
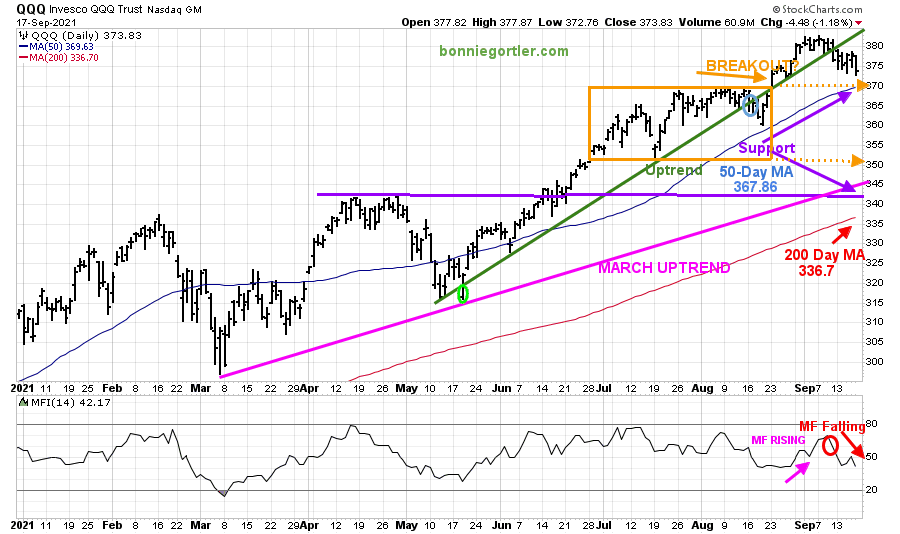
Figure 12: Daily Invesco QQQ Trust Nasdaq (QQQ) Price (Top) Money Flow (Bottom)
091721 QQQ Daily
Source: Stockcharts.com
The chart shows the daily Invesco QQQ, an exchange-traded fund based on the Nasdaq 100 Index with its 50-Day Moving Average and 200-Day Moving Average.
The March uptrend (top chart) remains intact (pink line). In June, QQQ was in a trading range (orange rectangle) and then broke out to the upside in August.
The upside objective remains at 390.00. The next level of support is 370.00, where the QQQ broke out.
In the lower chart, notice the shift in money flow (from rising to falling, no longer supporting a rise in QQQ (red circle). Any close below the March uptrend would likely hit sell stops to test the 200-day MA, which stands at 336.7 at this writing.
A close below 370.00 would imply a test of 350.00 followed by 340.00, where support lies (purple line). If there is weakness in AAPL, expect downside pressure in QQQ, which holds 11.1%, 9/17/21. Source: https://www.etf.com/QQQ#overview
With market breadth holding the lows and double bottoms forming now, as long as QQQ closes above 370.00, give the benefit of the doubt to the bulls.
Caution recommended in the Financial Sector – A potential shift in trend
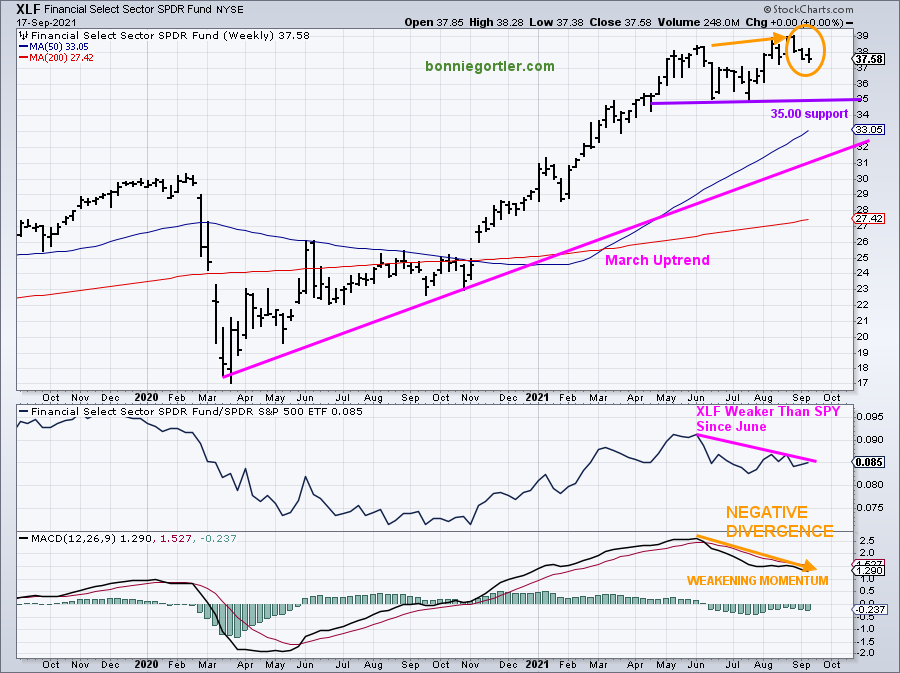
Figure 13: Weekly Financial Select Sector SPDR (XLF) Price (Top), XLF/S&P 500 (XLF/SPY) Relative Strength Ratio (Middle) and Weekly 12-26-9 MACD (Bottom)
091721 XLF Weekly
Source: Stockcharts.com
The technical action in Financials remains worrisome and bears watching. XLF (top chart) closed at or near its low for the third week in a row (orange circle).
In the middle chart, the Financial Sector (XLF) has remained in a downtrend weaker than the S&P 500 since June.
Notice how MACD momentum is weakening in the lower chart, forming a negative divergence, implying a potential trend shift in trend will occur. A negative or bearish divergence forms when the price makes higher highs, and MACD makes a lower high.
Financials have been leaders of the advance, but there is a higher risk of their leadership coming to an end.
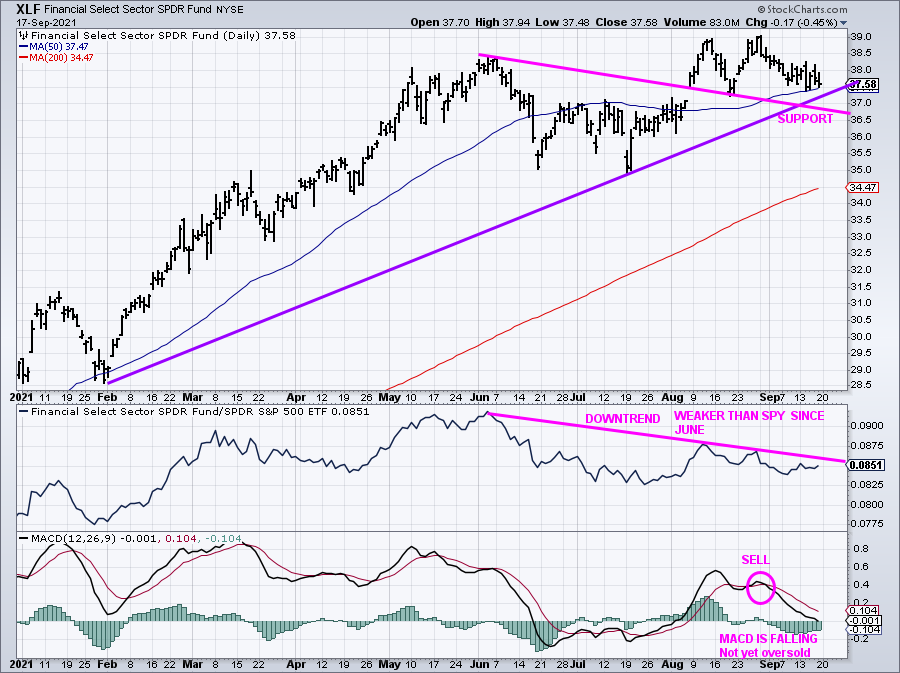
Figure 14: Daily Financial Select Sector SPDR (XLF) Price (Top), XLF/S&P 500 (XLF/SPY) Relative Strength Ratio (Bottom)
091721 XLF Daily
The Financials (XLF) in the top chart was flat for the week closing at 37.58, remaining in its daily uptrend since February and slightly above its 50-Day Moving Average. Support is between 36.60 and 37.00.
In the middle chart, the Financial Sector (XLF) has remained in a downtrend weaker than the S&P 500 since June, the same as the weekly chart.
In the lower chart, notice how MACD continues to fall. Risk is considered high in the near term. With a bearish weekly chart, until there is turnup and a new buy, new entries should be delayed.
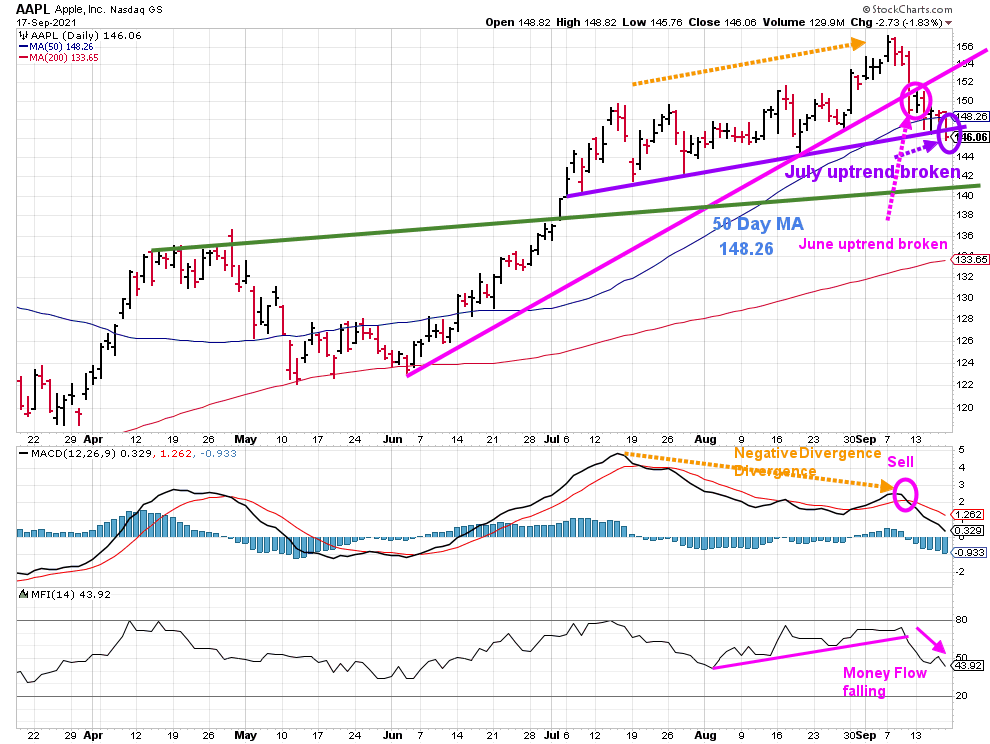
Is AAPL breaking down?
Figure 15: Apple (AAPL) Daily
091721 AAPL Daily
Apple (AAPL) made a high on 9/7/21. Since the high AAPL has moved lower, AAPL broke its uptrend (pink circle), closing at 146.06 below the 50-day Moving Average. Not a positive sign for the broad market.
Support is at 140.00, followed by 133.00 and 124.00. Resistance is at 150.00 and 154.00.
MACD is on a sell. MACD and Money Flow are falling, no signs yet of a bottom.
AAPL shares are in 320 U.S.- traded ETFs, including the largest holding in the SPDR S&P 500 (SPY), and the largest ETF allocation to AAPL is the Technology Select Sector SPDR Fund (XLK), 22.07%. Source: https://www.etf.com/stock/AAPL
Summing Up:
Market breadth continues to be a concern. However, it was not as negative as in July and August. Favorable double bottoms are forming as fear builds a market correction, and even a possible crash will occur. Now that quadruple expiration is complete, if support levels hold in the near term, new lows don’t expand, and investors step in to buy as they have done all year, end-of-quarter window dressing may begin early. The next few weeks could surprise to the upside if the major averages, Apple (AAPL), Russell 2000 (IWM), and Transports (IYT), stabilize, and there is no follow-through to Friday’s weakness.
Remember to manage your risk, and your wealth will grow.
If you liked this article, you would love a free wealth strategy session with me. Get it here.
I would love to hear from you. If you have any questions or comments or would like to talk about the market, click here.
Disclaimer: Although the information is made with a sincere effort for accuracy, it is not guaranteed that the information provided is a statement of fact. Nor can we guarantee the results of following any of the recommendations made herein. Readers are encouraged to meet with their own advisors to consider the suitability of investments for their own particular situations and for determination of their own risk levels. Past performance does not guarantee any future results.


Create more wealth in your life
with these simple strategies.
As an added bonus you will also
receive BG’s Updates and Ezine

Discover how to quickly create more well-being in your life with these simple strategies.
As an added bonus you will also
receive BG’s Updates and Ezine

As an added bonus you will receive BG’s Updates and Ezine

All work listed on BonnieGortler.com is licensed under a Creative Commons Attribution - Noncommercial - No Derivative Works 3.0 Unported License.


Free Report:
Grow and Sustain Your Wealth
Discover how to grow your money with these easy, simple steps.

