

10 Simple Tips for Financial Well-Being
07/01/2026
It’s been a strong start of November after the low made in October. The S&P 500 Index has completed its 6th consecutive weekly gain, and Nasdaq it’s seventh. Defensive sectors that were leading the market are underperforming in November, implying investors are more optimistic and willing to take on more risk. However, the recent rise has made technical indicators overbought, implying the short term needs to be monitored. Sometimes when the market is overbought, the best rallies occur. Investors don’t want to miss the rally. On the other hand, sometimes a breather is necessary, and the tape action begins to give warning signs a retracement is needed.
It’s troubling that market breadth has stopped improving, and market sentiment is now showing a high level of optimism (a contrary indicator), implying the short term is vulnerable for a pullback. However, support levels remain intact, intermediate patterns are favorable, and it is bullish investors are shifting out of defensive sectors and rotating into more riskier assets. For now, the bulls remain in control.
Where do we go from here? Keep an eye on the action in Biotechnology (XBI).
Figure: Weekly Biotechnology (XBI) Price (Top) and 12-26-9 MACD (Bottom)
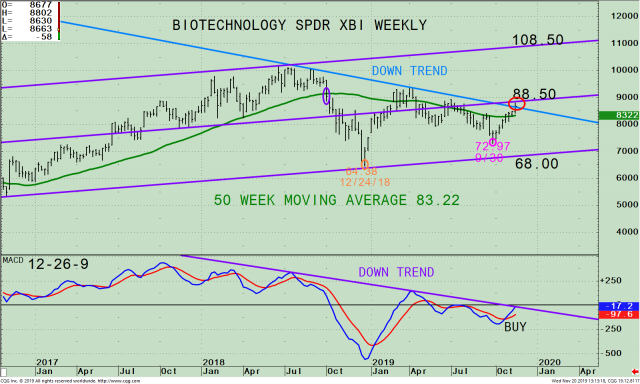
The top portion of the chart shows the weekly (intermediate-term) SPDR Biotechnology ETF (XBI)1 and its active price channels (purple lines) with a 50-week moving average (red line) that traders watch and use to define trends.
During a lengthy advance, investors tend to be more willing to invest in risky assets. XBI was in an uptrend where XBI was making higher highs and higher lows in 2017 but fell below its 50-Week Moving Average (purple circle) in October 2018. In April 2018, XBI peaked, starting a weekly downtrend (blue line). XBI fell sharply, falling over 17% until finally making a low on 12/24/18. XBI rose in early 2019 and has had a few penetrations of its 50 Week Moving Average (green line) but was unable to break its downtrend. However, it appears that money is now rotating into Biotechnology. If XBI continues higher, this is a sector to be watched for guidance that the present rally will continue.
In my opinion, the tape action in XBI is very encouraging. It’s bullish that on 11/19/19, XBI has broken above the downtrend intraday coinciding with XBI trading slightly under the mid-channel at 88.50. The XBI has met the requirement of closing above the 50 Week-Moving Average for two consecutive weeks, as mentioned in my S&F article “Speculative Buying Opportunity in Biotechnology” (XBI) on 9/19.
The thrust from the low is gaining momentum, with more than half of its gains occurring since the low on 10/2 at 72.97. The resistance is at 88.50. A weekly close above will imply even further gains, giving an upside target to 108.50. With the upside thrust that has occurred over the last several weeks, a period of base building may be needed if XBI stalls now and is unable to get through the mid-channel. Support is at 85.00, which I believe will hold if the major averages are stable. The next key support is at 81.00.
The bottom half of the chart is the 12, 26, 9-week MACD, a technical indicator that measures momentum. MACD gave a new buy and is very close to breaking its downtrend from July (purple line). An upside penetration of the downtrend would imply downside momentum is complete. I am expecting the downtrend to be broken, confirming the breakout in XBI over the next few trading sessions.
Figure 2: Weekly SPDR Biotechnology (XBI)/S&P 500 Index (SPY) Ratio (top) and 12-26-9 MACD of this Ratio (bottom)
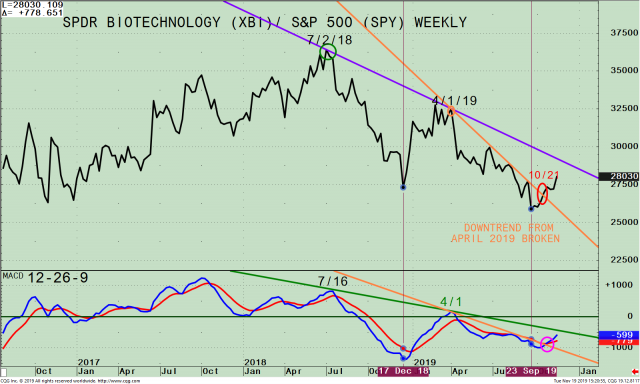
The top part of the chart is the weekly SPDR Biotechnology (XBI)/ S&P 500 Index Ratio (XBI /SPY). A rising line means the XBI is stronger, and if falling, the SPY is stronger. The XBI/SPY ratio peaked on 7/2/2018 (green circle) and has been trending down. In December of 2018, the ratio bottomed and then rose until April 2019 (red circle), before weakening and turning down. In September of 2019, the ratio made a lower low continuing to underperform the S&P 500, suggesting the biotechnology sector was still out of favor by investors until 10/21 (circled in red). The XBI/SPY ratio is now rising, breaking the smaller downtrend from 4/1, a positive sign downside momentum is coming to an end. If the XBI continues gaining strength compared to the S&P 500 and can penetrate the longer downtrend from 7/2/18, this would imply downside momentum is completed.
The lower portion of the chart is the MACD of the XBI/SPY ratio. MACD is on a buy, rising, and has broken the shorter-term downtrend (orange line) from 4/1 and is also close to breaking its longer downtrend from 7/16/18 (green line). A break of the longer-term downtrend will confirm Biotechnology is likely to be a leading sector in the coming weeks to months.
Figure 3: Monthly Biotechnology (XBI) Price (Top) and 12-26-9 MACD (Bottom)
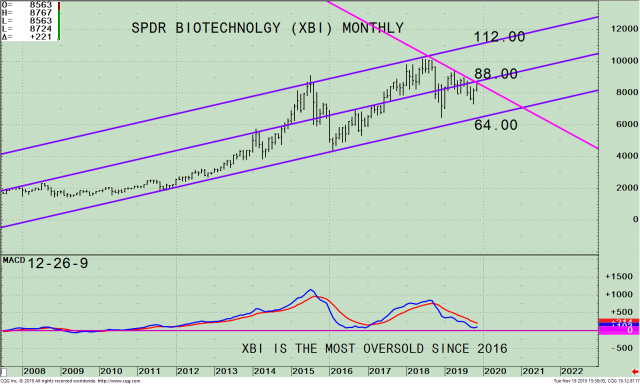
The top portion of the chart shows the Monthly (long-term) SPDR Biotechnology ETF (XBI) and its active price channels (purple lines). Notice XBI is trading at 87.24 on 11/19, slightly under its mid-channel at 88.00, the same area as weekly mid-channel resistance. The XBI remains in a monthly downtrend. However, it’s close to confirming the end of the downtrend for the long term if XBI has a monthly close above 88.00.
Summing up
The downtrend in the biotechnology sector appears to be coming to an end. The downtrend in XBI on the weekly chart was slightly penetrated on 11/19. Biotechnology is gaining relative strength compared to the S&P 500, and if these phenomena continue, this is bullish for the intermediate-term and is bullish for the broad market. If the XBI has a weekly close above 88.50 or a monthly close over 88.00, this would confirm the downtrend is over. With the recent improvement and the favorable patterns developing, I am optimistic the XBI will continue to show strength, and it’s likely a confirmed trend change could occur in November. On the other hand, if XBI falters and turns down and closes below the 10/2 low of 72.97, this would negate my positive outlook.
1 XBI is an equal-weight ETF of large U.S. company stocks in the biotechnology sector that is extremely volatile. As of 11/18/19, the top five holdings of XBI are Seattle Genetics Inc (SGEN) 2.59%, Arrowhead Pharmaceuticals Inc. (ARWR) 2.54%, AbbVie Inc. (ABBV), 1.99%, Medicines Co (MDCO) 1.94%, and Intercept Pharmaceuticals Inc. (ICPT) 1.91% totaling 10.97%. Source: https://etfdb.com/etf/XBI/
Sign up for a FREE 3 issue trial of SYSTEMS AND FORECASTS Click here

If you like this article you will love my
Free EBook Grow Your Wealth and Well-Being
.
******Article first published in Systems and Forecasts on November 20, 2019
Disclaimer: Although the information is made with a sincere effort for accuracy, it is not guaranteed that the information provided is a statement of fact. Nor can we guarantee the results of following any of the recommendations made herein. Readers are encouraged to meet with their own advisors to consider the suitability of investments for their own particular situations and for determination of their own risk levels. Past performance does not guarantee any future results.


Create more wealth in your life
with these simple strategies.
As an added bonus you will also
receive BG’s Updates and Ezine

Discover how to quickly create more well-being in your life with these simple strategies.
As an added bonus you will also
receive BG’s Updates and Ezine

As an added bonus you will receive BG’s Updates and Ezine

All work listed on BonnieGortler.com is licensed under a Creative Commons Attribution - Noncommercial - No Derivative Works 3.0 Unported License.


Free Report:
Grow and Sustain Your Wealth
Discover how to grow your money with these easy, simple steps.

