

10 Simple Tips for Financial Well-Being
07/01/2026
The major averages rose sharply in April from a deep oversold short term technical condition that developed in March. For the week ending 4/17, the S&P 500 gained +3.04% the Dow up +2.21%, and the Nasdaq gained +6.09%. The laggard for the week was the Russell 2000 down -1.4%, continuing to underperform the S&P 500, not a favorable sign of a healthy stock market. Weekly breadth was weak with -463 net declines on the New York Stock Exchange. On the other hand, the Nasdaq breadth was positive with +402 net advances.
The technical picture for the short-term is in question. The technical indicators are now overbought, no longer oversold as they were earlier in April that fueled the broad market higher.
If you are an active trader in this market climate, it’s a good idea to trade with smaller positions because of the wide intraday volatility. Simplify your strategy, be disciplined, and follow your plan so that you don’t make decisions based on emotions. Have your stops in place. Adjust your stops as prices rise, keeping your winners longer, letting your gains run. However, protect your profits while limiting your losses, if the trade goes against you. When buying, make sure you trade in the direction of the trend. Look for a pattern of higher highs and higher lows so that your investment is in an uptrend. Avoid buying stocks or exchange-traded funds (ETFs) that are out of favor and show no technical sign that momentum is improving.
Where do we go from here from a charting perspective? Watch VIX and QQQ.
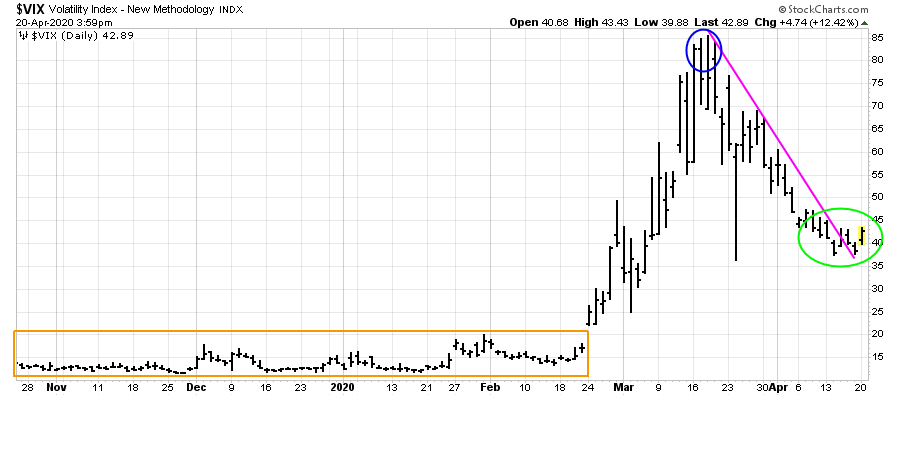
Figure 1: CBOE Volatility Index (VIX).
The chart above is the CBOE Volatility Index (VIX), a measure of fear, a barometer for market uncertainty. As the market was falling sharply, VIX began to rise dramatically to above 80.00, hitting an extreme of 85.47 (blue circle), on 3/18/2020. As April progressed, VIX trended down (pink line) towards 35.00 (green circle), falling to an intraday low of 37.31 on 4/1, less than half, closing at 42.89 on 4/20.
In the present environment, VIX remains greater than its historical norm, suggesting high intraday volatility is not over. VIX is above last year’s lows made in November 2019 of 11.42 and remains higher than in early February’s range of 15.00-20.00 when volatility was low, (orange rectangle). I am recommending not to get complacent now. Look for 2-4% intraday moves in the major averages and 3-7% swings or greater in stocks.
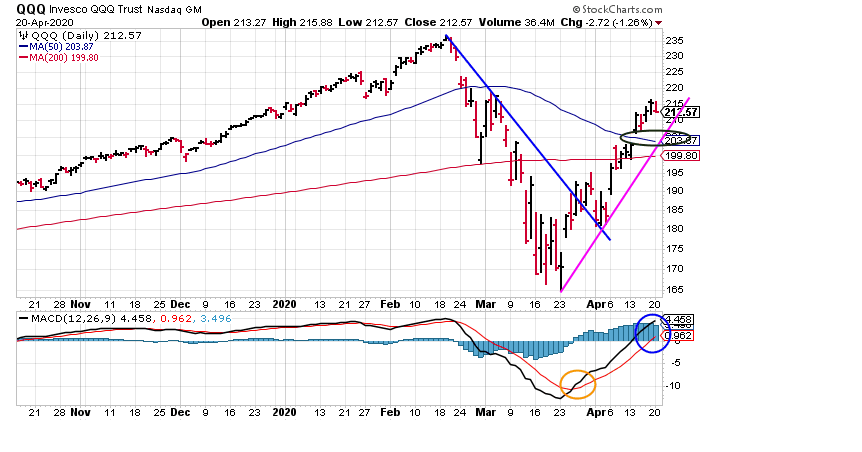
Figure 2: Daily Invesco QQQ Trust Nasdaq (QQQ) Price (Top) and 12-26-9 MACD (Bottom)
The top part chart shows the daily Invesco (QQQ)1, an exchange-traded fund based on the Nasdaq 100 Index with its 50-Day Moving Average and 200-Day Moving Average (***See below for top holdings).
QQQ broke the downtrend shifting the short-term trend to positive in late March. Most times, after a significant thrust down combined with a deeply oversold condition, the first rally fails. However, this was not the case. QQQ did not have a pullback of any magnitude and rose sharply higher quickly.
As of 4/20, QQQ remains in an uptrend. Technology stocks led the market higher on the rebound from the March lows. QQQ closed at 212.74. Its positive QQQ is above the 50-Day MA at 203.87 (blue line), and the 200-Day MA is at 199.80 (redline). Both Moving Averages are acting as support.
It will be a worrisome sign if QQQ closes below the 50-Day MA, which also corresponds to a gap that has not been filled (black circle). A close below the 200-Day MA at 199.80, would also break the uptrend and likely to trip the sell stops.
The lower portion of the chart is the 12-26-9 Daily MACD, a measure of momentum. The rally generated a MACD buy signal (orange circle), a timely buy in late March. However, unfortunately, there was no double bottom or positive divergence to confirm the buy.
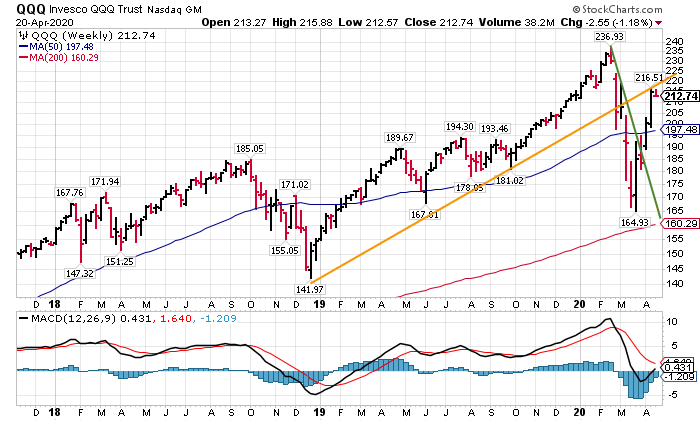
Figure 3: Weekly Invesco QQQ Trust Nasdaq (QQQ) Price (Top) and 12-26-9 MACD (Bottom)
The top part chart shows the Weekly Invesco (QQQ) Trust. QQQ rallied sharply in April, and the intermediate trend shifted to positive. Its bullish QQQ broke the downtrend (orange line), now in an uptrend (green line), and at the same time penetrated its 50-week Moving Average (MA) at 197.48.
I thought it was best to have patience waiting for a pullback, which never materialized as it did during October 2008. It appears that QQQ may have peaked on 4/20, unable to get through the overhead resistance between 218.00 and 220.00 stalling at the uptrend (orange line). More time is needed to know for sure.
The lower portion of the chart is the 12-26-9 Weekly MACD, a measure of momentum. MACD has improved but remains on its recent sell. It is likely to take several more weeks for a confirmed buy to take place.
I recommend keeping an eye on the top three holdings in the QQQ (see below***) as a clue to know if QQQ has peaked or if more strength in technology lies ahead. The top three holdings of QQQ, Microsoft (MSFT), Apple (AAPL), and Amazon (AMZN) all closed above their 50-Week Moving Average, a positive sign. Amazon is the strongest of the three stocks, making a new all-time high on 4/17 but unable to close above on 4/20.
Key Support Levels:
QQQ-205.00, MSFT-168.00, AAPL- 273.00 and AMZN 2300.00.
I would expect selling to begin in QQQ sooner rather than later if the support levels above are broken on a closing basis.
In Sum:
The downside thrust in March created a deeply oversold condition that provided fuel for the April rally led by Technology stocks. The short-term technical momentum indicators are now overbought, and the major averages appear to have stalled at overhead resistance. Watch the top three holdings in QQQ if they close below support. If they do the odds are likely that the broad market will follow. With volatility as measured by VIX, higher than 20.00, the risk remains high.
I would love to hear from you. If you have any questions or comments, click here or Email me at Bonnie@bonniegortler.com
1The QQQ includes 100 of the largest domestic and international nonfinancial companies listed on the Nasdaq. As of 4/17/20, the top three holdings are Microsoft Corp (MSFT) 11.94%, Apple (AAPL) 11.26%, Amazon.com Inc. (AMZN) 10.55%, totaling 33.75. Source: https://www.etf.com/QQQ#overview
If you like this article, you will love my Free Report Grow and Sustain Your Wealth. Get it today. Visit Here.

All charts are from stockcharts.com (4/20)
Disclaimer: Although the information is made with a sincere effort for accuracy, it is not guaranteed that the information provided is a statement of fact. Nor can we guarantee the results of following any of the recommendations made herein. Readers are encouraged to meet with their own advisors to consider the suitability of investments for their own particular situations and for determination of their own risk levels. Past performance does not guarantee any future results.


Create more wealth in your life
with these simple strategies.
As an added bonus you will also
receive BG’s Updates and Ezine

Discover how to quickly create more well-being in your life with these simple strategies.
As an added bonus you will also
receive BG’s Updates and Ezine

As an added bonus you will receive BG’s Updates and Ezine

All work listed on BonnieGortler.com is licensed under a Creative Commons Attribution - Noncommercial - No Derivative Works 3.0 Unported License.


Free Report:
Grow and Sustain Your Wealth
Discover how to grow your money with these easy, simple steps.

