

10 Simple Tips for Financial Well-Being
07/01/2026
Positive momentum has slowed down in US equities and in overseas markets. Volatility is on the rise; there are more intra-day swings of 1-2% on the major averages. On up days fewer stocks are participating in the rally as evidenced by very few stocks making new highs. Our equity models remain on a buy, suggesting any decline should be limited. The longer-term trend (monthly charts) remains in intact. However, there are some warning signs of a potential price trend shift that could be developing.
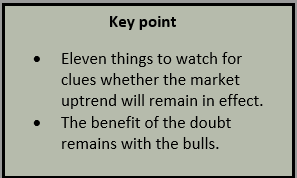
This article presents 11 items to watch for guidance if the market will continue to advance or falter.
11 Observations to Monitor In the Near Term to Avoid a Trend Shift
The SPDR S&P 500 (SPY) Daily Price Channel, 200 Day Simple Moving Average and 12-26-9 MACD
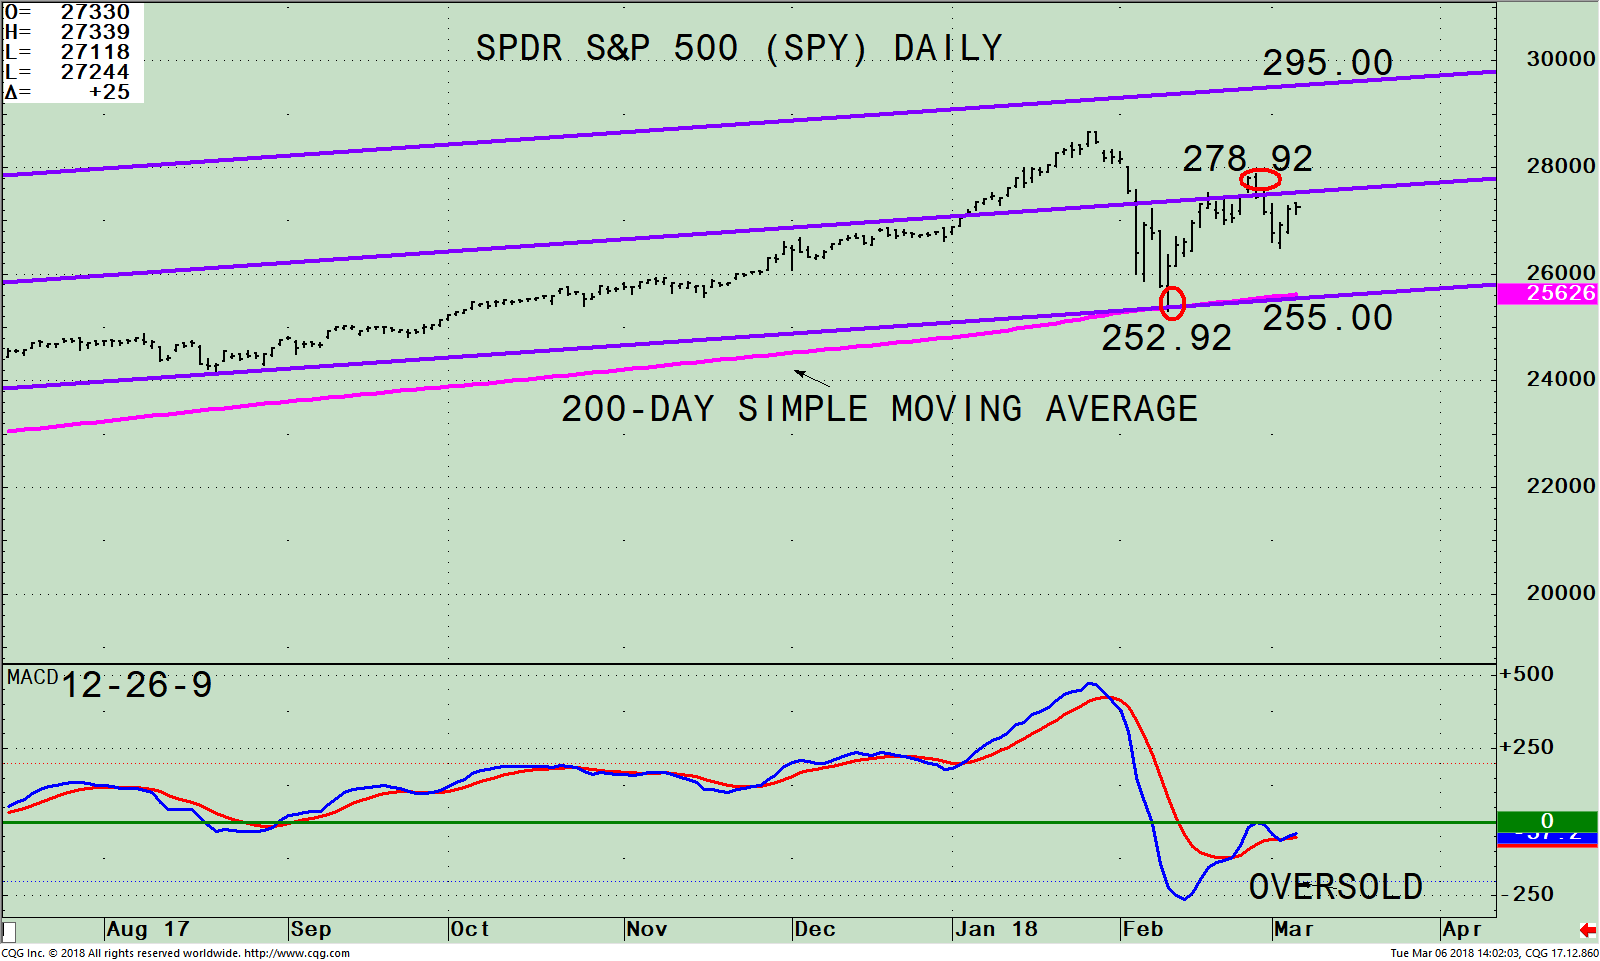
The top part of the chart is the SPDR S&P 500 (SPY) ETF and its daily trading channel and the 200-day simple moving average (pink line). The SPY includes 500 stocks of the largest companies in the U.S. The top 5 sectors as of 03/02/18 are Technology (25.17%), Financials (14.94%), Healthcare (13.82%), Consumer Discretionary (12.68 %), and Industrials (10.1%) totaling 76.71%.
The Technology sector is the largest holding of the SPY. All five sectors made highs in January. However, none of the other sectors besides Technology made highs in February showing the rally is getting narrower in scope.
On the contrary, the SPY rose 10.3% (252.92-278.92) off its February 9 intraday low in only 10 days before stalling near resistance. This is bullish action, that appears more than a reflex rally to alleviate an oversold condition. After the rise, the SPY has declined towards the recent low. This rally could be the start of another advance towards the highs. However, on the contrary it would be negative if the SPY closes below the 200-day simple moving average (pink line). This line is acting as support and is where the traders most likely have their stops.
The SPDR S&P 500 (SPY) Weekly Price Channel and 12-26-9 MACD
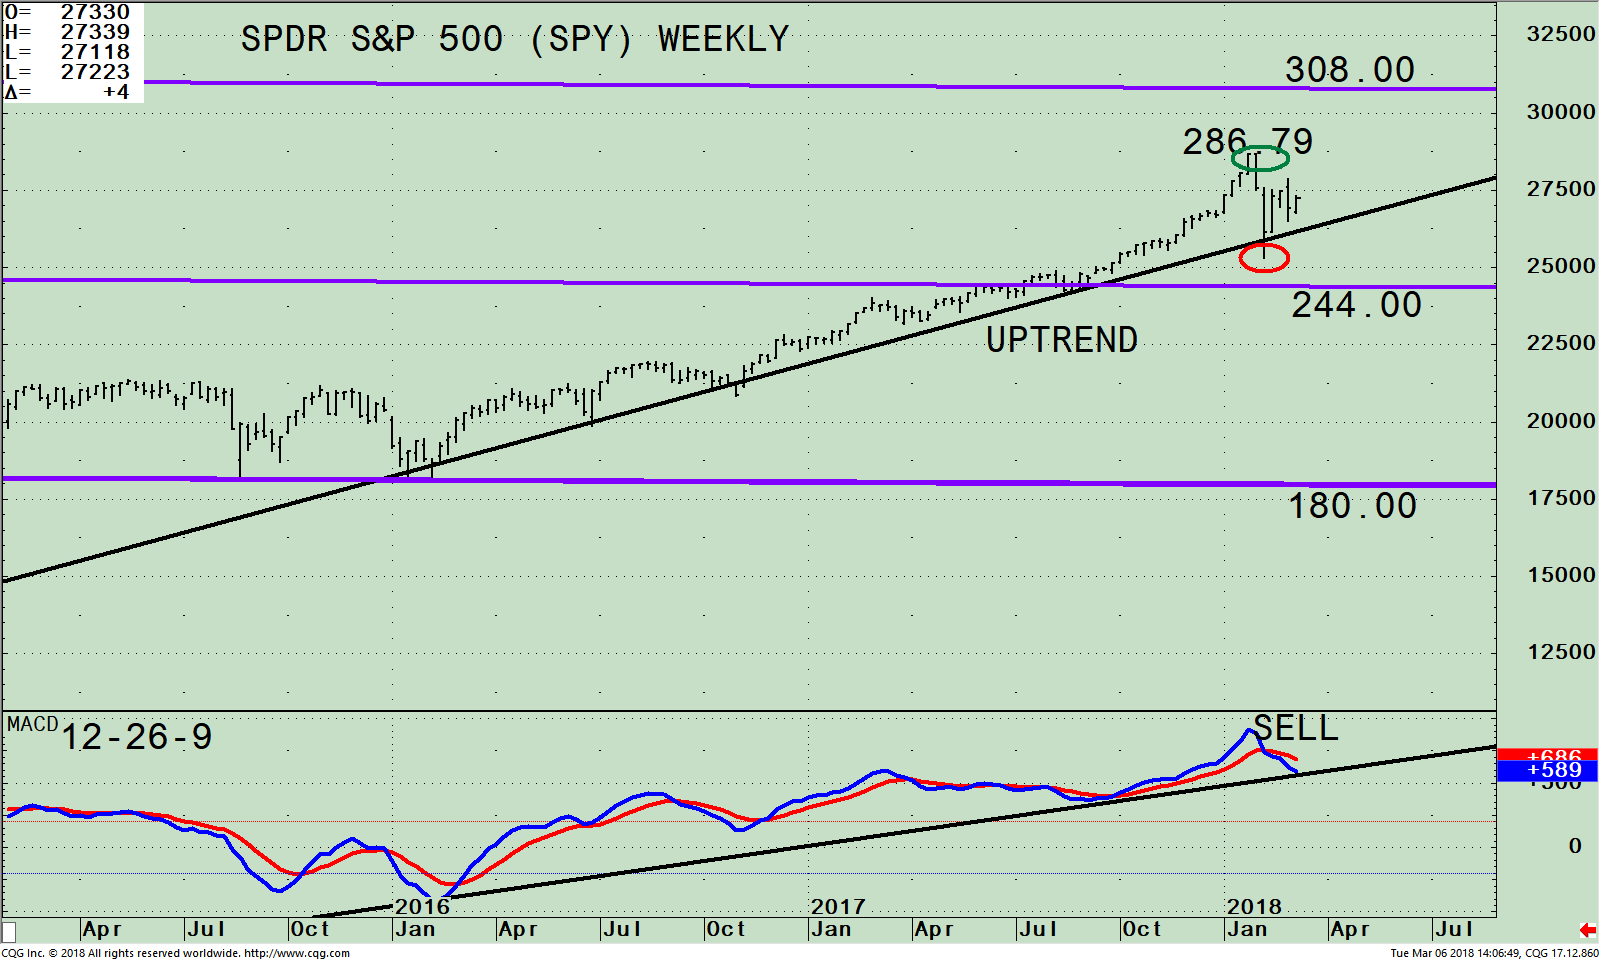 The top part of the chart is the SPDR S&P 500 (SPY) ETF and its active weekly (intermediate) trading channel. The SPY uptrend that began in February 2016 (black line) remains in effect. There has been only a minor downside penetration of this trendline (red line).
There is a chance that this week could have been the successful test of the low at 252.92 on February 9. For the test of the low to be complete, the SPY would have to rise the next several weeks and get through the old highs at 286.79. If this occurs then a potential rally towards the upper channel objective at 308.00 is possible.
Below the low at 252.92 (red circle) implies more weakness towards the middle channel at 244.00. In the most bearish case, which is not likely, the downside objective is 180.00.
The lower portion of the chart is the 12-26-9 MACD, a measure of momentum. MACD generated a sell in late January. MACD confirmed the SPY high. Therefore, the first MACD sell after a rise for almost two years would not normally be a top, only a warning of sign that momentum is not sustainable. It’s positive the uptrend in MACD remains in effect. If MACD turns up, another test of the highs is likely. However, a break below the uptrend would be a warning sign of weakness and increased risk.
To Sum Up:
It’s not clear cut if the test of the low is complete or if more time base building is needed. Momentum has been diminishing giving warnings a potential price trend shift could be developing. Stock and sector selection could be more of a challenge going forward. Some base building over the next several weeks to months might be necessary before further gains. For now, the benefit of the doubt goes to the bulls. Time will tell.
I would love to hear from you. Please call me at 516-829-6444 or email at bgortler@signalert.com to share your thoughts or ask me any questions you might have.
Sign up for a FREE 3 issue trial of SYSTEMS AND FORECASTS Click HERE
******Article published by Bonnie Gortler in Systems and Forecasts March 7, 2018
Disclaimer: Although the information is made with a sincere effort for accuracy, it is not guaranteed that the information provided is a statement of fact. Nor can we guarantee the results of following any of the recommendations made herein. Readers are encouraged to meet with their own advisors to consider the suitability of investments for their own particular situations and for determination of their own risk levels. Past performance does not guarantee any future results.


Create more wealth in your life
with these simple strategies.
As an added bonus you will also
receive BG’s Updates and Ezine

Discover how to quickly create more well-being in your life with these simple strategies.
As an added bonus you will also
receive BG’s Updates and Ezine

As an added bonus you will receive BG’s Updates and Ezine

All work listed on BonnieGortler.com is licensed under a Creative Commons Attribution - Noncommercial - No Derivative Works 3.0 Unported License.


Free Report:
Grow and Sustain Your Wealth
Discover how to grow your money with these easy, simple steps.

