

10 Simple Tips for Financial Well-Being
07/01/2026
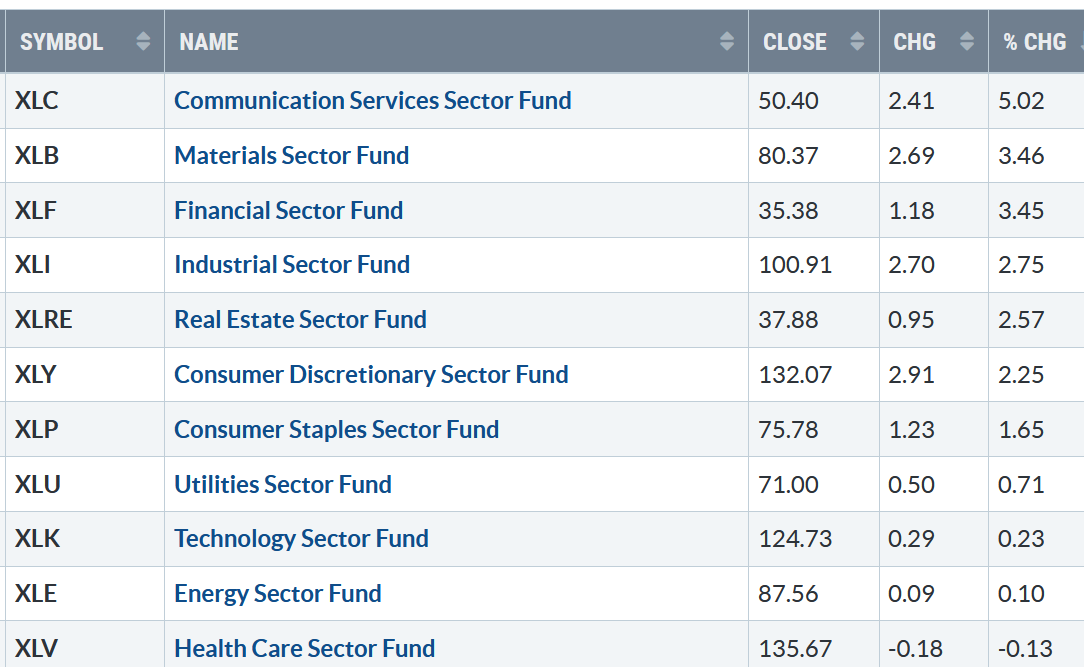
During the first week of 2023, ten of the eleven S&P SPDR sectors were higher. Communications Services (XLC) and Materials (XLB) were the leading sectors, while Energy (XLE), and Healthcare (XLV), were the weakest, and the SPDR S&P 500 ETF Trust (SPY) was up +1.48%.
S&P SPDR Sector ETFs Performance Summary
12/30/22 – 1/6/23
010623 SPDR Sectors
Source: Stockcharts.com
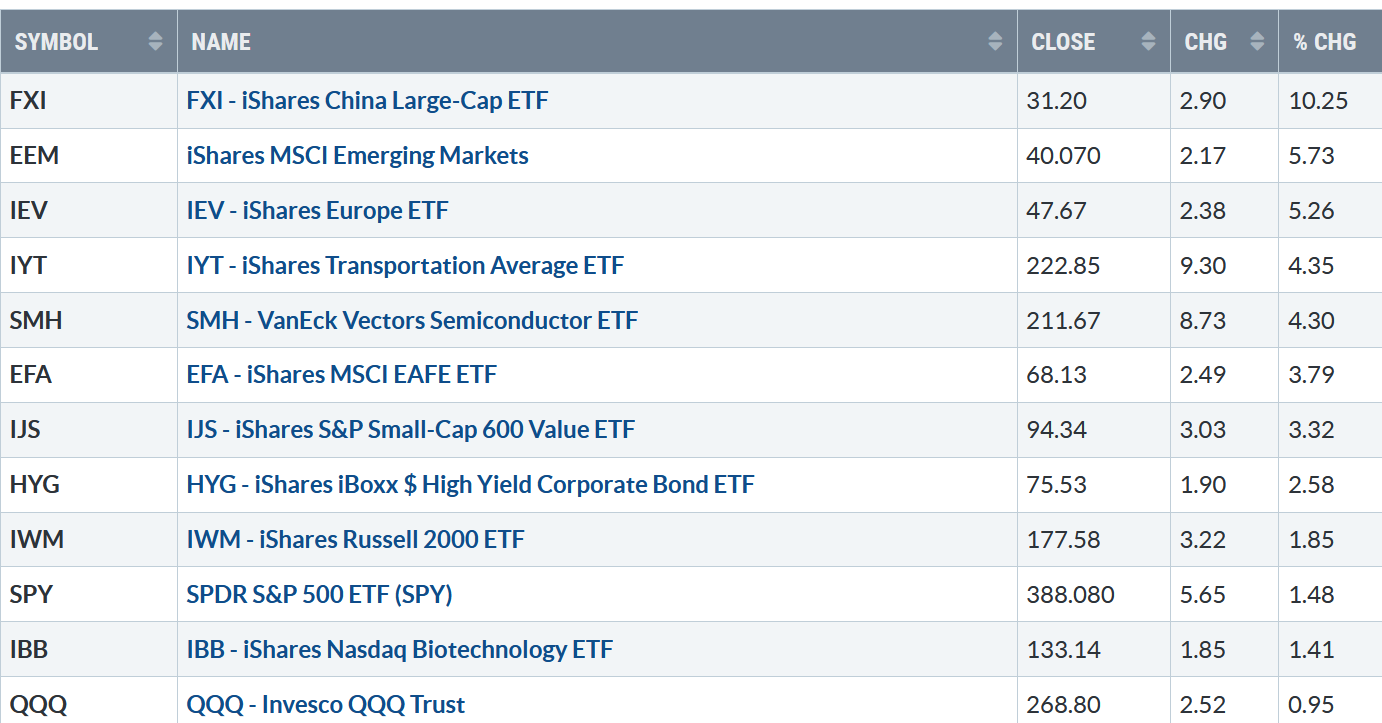
Figure 2: Bonnie’s ETFs Watch List
Performance 12/30/22 – 1/6/23
010623 Week ETFs
Source: Stockcharts.com
International markets led by China, Europe, and Emerging Markets outperformed the U.S. Technology and Biotechnology lagged but were higher.
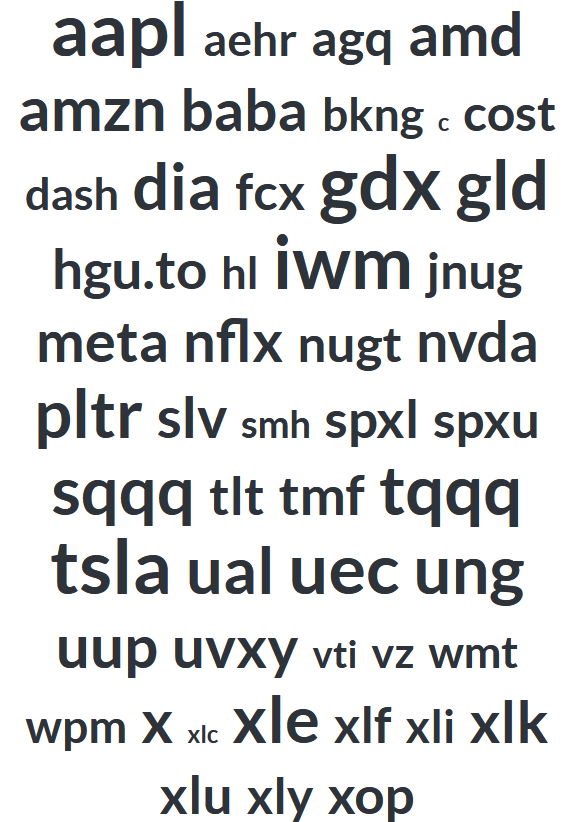
Figure 3: Popular Ticker Symbols 01/06/23
010623 Popular Symbols
Source: Stockcharts.com
The above is a list of popular symbols of stocks and ETFs among investors.
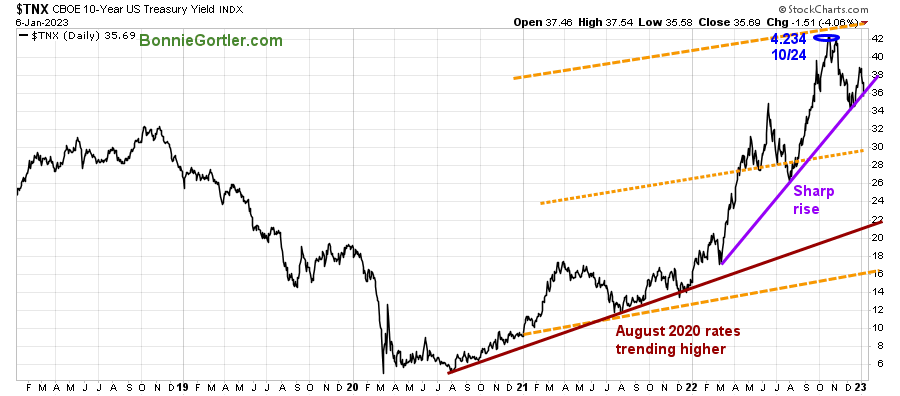
Bond Yields remain in an uptrend
Figure 4: UST 10YR Bond Yields Daily
010623 UST10 Yr Bond Yields Daily
Source: Stockcharts.com
The 10-Year U.S. Treasury yields fell sharply, boosting stocks, and closed at 3.569 %, close to breaking the March uptrend (purple line), with next support at 3.00% if yields continue to fall.
A sea of green the first week of 2023 with all the major averages higher, the Dow rose +1.46%, S&P 500 up +1.45%, and the Nasdaq gained +0.98%. The Russell 2000 Index gained +1.79%, and the Value Line Arithmetic Index (a mix of approximately 1700 stocks) was up +3.13%, a sign the rally is broadening.
Weekly market breadth improved considerably on the New York Stock Exchange Index (NYSE) and for Nasdaq. The NYSE had 2607 advances and 717 declines, with 201 new highs and 79 new lows. There were 3725 advances and 1454 declines on the Nasdaq, with 347 new highs and 255 new lows.
Last week there was a noticeable improvement in the Nasdaq market breadth. For the first time since November 2021, Nasdaq had more new highs than lows every day last week. If this trend continues, investors will likely go bargain hunting, fueling Nasdaq stocks higher.
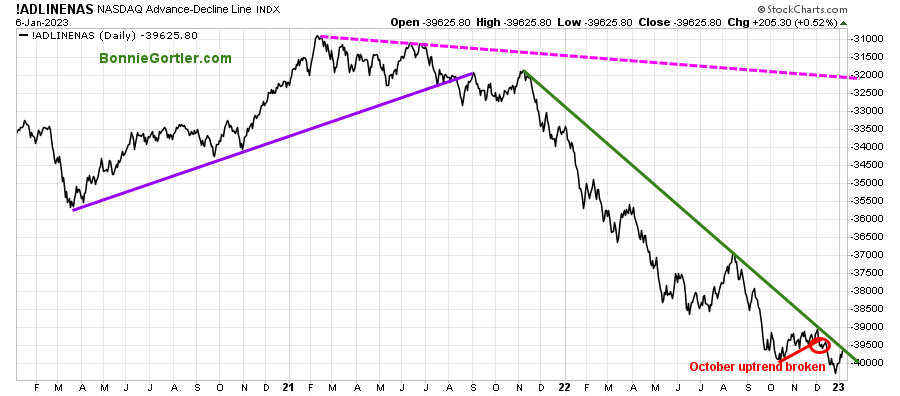
Nasdaq breadth is close to breaking its 2022 downtrend.
Figure 5: Nasdaq Advance Decline Line Daily
010623 Nasdaq Ad Line Daily
Source: Stockcharts.com
Early in December 2022, Nasdaq breadth failed to break above the 2022 downtrend and turned lower, breaking the October uptrend (red line), and the downtrend continued making it challenging to make money in 2023 in Nasdaq stocks.
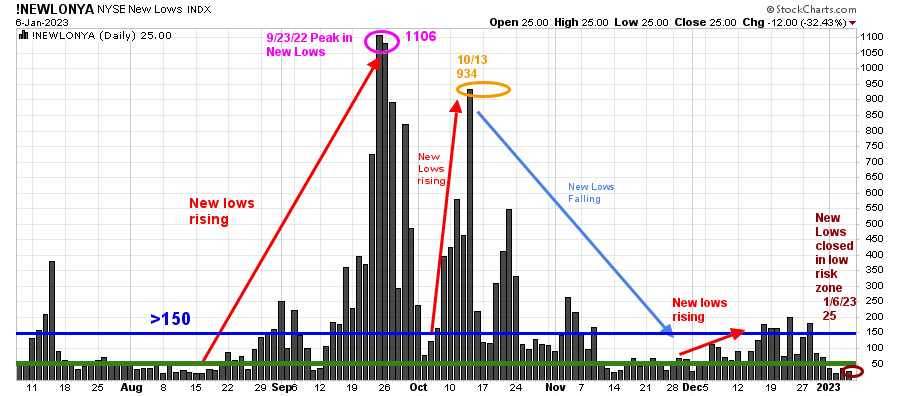
Figure 6: Daily New York Stock Exchange (NYSE) New Lows
010623 NYSE New Lows Daily
Source: Stockcharts.com
Watching New lows on the New York Stock Exchange is a simple technical tool that helps awareness of the immediate trend’s direction.
New lows warned of a potential sharp pullback, high volatility, and “panic selling” for most of 2022, closing above 150. The peak reading was 9/23/22 when New Lows made a new high of 1106 (pink circle).
It’s a bullish sign that New Lows have fallen out of the high-risk zone >150 and are now in the lower risk zone between 25 and 50 (green line).
New Lows closed at 25 (brown circle), implying low risk and short-term positive for the market. On the other hand, if New Lows rise above 150 and expand, a warning of weakness is forthcoming.
Learn more about the significance of New Lows in my book, Journey to Wealth, published on Amazon. If you would like a preview, get a free chapter here.
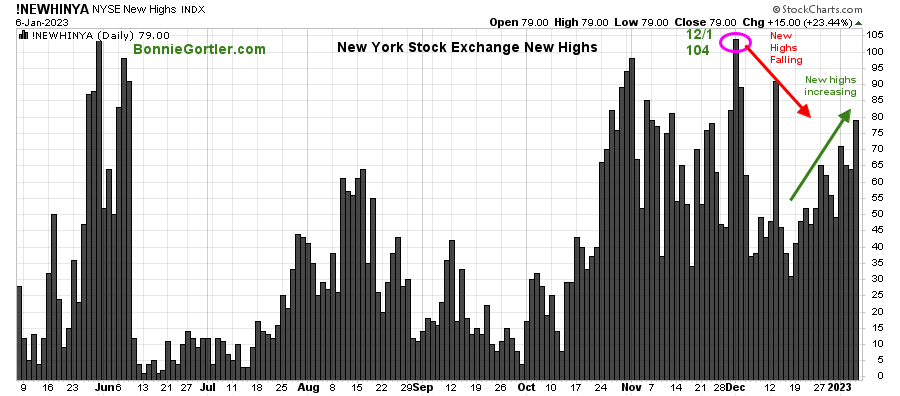
Figure 7: Daily New York Stock Exchange (NYSE) New Highs
010623 NYSE New Highs Daily
Source:Stockcharts.com
New Highs on the NYSE have begun to expand, as NYSE appears to have bottomed. However, New Highs have not surpassed the December high of 104. It will be favorable if they continue to expand this week. On the other hand, if New highs begin to fall, it would be a good sign the latest rally is running out of steam.
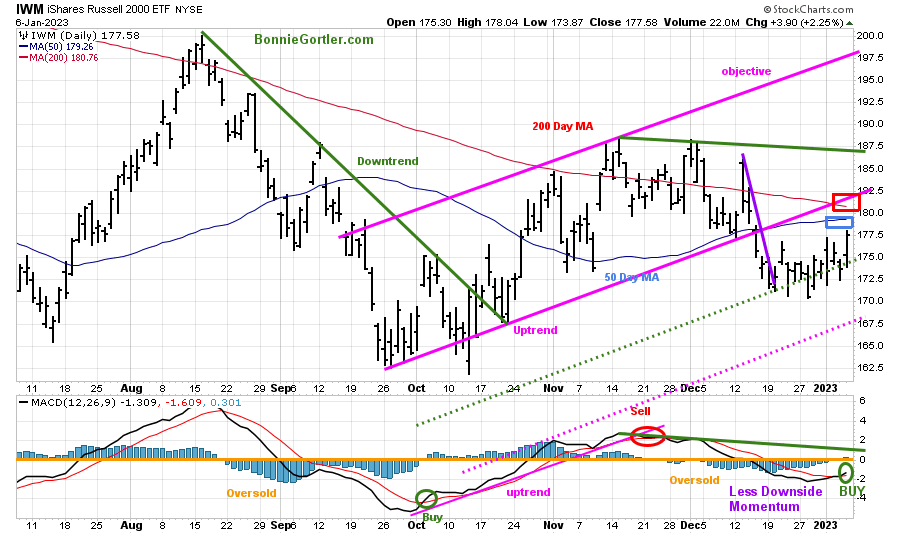
Is change in leadership forthcoming? MACD BUY
Figure 8: Daily iShares Russell 2000 (IWM) Price (Top) and 12-26-9 MACD (Bottom)
010623 IWM Daily
Source: Stockcharts.com
The top portion of the chart is the daily iShares Russell 2000 Index ETF (IWM), the benchmark for small-cap stocks, with a 50-Day Moving Average (MA) (blue line) and 200-Day Moving Average (MA) that traders watch and use to define trends.
IWM closed at 177.58 +1.85%, remains below its 200-Day Moving Average (red rectangle) and 50-Day Moving Average (blue rectangle), and remains below the channel where it broke down (pink line), which is now resistance. It was a positive sign that after IWM consolidated the past few weeks, IWM turned up and was stronger than the S&P 500.
MACD (middle chart) flipped to a buy, oversold, rising, and below 0 (orange line).
Short-term resistance is at 179.00, 182.50, 187.50, followed by 197.50. Support is at 170.00, followed by 167.50. On the other hand, A close below 167.60 would imply IWM is likely to accelerate to the downside.
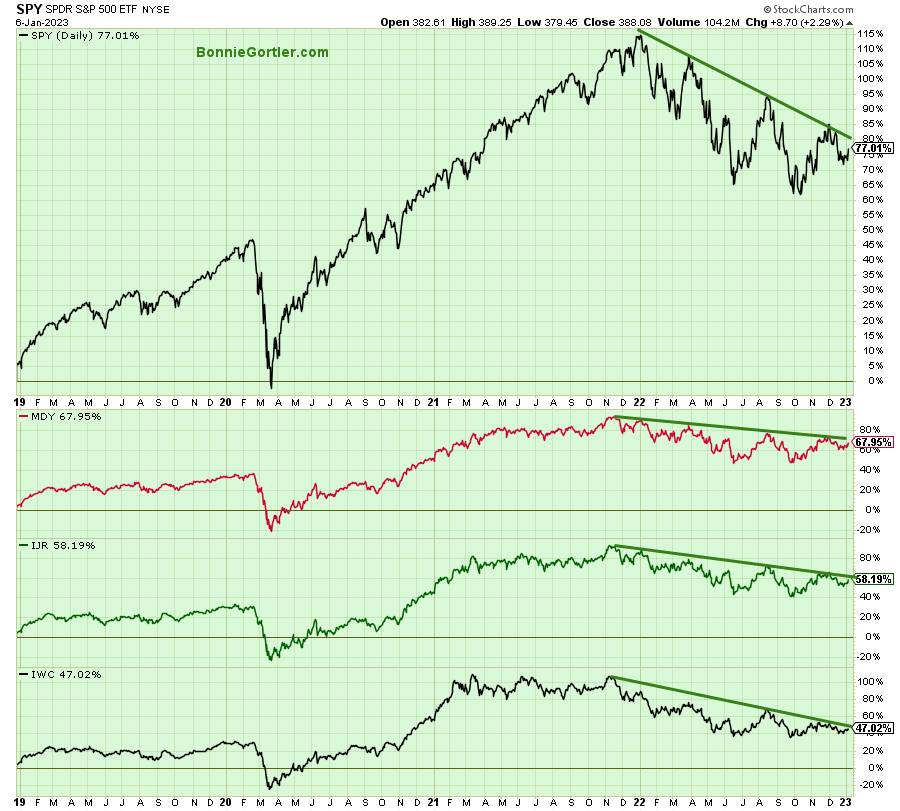
Figure 9: Daily SPDR S&P 500 ETF Trust (SPY), (Top) and below SPDR S&P MidCap 400 (MDY), iShares Core S&P Small-Cap (IJR), and iShares Micro-Cap (IWC) ETFs
010623 SPY MDY IJR, IWC
Source: Stockcharts.com
The downtrends (green lines) for The SPDR S&P 500 ETF Trust (SPY), SPDR S&P MidCap 400 ETF (MDY), iShares Core S&P Small-Cap (IJR), and iShares Micro-Cap (IWC) all remain in effect. Watch for these ETFs closely for a break of the downtrends that the worst is over, implying a potential sustainable rally in 2023 is imminent.
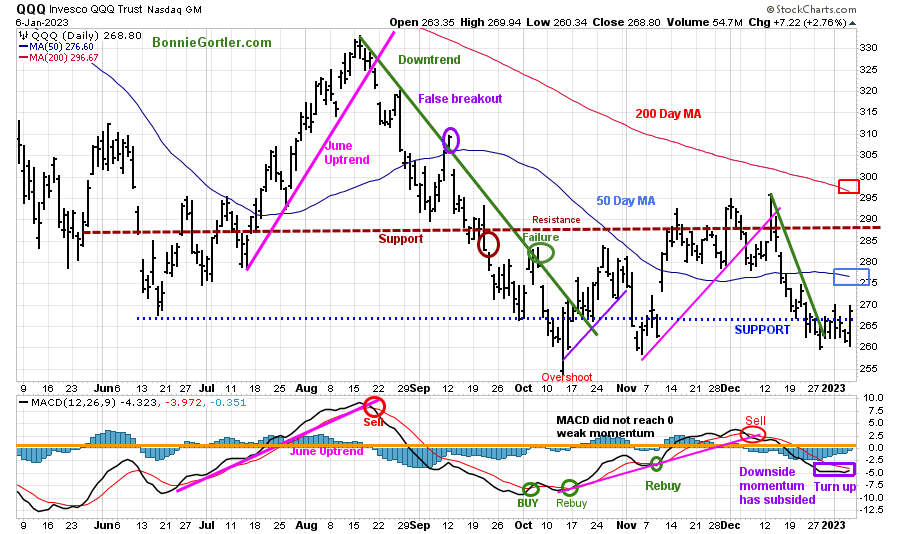
Figure 10: Daily Invesco QQQ Trust (QQQ) Price (Top) and 12-26-9 MACD (Bottom)
010623 QQQ Daily
Source: Stockcharts.com
The chart shows the daily Invesco QQQ, an exchange-traded fund based on the Nasdaq 100 Index. QQQ moved lower after a false break out (purple circle) in September of the August downtrend (green line). In November, QQQ broke its October uptrend (purple line), and the decline continued.
QQQ rose +0.95%%, closing at 268.80 as selling pressure subsided, yet QQQ lagged the other major averages.
QQQ support remains at 260.00, with resistance at 277.00, 280.00, 287.00, and 297.00.
The bottom chart is MACD (12, 26, 9) on a sell, oversold below 0, rising with downside momentum slowing, which is a positive sign, but no confirmation of a MACD buy.
Keep an eye on Apple (AAPL) and Microsoft, over 20% combined, which will impact the performance of QQQ if they show strength or continue to drag down QQQ.
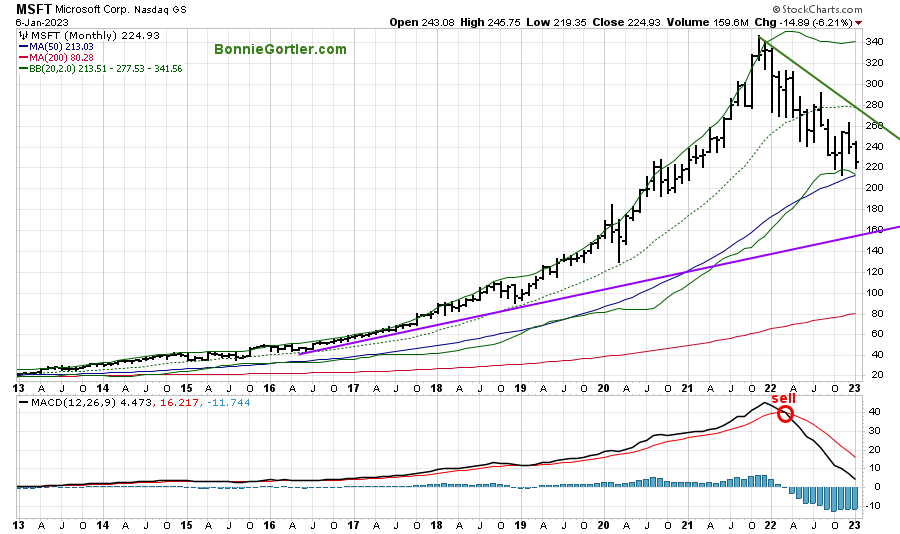
The long-term trend remains down For Microsoft
Figure 11: Monthly Microsoft (MSFT) Price (Top) and 12-26-9 MACD (Bottom)
010623 MSFT Monthly
Source: Stockcharts.com
Mega Cap technology companies have been hit hard and are setting up a great buying opportunity that has not happened in many years. However, the monthly downtrend remains in effect (green line).
MSFT has fallen to its lower Bollinger Band, the lowest reading since 2013, and a turn-up without touching the Bollinger Band over the next several months would be positive.
Resistance is at 245.00, followed by 260.00, with support at 213.00, 200.00, 180.00, and 160.00.
MACD (bottom chart) is falling, at its lowest reading since 2016, and not yet oversold enough for an official buy signal if MACD turns up from here.
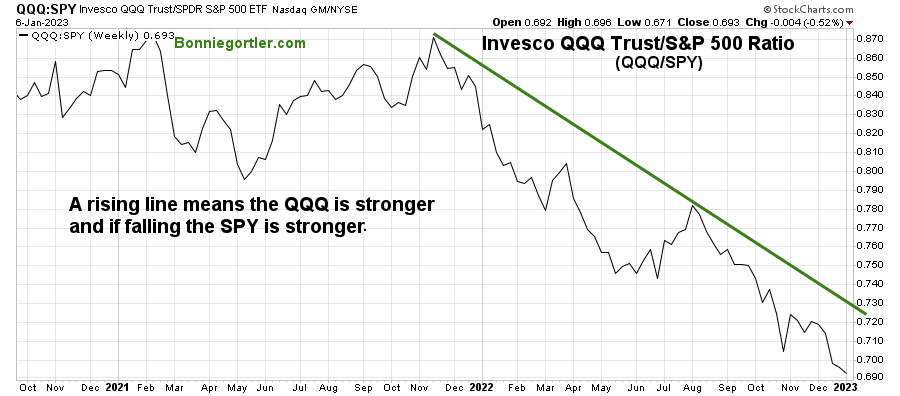
SPY remains stronger than QQQ based on relative strength for the intermediate trend.
Figure 12: Invesco QQQ Trust/S&P 500 Ratio (QQQ/SPY) WEEKLY
010623 QQQ Relative Strength Ratio
Source: Stockcharts.com
The top part of the chart is the weekly Invesco QQQ Trust ETF/SPDR S&P 500 (QQQ/SPY) Relative Strength Index Ratio. A rising line means the QQQ is stronger; if falling, the SPY is stronger.
The (QQQ/SPY) ratio peaked in November 2021 and remained in a downtrend. QQQ is weaker than the S&P 500. Over the next several weeks to months, investing in the S&P 500 vs. the Nasdaq is less risky until, at minimum, a turn-up followed by the downtrend broken.
Learn about coaching with Bonnie. Ask questions. Discover more about the coaching processes in this 15-minute call by emailing me at Bonnie@BonnieGortler.com. I would love to connect with you.
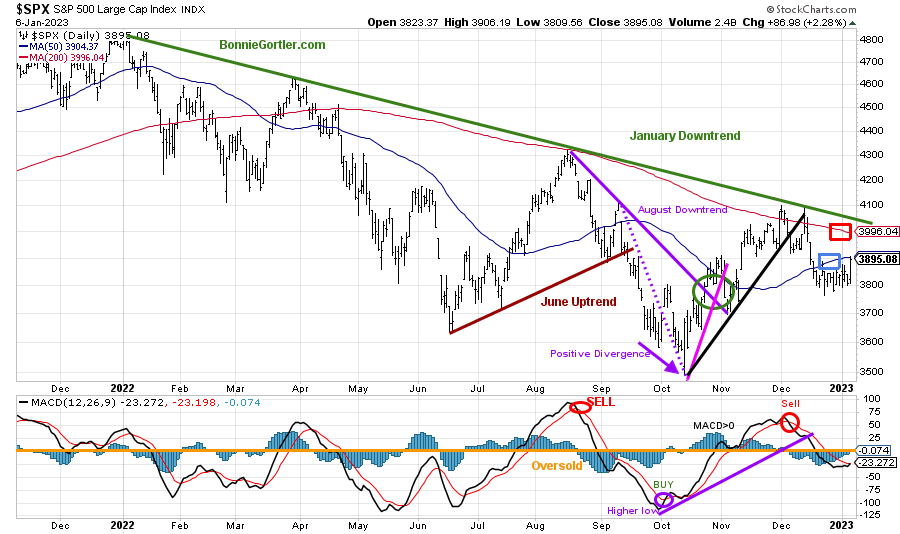
Figure 13: The S&P 500 Index ($SPX) Daily (Top) and 12-26-9 MACD (Bottom)
010623 SPX Daily
Source: Stockcharts.com
The S&P 500 (SPX) 2022 downtrend remains in effect (green line).
The S&P 500 (SPX) failed to get through resistance at 4100 and reversed lower, breaking the October uptrend, which is short-term bearish (black line).
Last week, SPX rose +1.45%, closing at 3895.08, in the upper part of the current trading range, closing below its 50- and 200-Day Moving Average (blue and red rectangle).
Resistance remains at 3900, 4000, and 4100, while support is at 3800 and 3700.
MACD (lower chart) remains on a sell, oversold, rising below 0, in a position to create a buy if the SPX rises in the near term.
Watch if SPX can close above resistance at 3900 and then gains momentum to close above 4000 or if the SPX stalls and falls below support at 3800.
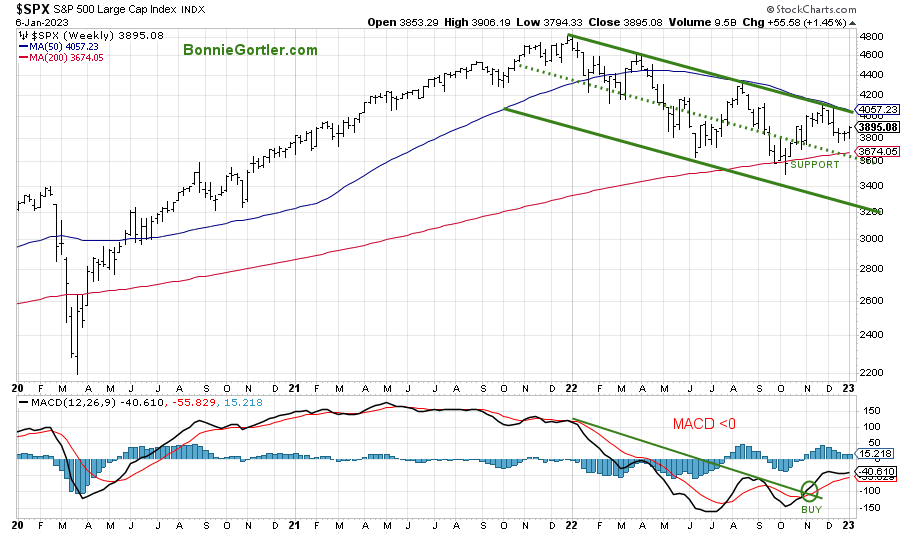
Figure 14: The S&P 500 Index ($SPX) Weekly (Top) and 12-26-9 MACD (Bottom)
010623 SPX Weekly
Source: Stockcharts.com
The top chart shows the weekly S&P 500 Index ($SPX) peaked in January 2022 and remains in a downtrend.
MACD is on a buy and has broken the 2022 downtrend, which is promising, but if MACD turns down after not reaching 0, further weakness is likely.
S&P 500 3600 remains a crucial support area (green dotted line) for the intermediate term that needs to hold the middle channel (green dotted line) or expect another leg down towards 3200. On the other hand, a close above 4100 would excite the bulls and give higher upside projections.
U.S. Dollar weakness continues and is positive for Global and U.S. Equities
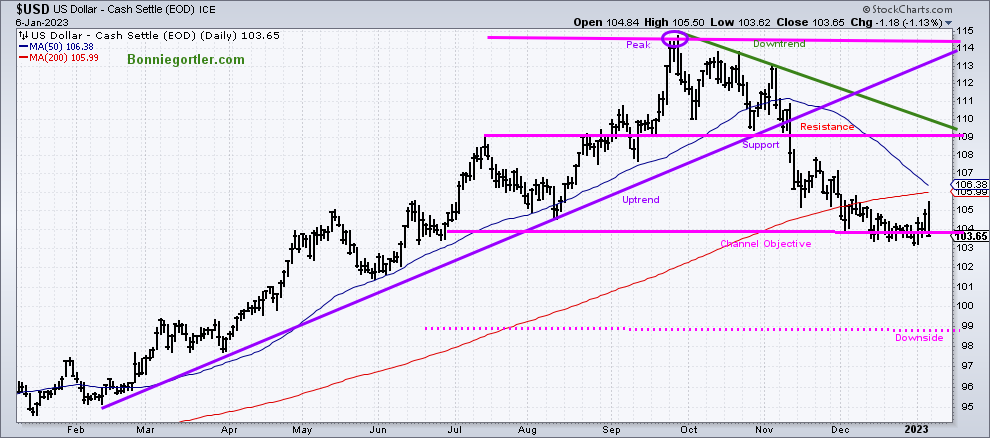
Figure 15: U.S. Dollar Daily
010623 USD Daily
Source: Stockcharts.com
The U.S. dollar peaked in September 2022, starting a downtrend that remains in effect.
The U.S. dollar gained +0.37%, up to start the week but closed near its low for the week fueling the international market higher.
The new downside objective is 98.80 (pink dotted line), and a close above 106.00 would negate the downside objective.
The continued weakness of the U.S. dollar bodes well for global and U.S. equities in the coming weeks.
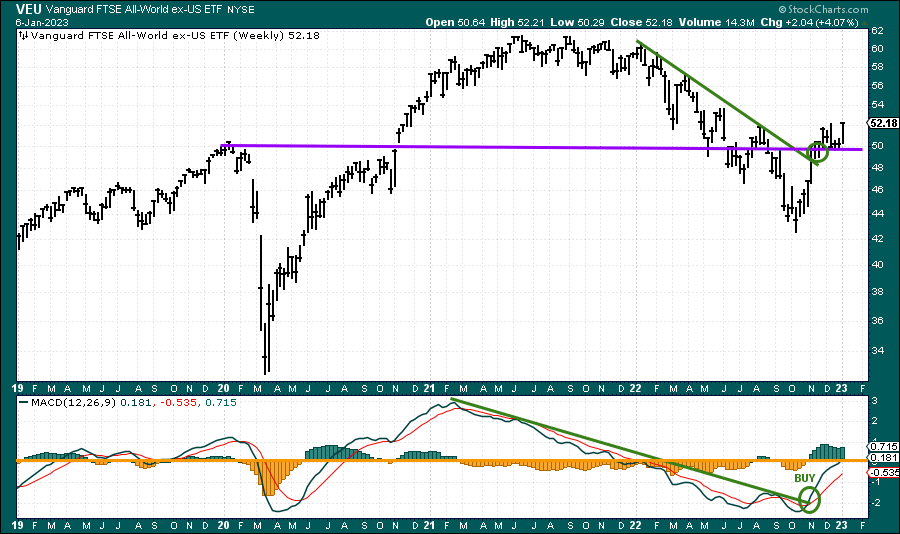
Figure 16: Vanguard FTSE All-Word ex-US ETF Weekly and 12-26-9 MACD (Bottom)
010623 VEU Weekly
Source: Stockcharts.com
The top chart is the Vanguard FTSE All-World ex-US ETF Weekly chart going back to 2019. VEU includes approximately 2,200 stocks of companies located in 46 countries, including developed and emerging markets worldwide.
VEU broke its downtrend in November 2022 (green circle) and continues higher. VEU had a strong week, up +4.07%, and outperformed the S&P 500 by more than 2:1.
MACD remains on its November buy (green line) and gaining momentum, with support at 50.00 and resistance between 56.00 and 58.00.
Figure 17:SPDR S&P 500 (SPY) (Top) with the aggressive ETFs of the SPDR sectors, XLB, XLE, XLF, XLK and XLY
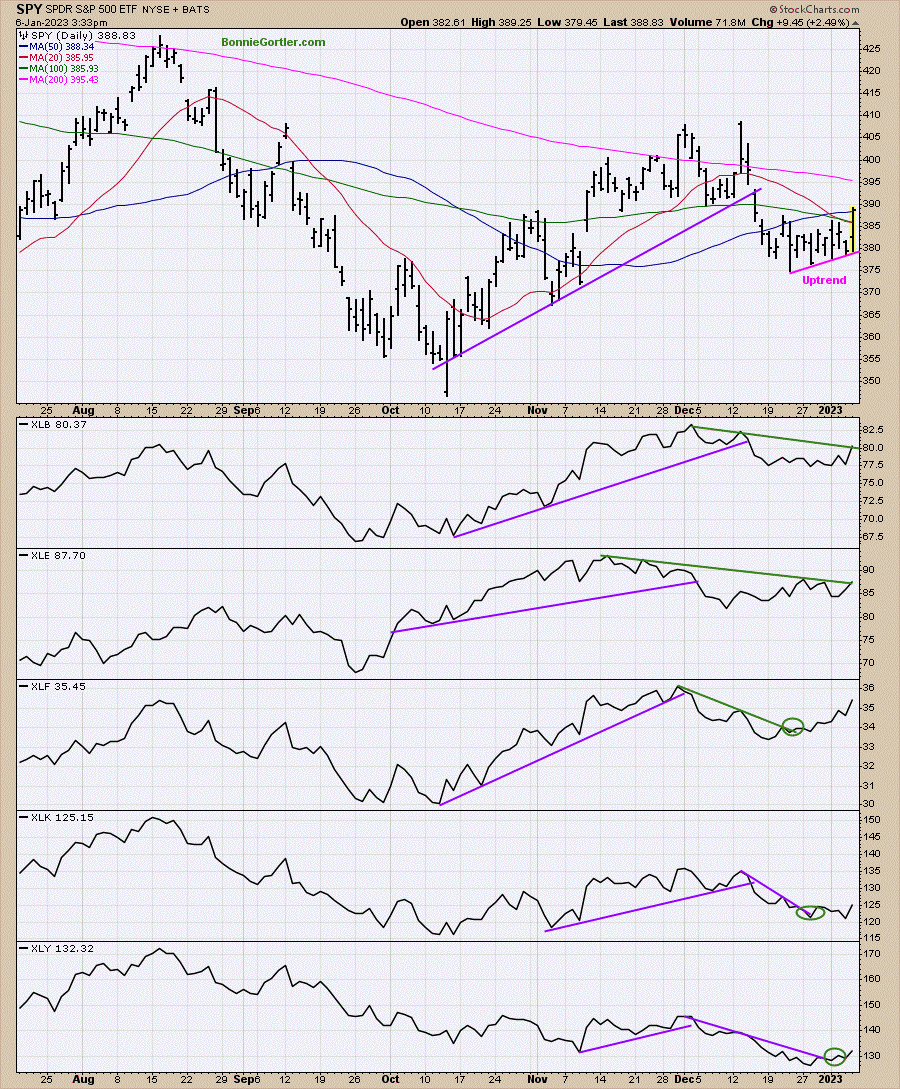
010623 Daily SPDR sectors, XLB, XLE, XLF, XLK and XLY
Source: Stockcharts.com
The top chart shows the SPDR S&P 500 (SPY) with the aggressive ETFs of the SPDR sectors, XLB, XLE, XLF, XLK, and XLY below.
Notice how all sectors have turned up.
XLB is close to breaking its December downtrend, and XLE is close to breaking the November downtrend (green lines).
XLF broke its downtrend in the second half of December and continues to rise.
XLK and XLY, the weakest sectors, are gaining strength, with XLY making a pattern of higher lows but XLK a lower low.
Summing Up:
Stocks and bonds struggled in 2022 and are off to a better start in 2023. The major averages held support levels and reversed. Short-term momentum patterns have turned up, and are in a favorable position where rallies begin. The continued weakness of the U.S. dollar has ignited international markets higher. Watch if the S&P 500 can close above resistance at 3900 and gains enough momentum to close above 4000. Despite the weak technology sector, Midcaps, Small Caps, and Microcaps appear ready to break the 2022 downtrend. The tape action and market breadth are improving. A potential sustainable rally is imminent.
Remember to manage your risk, and your wealth will grow.
Disclaimer: Although the information is made with a sincere effort for accuracy, it is not guaranteed that the information provided is a statement of fact. Nor can we guarantee the results of following any of the recommendations made herein. Readers are encouraged to meet with their own advisors to consider the suitability of investments for their own particular situations and for determination of their own risk levels. Past performance does not guarantee any future results.


Create more wealth in your life
with these simple strategies.
As an added bonus you will also
receive BG’s Updates and Ezine

Discover how to quickly create more well-being in your life with these simple strategies.
As an added bonus you will also
receive BG’s Updates and Ezine

As an added bonus you will receive BG’s Updates and Ezine

All work listed on BonnieGortler.com is licensed under a Creative Commons Attribution - Noncommercial - No Derivative Works 3.0 Unported License.


Free Report:
Grow and Sustain Your Wealth
Discover how to grow your money with these easy, simple steps.

