

10 Simple Tips for Financial Well-Being
07/01/2026
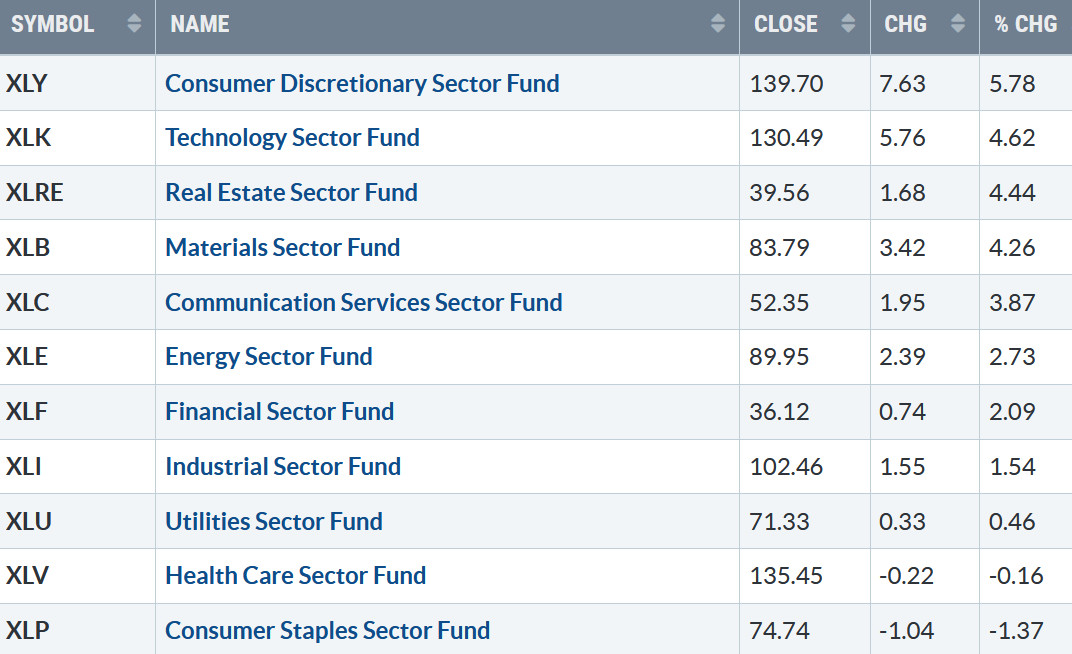
A broad rally during the first two weeks of January, nine of the eleven S&P SPDR sectors were higher. Consumer Discretionary (XLY) and Technology (XLK) were the leading sectors, while Health Care (XLV), and Consumer Staples (XLP), were the weakest, and the SPDR S&P 500 ETF Trust (SPY) was up +2.69%.
S&P SPDR Sector ETFs Performance Summary 1/06/23 – 1/13/23
011323 SPDR Sectors
Source: Stockcharts.com
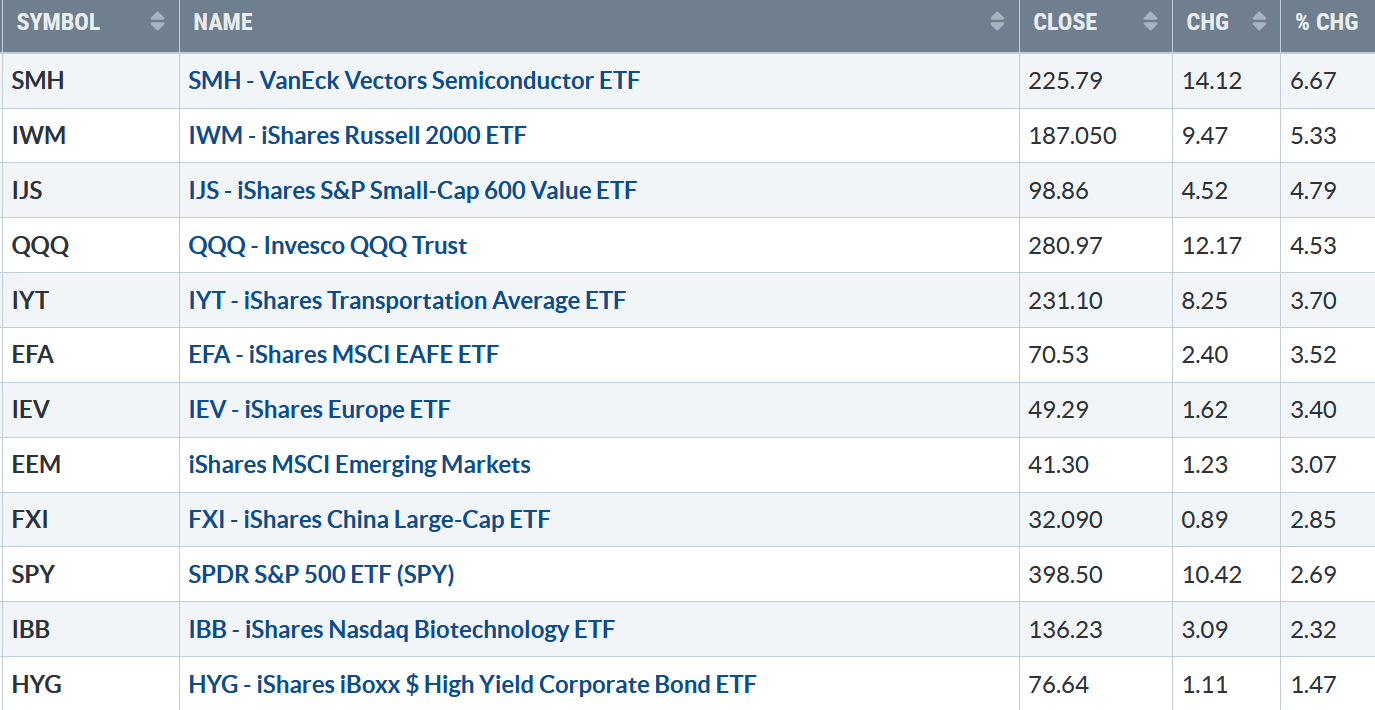
Figure 2: Bonnie’s ETFs Watch List Performance 1/06/23 – 1/13/23
011323 Week ETFs
Source: Stockcharts.com
Semiconductors and Small Caps surged higher, and International markets rose, continuing one of their best rallies in over a decade.
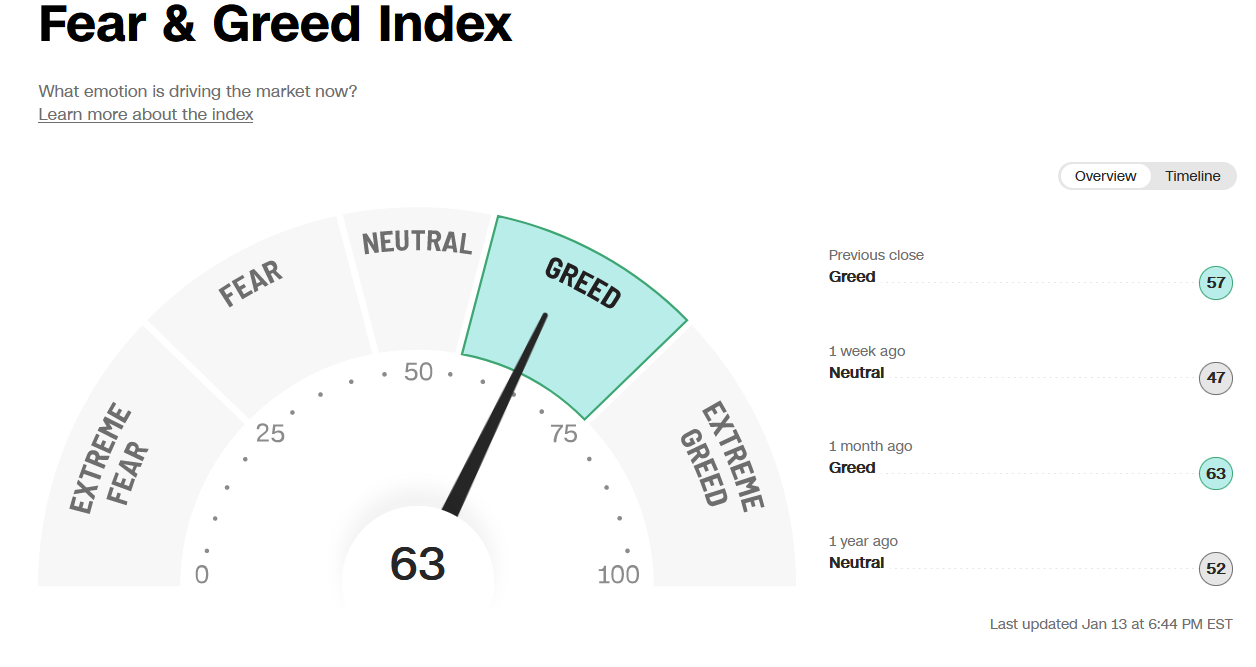
Figure 3 Fear And Greed
011323 Fear and greed index
Source: CNBC
Investor sentiment based on the CNBC Fear and Greed Index (a contrary indicator) rose last week to 63, showing greed. If there are a few more days of higher prices, sentiment will likely go to extreme greed, increasing the risk of a short-term pullback.
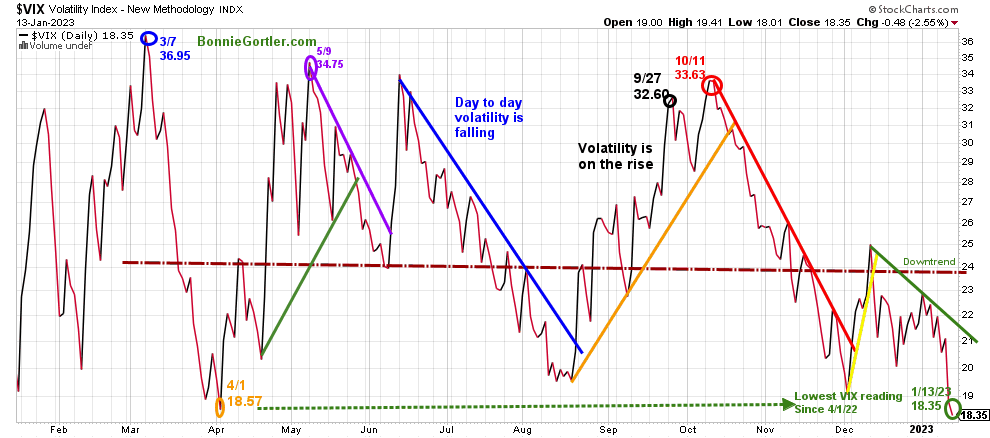
Figure 4: CBOE Volatility Index VIX
011323 VIX Daily
Source: Stockcharts.com
The CBOE Volatility Index (VIX), a measure of fear, traded above 20.00 for most of 2022. In late January 2022, VIX made a high at 36.95 on 3/7 (blue circle), followed by a pullback to a low on 4/1 at 18.57.
Its bullish VIX dropped sharply last week, closing at 18.35, the lowest reading since 4/1/22. (green circle).
Intra-day-day volatility is likely lower if VIX remains in the downtrend (green line) below 22.00 early in the week.
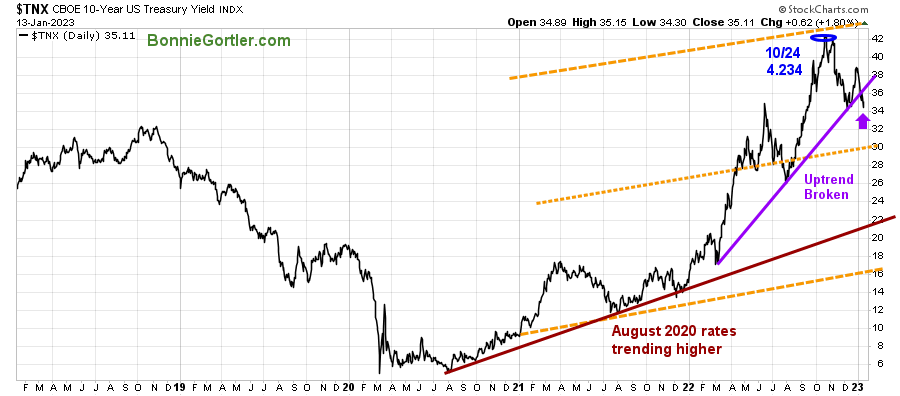
Figure 5: UST 10YR Bond Yields Daily
011323 UST 10 Yr Bond Yields Daily
Source: Stockcharts.com
The 10-Year U.S. Treasury yields fell, boosting stocks, and closed at 3.511 %, breaking the March uptrend (purple line), with next support at 3.00%. Resistance is 3.800%
A sea of green for back-to-back weeks of 2023 with all the major averages higher, the Dow rose +2.00%, S&P 500 up +2.67%, and the Nasdaq gained +4.82%. The Russell 2000 Index, the strongest index, gained +5.26%, and the Value Line Arithmetic Index (a mix of approximately 1700 stocks) was up +4.24%, a sign the rally is broadening.
Weekly market breadth improved considerably on the New York Stock Exchange Index (NYSE) and for Nasdaq. The NYSE had 2822 advances and 499 declines, with 256 new highs and 28 new lows. There were 4152 advances and 1051 declines on the Nasdaq, with 373 new highs and 116 new lows.
Nasdaq and New York market breadth continues to improve, with each day having more new highs than lows every day last week. Watch for the expansion of New highs on both the NYSE and Nasdaq.
The Nasdaq AD line broke its intermediate downtrend.
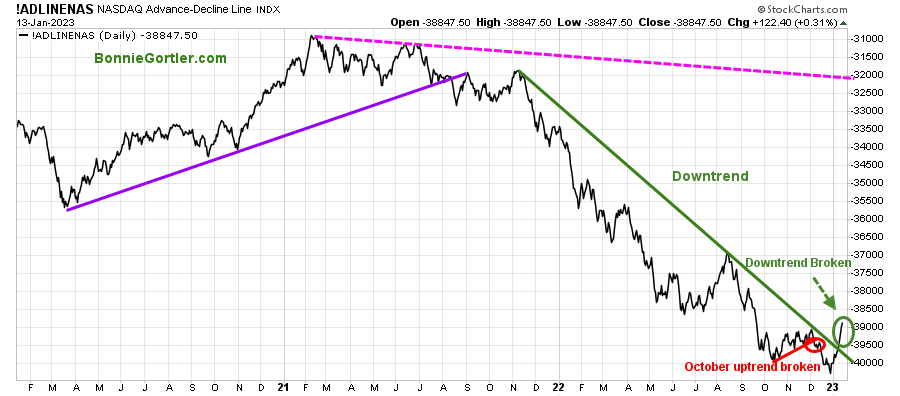
Figure 6: Nasdaq Advance Decline Line Daily
011323 Nasdaq Ad Line Daily
Source: Stockcharts.com
Early in December 2022, Nasdaq breadth failed to break above the 2022 downtrend and then turned lower, breaking the October uptrend (red line), a lower low in the AD-Line, followed before the reversal in 2023.
Good news. The downtrend broke last week, which is bullish for Nasdaq stocks.
Learn about coaching with Bonnie. Ask questions. Discover more about the coaching processes in this 15-minute call by emailing me at Bonnie@BonnieGortler.com. I would love to connect with you.
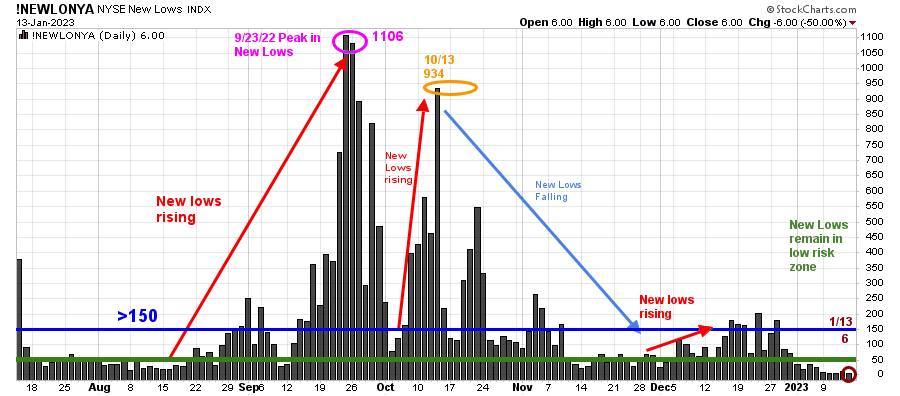
Figure 7: Daily New York Stock Exchange (NYSE) New Lows
011323 NYSE New Lows Daily
Source: Stockcharts.com
Watching New lows on the New York Stock Exchange is a simple technical tool that helps awareness of the immediate trend’s direction.
New lows warned of a potential sharp pullback, high volatility, and “panic selling” for most of 2022, closing above 150. The peak reading was 9/23/22 when New Lows made a new high of 1106 (pink circle).
New Lows closed at 6 (brown circle), below 25, the lowest risk zone, and is short-term positive for the market. Furthermore, New Lows are at the lowest reading since June 2021, while a rise above 150 and expansion would be a warning of weakness is forthcoming.
Learn more about the significance of New Lows in my book, Journey to Wealth, published on Amazon. If you would like a preview, get a free chapter here.
Small Caps Outperform
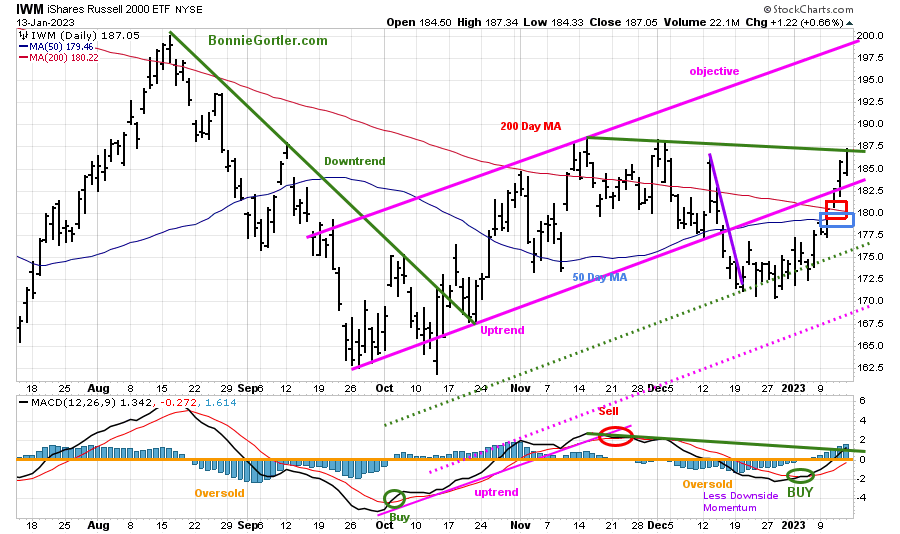
Figure 8: Daily iShares Russell 2000 (IWM) Price (Top) and 12-26-9 MACD (Bottom)
011323 IWM Daily
Source: Stockcharts.com
The top portion of the chart is the daily iShares Russell 2000 Index ETF (IWM), the benchmark for small-cap stocks, with a 50-Day Moving Average (MA) (blue line) and 200-Day Moving Average (MA) that traders watch and use to define trends.
IWM closed at 187.05 +5.33%, above its 200-Day Moving Average (red rectangle) and 50-Day Moving Average (blue rectangle), and above the channel where it broke down (pink line), which was acting as resistance. It is a positive sign that after IWM consolidated, IWM turned up and was stronger than the S&P 500.
MACD (middle chart) had a timely buy signal the previous week, is now above 0 (orange line), and broke the downtrend from November 2021.
IWM closed at its high for the week, above two areas for short-term resistance at 179.00 and 182.50, but fell short of 187.50, the next resistance level. The upside objective is 199.00.
The first support is between 180.00 and 182.50, followed by 175.00 and 177.50. It would be negative in the short term if IWM reverses lower and closes below 175.00.
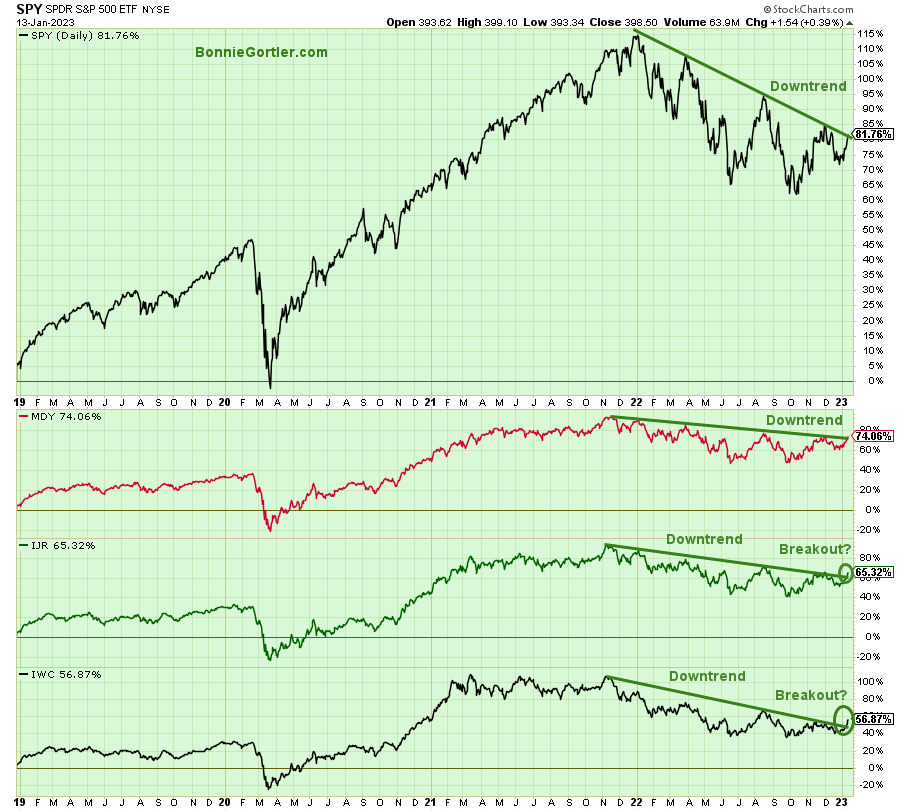
Figure 9: Daily SPDR S&P 500 ETF Trust (SPY), (Top) and below SPDR S&P MidCap 400 (MDY), iShares Core S&P Small-Cap (IJR), and iShares Micro-Cap (IWC) ETFs
011323 SPY MDY IJR, IWC
Source: Stockcharts.com
The above chart is The SPDR S&P 500 ETF Trust (SPY), SPDR S&P MidCap 400 ETF (MDY), iShares Core S&P Small-Cap (IJR), and iShares Micro-Cap (IWC).
The downtrends (green lines) for SPY and MDY remain in effect. The downtrends (green lines) for IJR and IWC broke last week. It’s too soon to know if it’s a breakout or a fake-out. Continued strength will confirm the breakout. Watch for a confirmation by SPY and MDY to join the party and break the downtrend this week.
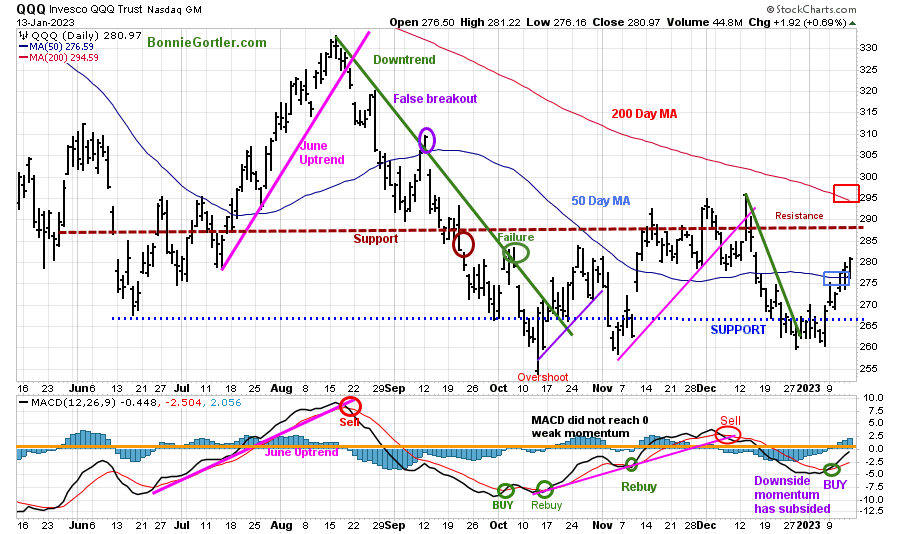
Figure 10: Daily Invesco QQQ Trust (QQQ) Price (Top) and 12-26-9 MACD (Bottom)
011323 QQQ Daily
Source: Stockcharts.com
The chart shows the daily Invesco QQQ, an exchange-traded fund based on the Nasdaq 100 Index. QQQ moved lower after a false break out (purple circle) in September of the August downtrend (green line). In November, QQQ broke its October uptrend (purple line), and the decline continued.
QQQ rose +4.53%%, closing at 280.87 above the 50-Day Moving average as buyers stepped in as selling pressure subsided the previous week.
QQQ broke through resistance at 277.00 and 280.00, falling short of resistance at 287.00. A close above 287.00 would likely trip more buy stops toward the 200-Day Moving Average (red rectangle) that closed at 294.59 as of 1/13.
QQQ support is at 275.00, 270.00, and 265.00. I would like to see QQQ hold above 275.00 early next week and rise to 287.50 for the bulls to stay in control.
The bottom chart is MACD (12, 26, 9) generated a new buy last week, with momentum rising.
Keep an eye on Apple (AAPL) and Microsoft, over 20% combined, which will impact the performance of QQQ if they show strength or continue to drag down QQQ. Both stocks generated a MACD Buy last week but closed below their 50 and 200-Day Moving Averages.
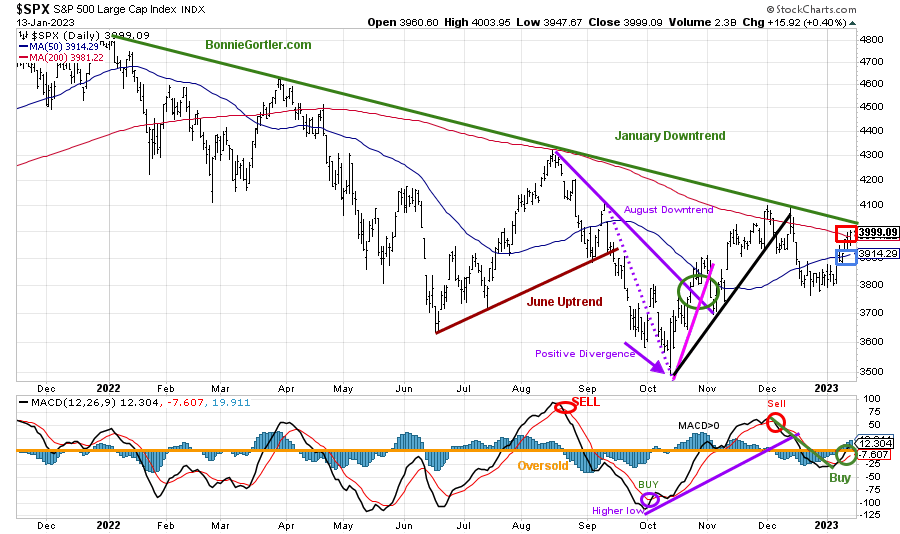
Figure 11: The S&P 500 Index ($SPX) Daily (Top) and 12-26-9 MACD (Bottom)
011323 SPX Daily
Source: Stockcharts.com
The S&P 500 (SPX) failed to get through resistance at 4100 in December 2022 and reversed lower, breaking the October uptrend (black line), and the 2022 downtrend remains in effect (green line) despite the rise in the first two weeks in 2023.
The S&P 500 rallied for the second weekly gain of the new year, with SPX rising +2.67%, closing at 3999.09, in the upper part of the current trading range, closing above its 50-and 200-Day Moving Average (blue and red rectangle), now showing underlying strength, but remains in a downtrend.
Resistance remains at 4100, while support is at 3900 and 3800.
MACD (lower chart) generated a buy last week (green circle) from below 0, is rising, and broke its downtrend, implying the worst downside momentum is complete.
Watch if SPX can close above resistance at 4000 and then gains momentum to close above 4100, tripping the buy stops fueling the next leg higher, or if the SPX stalls and falls below support at 3800.
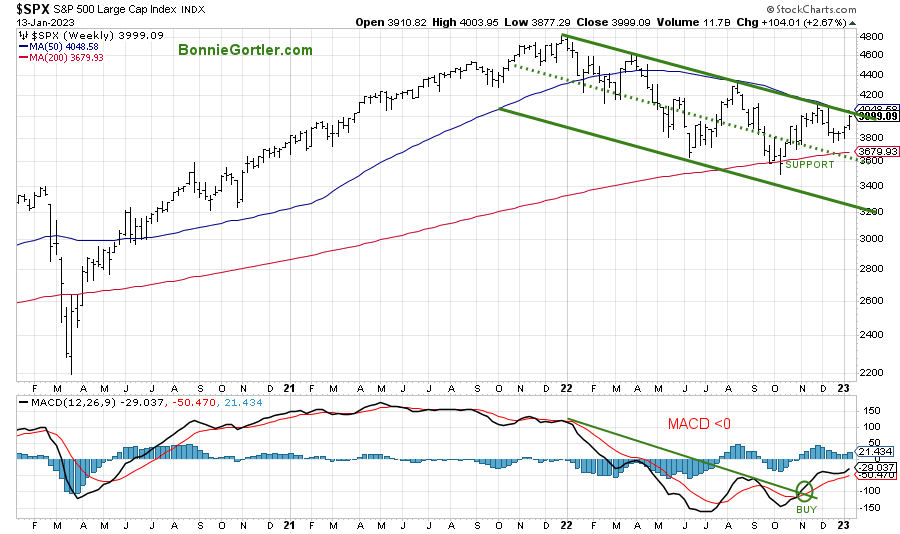
Figure 12: The S&P 500 Index ($SPX) Weekly (Top) and 12-26-9 MACD (Bottom)
011323 SPX Weekly
Source: Stockcharts.com
The top chart shows the weekly S&P 500 Index ($SPX) peaked in January 2022 and remains in a downtrend.
MACD is on a buy and has broken the 2022 downtrend, which is promising, but if MACD turns down after not reaching 0, weakness is likely.
S&P 500 3600 remains a crucial support area (green dotted line) for the intermediate term that needs to hold above the mid-channel (green dotted line) or expect another leg down towards 3200. On the other hand, a close above 4100 would excite the bulls and give higher upside projections.
U.S. Dollar weakness continues supporting Global and U.S. Equities
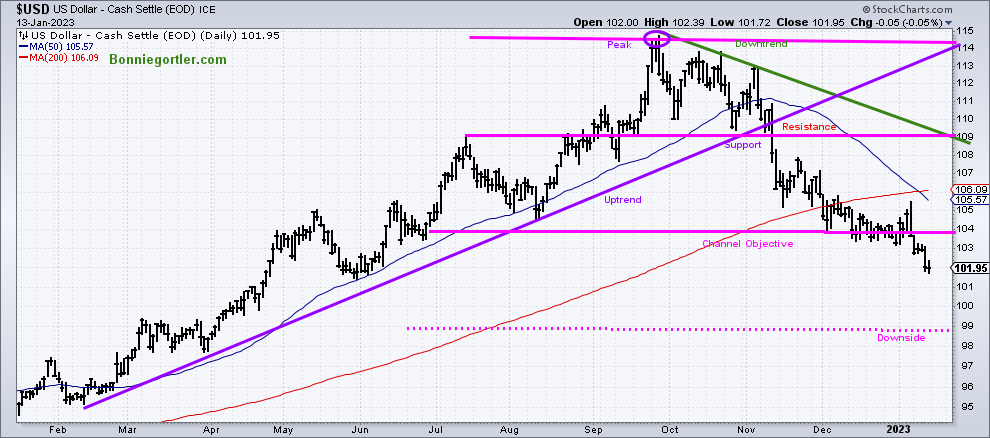
Figure 13: U.S. Dollar Daily
011323 USD Daily
Source: Stockcharts.com
The U.S. dollar peaked in September 2022, starting a downtrend that remains in effect.
The U.S. dollar remained under pressure, falling -1.64%, and closed again near its low for the week fueling the international markets higher.
The downside objective remains at 8.80 (pink dotted line), and a close above 106.00 would negate the downside objective.
The continued weakness of the U.S. dollar bodes well for global and U.S. equities in the coming weeks. However, if the dollar stabilizes and rises, look for a pullback in the international markets.
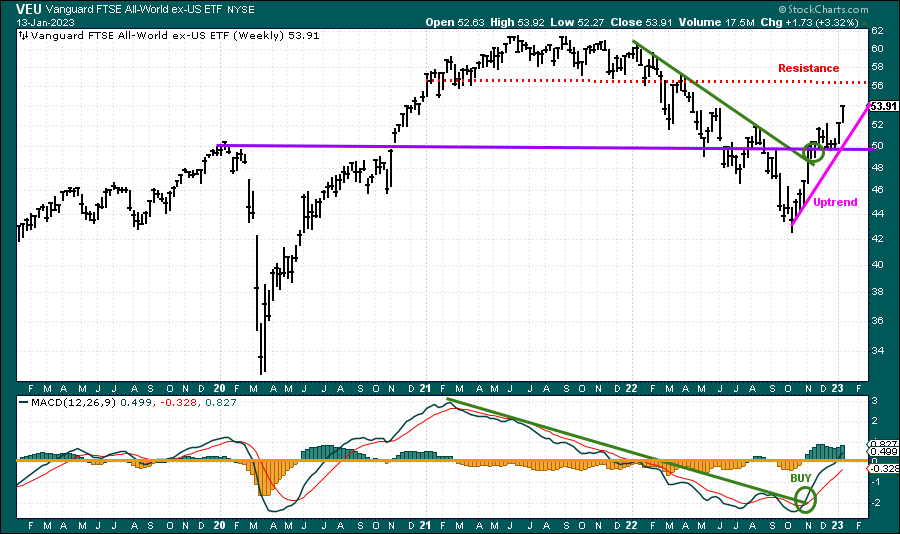
Figure 14: Vanguard FTSE All-Word ex-US ETF Weekly and 12-26-9 MACD (Bottom)
011323 VEU weekly
Source: Stockcharts.com
The top chart is the Vanguard FTSE All-World ex-US ETF Weekly chart going back to 2019. VEU includes approximately 2,200 stocks of companies located in 46 countries, including developed and emerging markets worldwide.
VEU broke its downtrend in November 2022 (green circle) and continues higher. VEU had another week of big gains, up 3.32% after rising +4.07%, the previous week outperforming the S&P 500.
MACD remains on its November buy (green line) and gaining momentum, with support at 50.00 and resistance at 56.00 and 58.00. A close below 50 would break the uptrend and would be negative.
Speculative Buying Opportunity – Positive Divergence Confirmed by a MACD buy
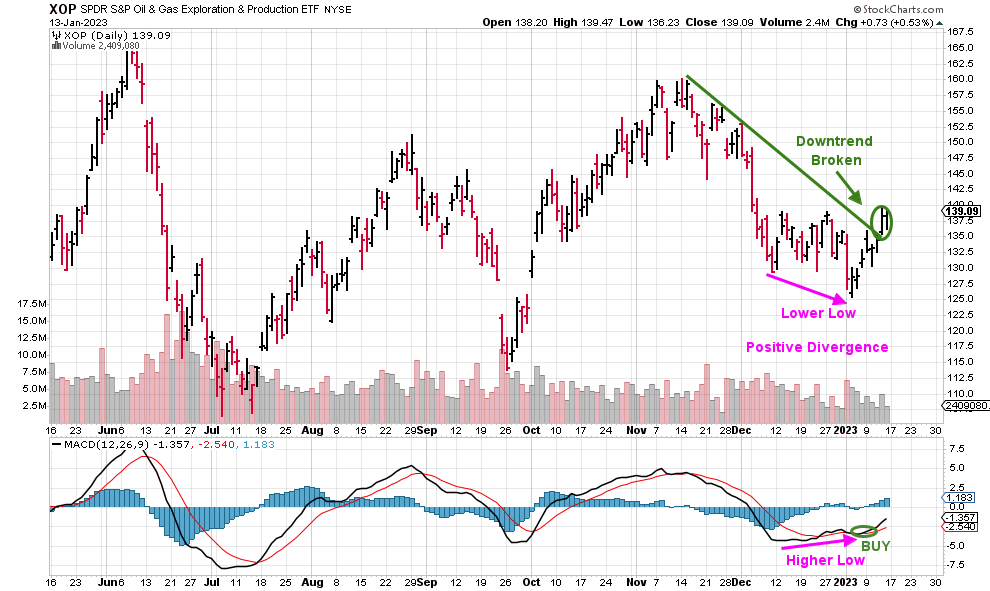
Figure 15: SPDR Oil and Gas Exploration (XOP) and 12-26-9 MACD (Bottom)
011323 XOP Daily
Source: Stockcharts.com
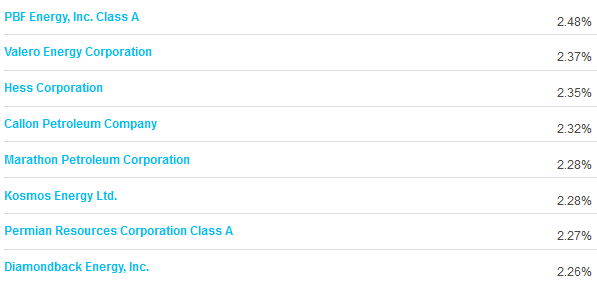
Figure 16: SPDR Oil and Gas Exploration (XOP) top holdings
011323 XOP top holdings
Source: ETF.com
The XOP ETF provides exposure to US companies in oil and gas exploration & production space and rebalances quarterly.
A potential buying opportunity is developing in SPDR Oil and Gas Exploration (XOP). It’s bullish that the November 2021 downtrend broke last week, combined with a MACD buy from an oversold condition and positive divergence, one of my favorite buying patterns. Learn more about this pattern in my free Masterclass, Charting Strategies to Cut Risk and Trade with the Trend. Sign up here.
If XOP closes above resistance at 140.00, a rally toward 151.00 is possible. A close below 130.00 would be negative and negate the trade.
Summing Up:
A big week for stocks. Small Cap stocks, Semiconductors, and Technology led the advance. Global equities continued higher, complimenting U.S. market gains as the dollar weakened. Short-term and intermediate momentum patterns have turned up and are favorable. Earning season continues this week with the short-term extended, which could slow the pace of the rise. Nasdaq and New York market breadth continues to improve, with each day having more new highs than lows every day last week. Watch for the expansion of New Highs on both NYSE and Nasdaq for confirmation the rally is broadening. Respect the bullish tape action and strength of the thrust to the upside implying higher prices.
Remember to manage your risk, and your wealth will grow.
Let’s talk investing. You are invited to set up your Free 30-minute Wealth and Well-Being Strategy session by clicking here or emailing me at Bonnie@BonnieGortler.com. I would love to connect with you.
Disclaimer: Although the information is made with a sincere effort for accuracy, it is not guaranteed that the information provided is a statement of fact. Nor can we guarantee the results of following any of the recommendations made herein. Readers are encouraged to meet with their own advisors to consider the suitability of investments for their own particular situations and for determination of their own risk levels. Past performance does not guarantee any future results.


Create more wealth in your life
with these simple strategies.
As an added bonus you will also
receive BG’s Updates and Ezine

Discover how to quickly create more well-being in your life with these simple strategies.
As an added bonus you will also
receive BG’s Updates and Ezine

As an added bonus you will receive BG’s Updates and Ezine

All work listed on BonnieGortler.com is licensed under a Creative Commons Attribution - Noncommercial - No Derivative Works 3.0 Unported License.


Free Report:
Grow and Sustain Your Wealth
Discover how to grow your money with these easy, simple steps.

