

10 Simple Tips for Financial Well-Being
07/01/2026
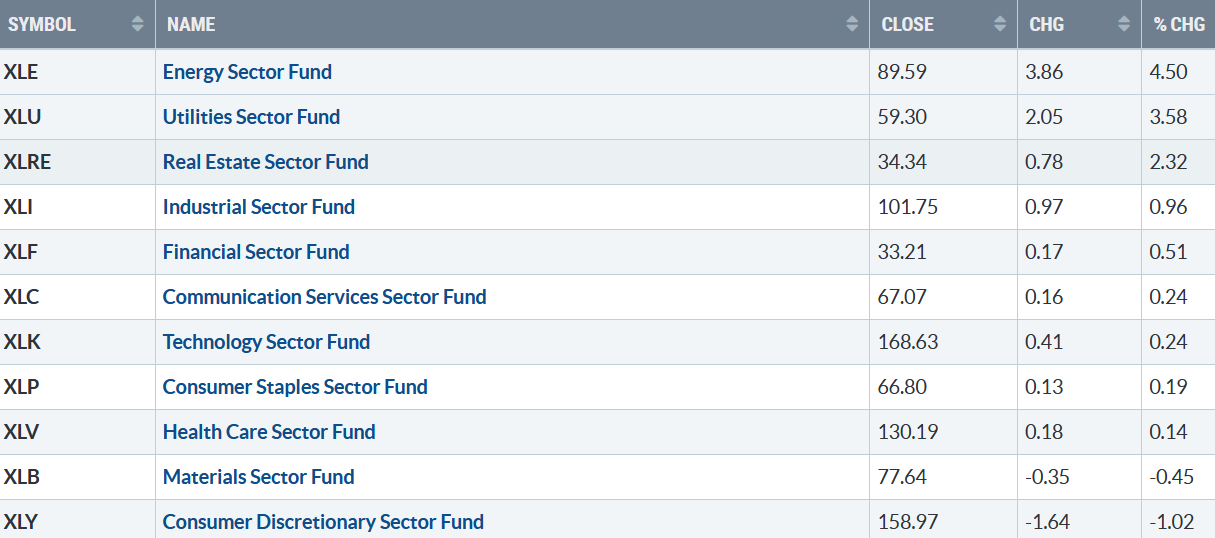
Stocks gave up early gains on Friday, but nine S&P SPDR sectors finished higher for the week. Energy (XLE) and Utilities (XLU) were the best sectors, while Materials (XLB) and Consumer Discretionary (XLY) were the weakest. The SPDR S&P 500 ETF Trust (SPY) gained +0.46%.
S&P SPDR Sector ETFs Performance Summary 10/6/23-10/13/23
101323 SPDR Sectors
Source: Stockcharts.com
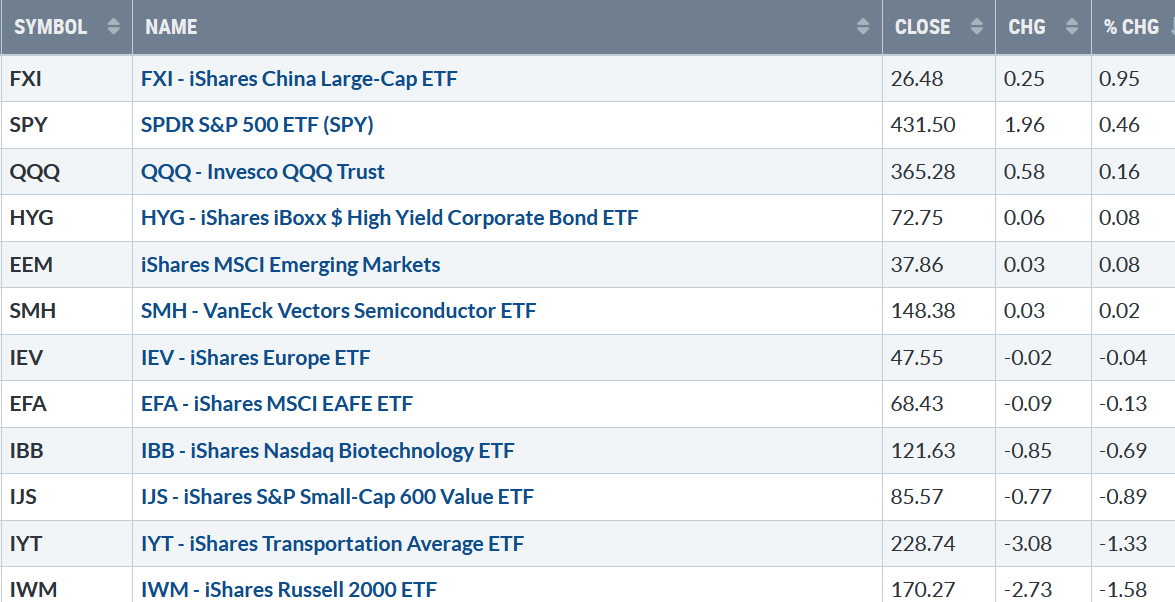
Figure 2: Bonnie’s ETFs Watch List Performance Summary 10/6/23-10/13/23
101323 Week ETFs
Source: Stockcharts.com
Last week, international markets stabilized, with no significant moves in either direction, while Small Cap Value and Growth lagged.
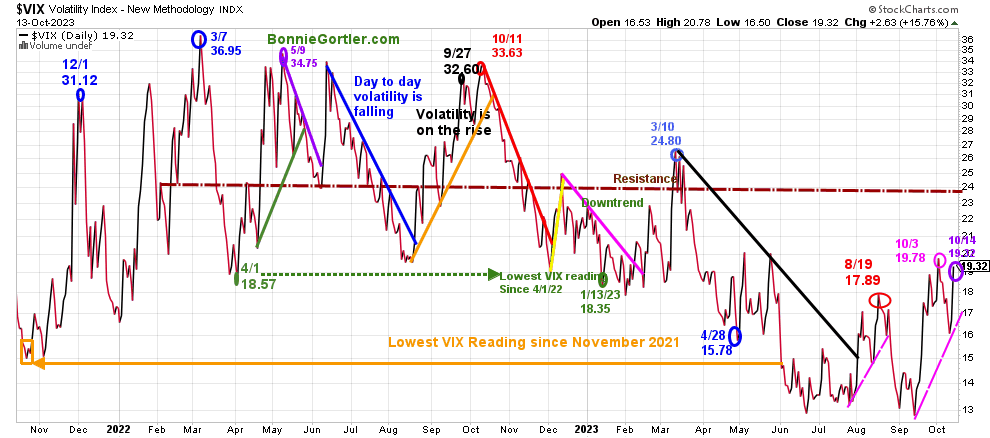
Figure 3: CBOE Volatility Index VIX
101323 VIX Daily
Source: Stockcharts.com
The CBOE Volatility Index (VIX), a measure of fear, traded above 20.00 for most of 2022, with a high at 36.95 on 3/7 (blue circle). A new VIX low did not occur until 1/13/23 at 18.35 (green circle) after peaking in October 2022 at 33.63 (red circle).
VIX jumped 15.62% on Friday, closing the week at 19.32 (purple circle), but finished below the week’s high of 19.78 on 10/3. VIX continuing to rise will imply last Friday’s decline will likely continue causing wilder daily intraday swings and increased daily risk. On the other hand, If VIX falls and then closes below 16.00 for two days, it would be a positive sign the worst of the decline is over.
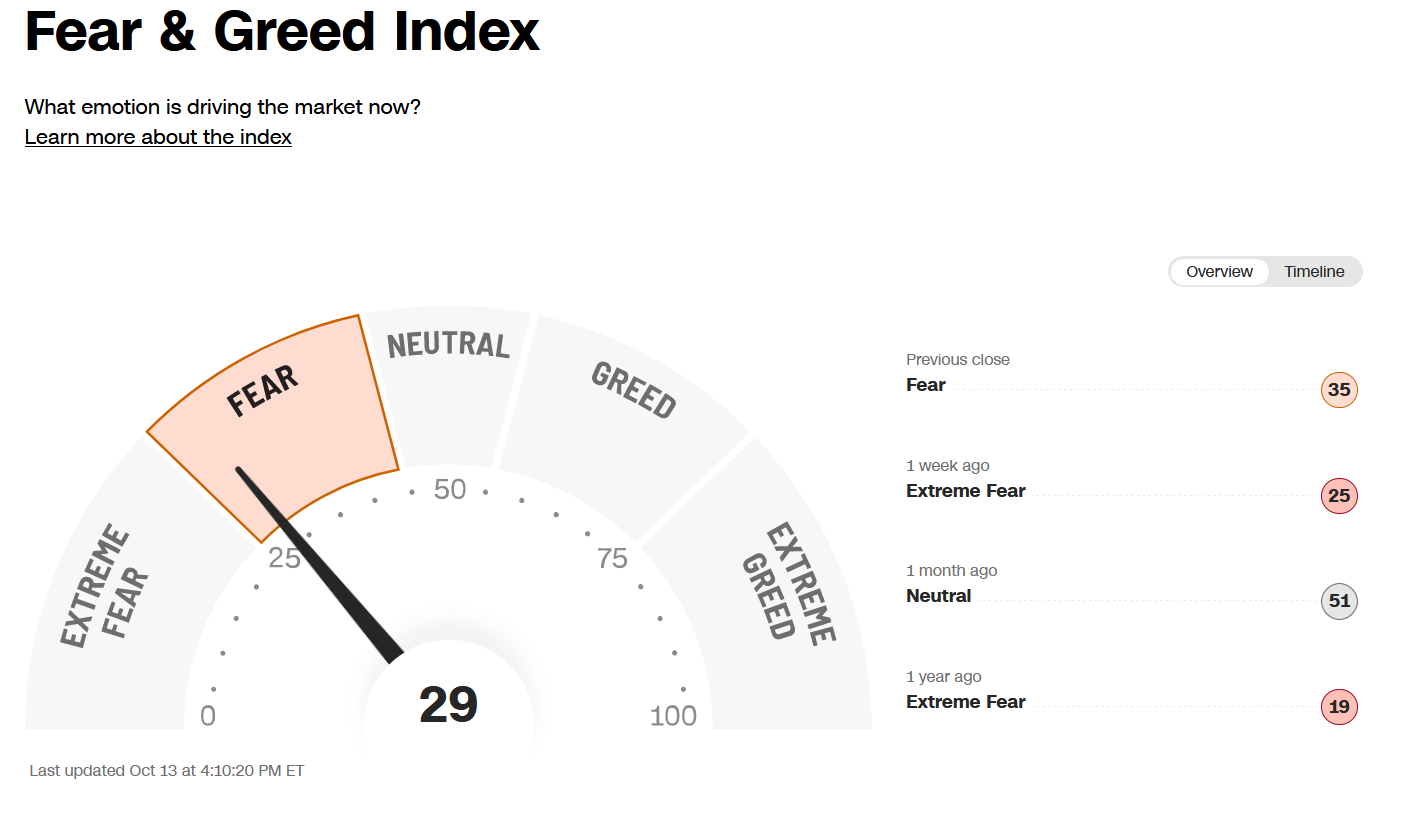
Figure 4: Fear & Greed Index
101323 Fear and Greed Index
Source. CNN.com
Investor sentiment based on the Fear and Greed Index (a contrarian index) measures the market’s mood. VIX dropped last week to close at 29, showing fear and increasing the odds of a short-term rally sooner rather than later.
Where do we go from here?
Figure 5: UST 10YR Bond Yields Daily
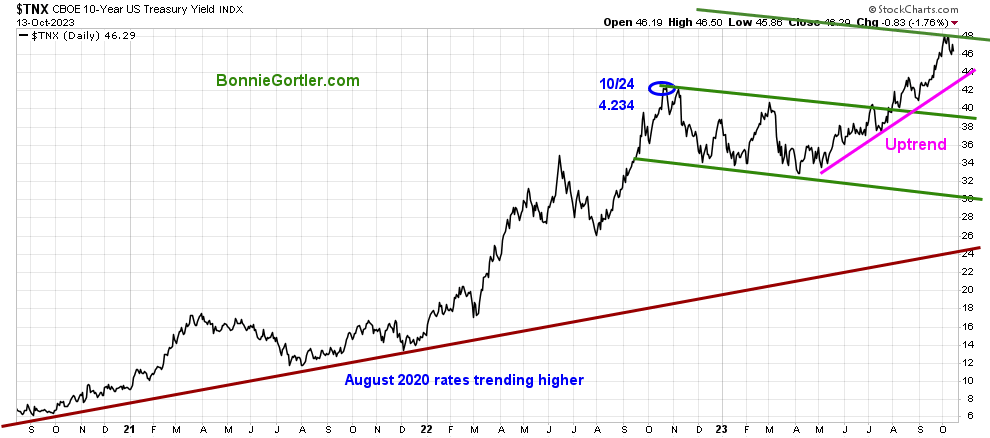
101323 UST 10 Yr Bond Yields Daily
Source: Stockcharts.com
The 10-year U.S. Treasury yields closed lower last week at 4.629% in volatile trading, remaining in the May uptrend (pink line) but pulling back from the top of the channel (top green line).
If yields fall below 4.20%, it would be considered short-term bullish for equities. However, a close above 4.950% would be negative.
Last week, the major market averages were mixed. The Dow gained +0.79%, the S&P 500 gained +0.45%, Nasdaq -0.18, while the Russell 2000 Index fell again -1.48%. Crude Oil and Gold spiked sharply higher.
Are you interested in learning about the stock market in the comfort of your home? Learn how to implement a powerful wealth-building mindset and simple, reliable strategies to help you Grow Your Wealth. Learn more here: https://bonniegortler.lpages.co/wealth-made-simple-ecourse/.
Figure 6: Value Line Arithmetic Average
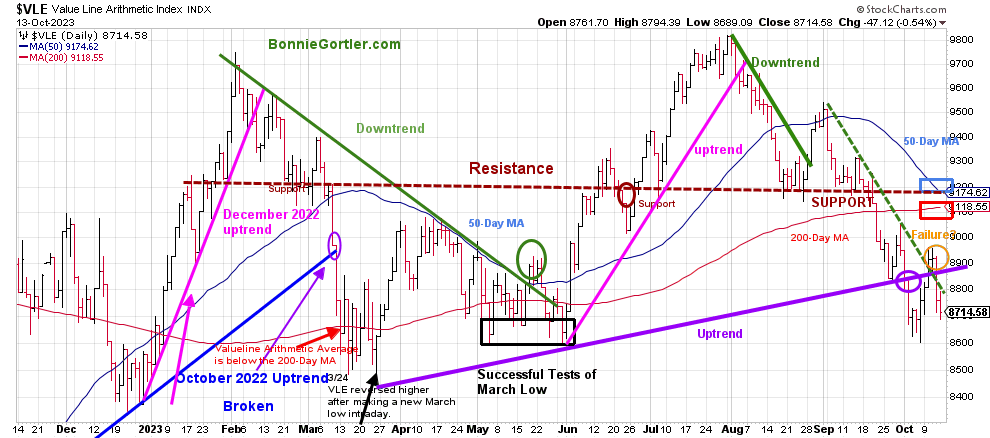
101323 VLE Daily
Source: Stockcharts.com
The Value Line Arithmetic Index ($VLE) is a mix of approximately 1700 stocks. VLE broke the October 2022 uptrend in early March 2023 (blue line), and April, May, and June successfully tested the March low.
VLE broke the downtrend early last week but failed (orange circle) to generate any upside momentum, reversing lower before reaching the 200-day MA (red rectangle) and 50-day MA (blue rectangle), closing below both.
VLE closed at 8714.58, down -0.52%, holding the October low so far. Support is 8600 and 8400. Resistance is at 8800, 9100, and 9300.
VLE is at a critical time now. A turn-up now, without taking out the October low with a close above 9100, would form a favorable double bottom formation and imply a short-term bottom has occurred.
Do you want to go deeper into charting? Learn more in the comfort of your home today with my Free 33-minute Training, Charting Strategies to Cut Risk and Trade with the Trend. Sign up here.
Market breadth remains troublesome.
Weekly market breadth was negative on the New York Stock Exchange Index (NYSE) and for the Nasdaq. The NYSE had 1456 advances and 1541 declines, with 80 new highs and 306 new lows. There were 1772 advances and 2952 declines on the Nasdaq, with 136 new highs and 739 new lows.
Market breadth needs to improve on both the NYSE and Nasdaq for a sustainable rally.
If you want to go more in-depth with charts, I invite you to join my FB group, Wealth Through Market Charts.
Figure 7: Nasdaq Advance Decline Line Daily (Top) and Nasdaq (Bottom)
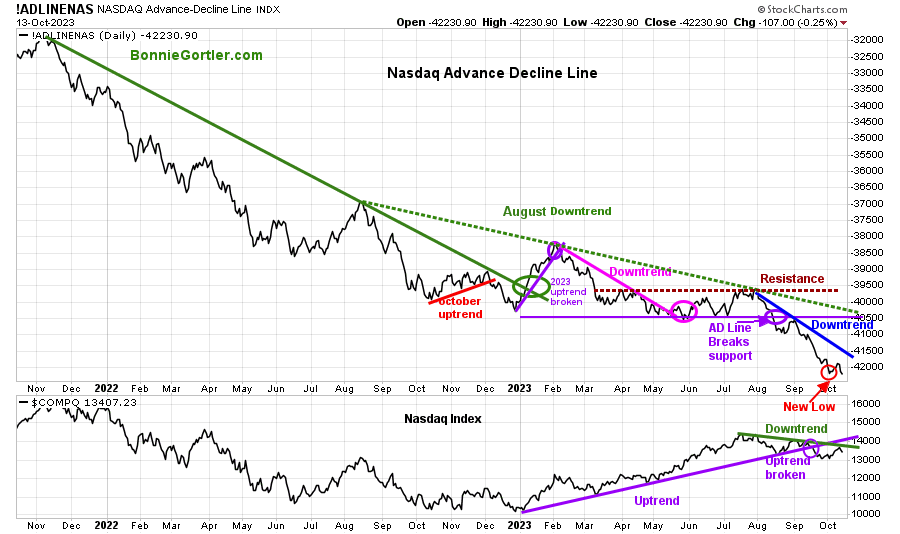
101323 Daily Nasdaq Cumulative Advance-Decline Line
Source: Stockcharts.com
The top chart is the Nasdaq Daily Advance-Decline Line, a technical indicator that plots the difference between the number of advancing and declining stocks. In January 2023, the October 2022 downtrend was broken (solid green line) but quickly reversed lower in February 2023, when most of the stock participation was the large Mega Cap Stocks.
The AD-Line (top chart) broke support (purple circle) in August and remains weak, closing below old support (purple horizontal line) and in a downtrend from August 2022 (green dotted line) and July (blue line).
The Nasdaq (lower chart) fell slightly last week and remains in a downtrend from July. Without positive market breadth, better tape action, and a break of the AD line and price downtrends, more time is needed for a major bottom.
Figure 8: Daily New York Stock Exchange (NYSE) New Lows
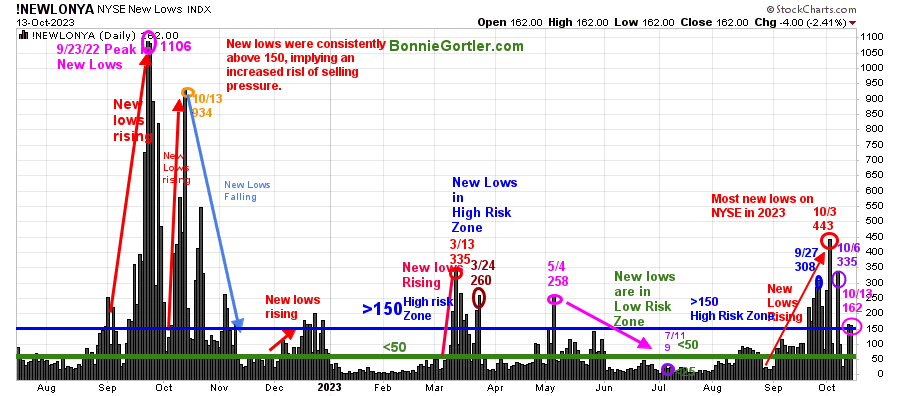
101323 NYSE New Lows Daily
Source: Stockcharts.com
Watching New Lows on the New York Stock Exchange is a simple technical tool that helps awareness of the immediate trend’s direction. New lows warned of a potential sharp pullback, high volatility, and “panic selling” for most of 2022, closing above 150. The peak reading was 9/23/22 when New Lows made a new high of 1106 (pink circle), and New Lows expanded to their highest level in 2023 on 3/13/23 (red circle) to 335.
New Lows increased in September (red arrow on the right) toward the high-risk zone greater than 150, peaking at 443 on 10/3, the highest reading since October 2022.
During the latest decline, New lows stopped accelerating and did not take out the October high of 335 on 10/6 (purple circle), a positive sign. New lows closed Friday, 10/13, at 162 (pink circle) in a high-risk zone after three days of falling below 150.
In the short term, it will be a positive sign if the New Lows contract quickly falls below 150 for two consecutive days and then contracts towards 50, ultimately closing below 25 (the lowest risk zone). On the other hand, if New Lows remain above 150, it will imply an increased risk of further downside.
Learn more about the significance of New Lows in my book, Journey to Wealth, published on Amazon. If you would like a preview, get a free chapter here.
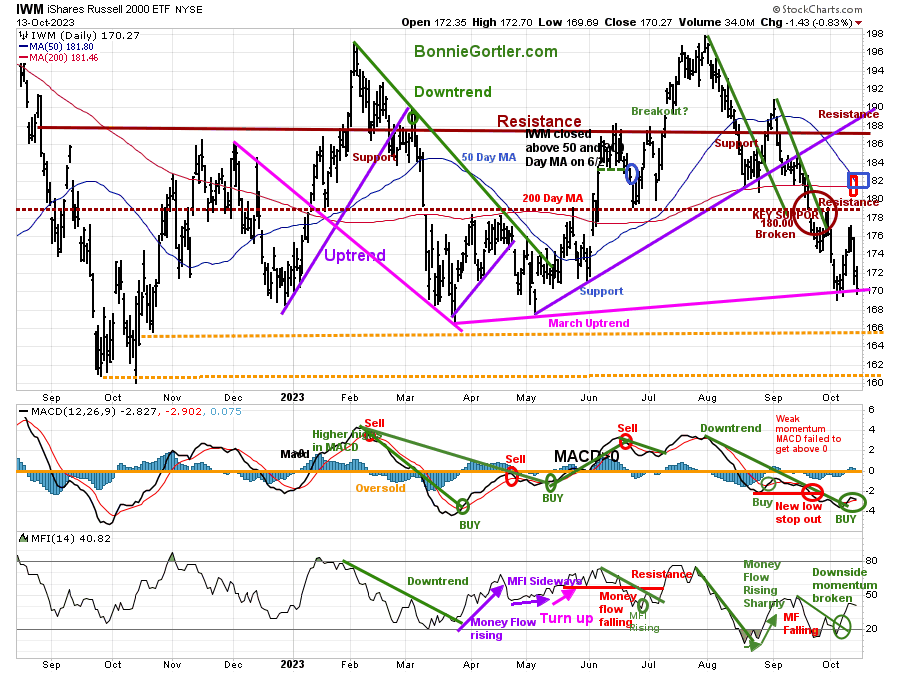
Figure 9: Daily iShares Russell 2000 (IWM) Price (Top) and 12-26-9 MACD (Middle and Money Flow (Bottom)
101323 IWM Daily
Source: Stockcharts.com
The top chart is the daily iShares Russell 2000 Index ETF (IWM), the benchmark for small-cap stocks, with a 50-Day Moving Average (MA) (blue line) and 200-Day Moving Average (MA) (red line) that traders watch and use to define trends.
IWM closed at 170.27, down -1.58% for the week, continuing to make lower highs and lag the overall market. IWM closed slightly above support at 170.00 but below the 200-day MA (blue rectangle) and the 50-day MA, which are converging.
Support is at 170.00, 166.00, and 161.00. Resistance is at 172.00, 176.00, 182.00, and 188.00.
MACD (middle chart generated a buy last week. MACD is falling and below 0. Its positive downside momentum has slowed with the August downtrend broken. A turn-up in MACD now would give a favorable rising double-bottom formation. On the other hand, a turndown, with MACD making a lower low, would be negative and imply downside momentum is accelerating, and more downside remains.
Money Flow (lower chart) stopped rising and turned down after breaking the downtrend since September. A turn-up this week above 50 would be positive.
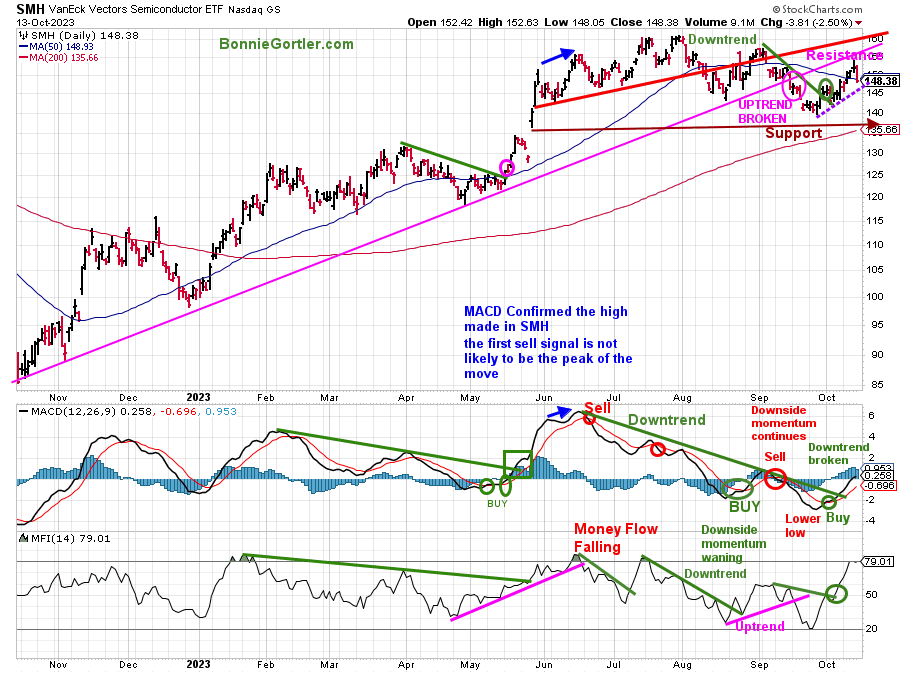
Figure 10: Daily Semiconductors (SMH) (Top) and 12-26-9 MACD (Middle) and Money Flow (Bottom)
101323 SMH Daily
Source: Stockcharts.com
The top chart shows the Daily Semiconductors (SMH) ETF, concentrated mainly in US-based Mega-Cap Semiconductors companies. SMH tends to be a lead indicator for the market when investors are willing to take on increased risk and the opposite when the market is falling.
Semiconductors, one of the best areas, the last few weeks (SMH) gained +.02% for the week but were down -2.50% on Friday as profit-taking set in before the weekend.
Support is at 145.00, 140.00 and 135.00. Resistance is at 151.00, 155.00, and 160.00.
SMH still has work to do because SMH remains below the 2022 October uptrend (pink line), where the uptrend in October broke down before turning up after holding above support (brown line).
MACD (middle chart) remains on a buy and has broken the June downside momentum trendline (green line).
Money Flow (lower chart) is rising, at its highest level since July, after breaking the September downtrend (green line), confirming the MACD buy and implying strong interest in Semiconductors despite Friday’s selling.
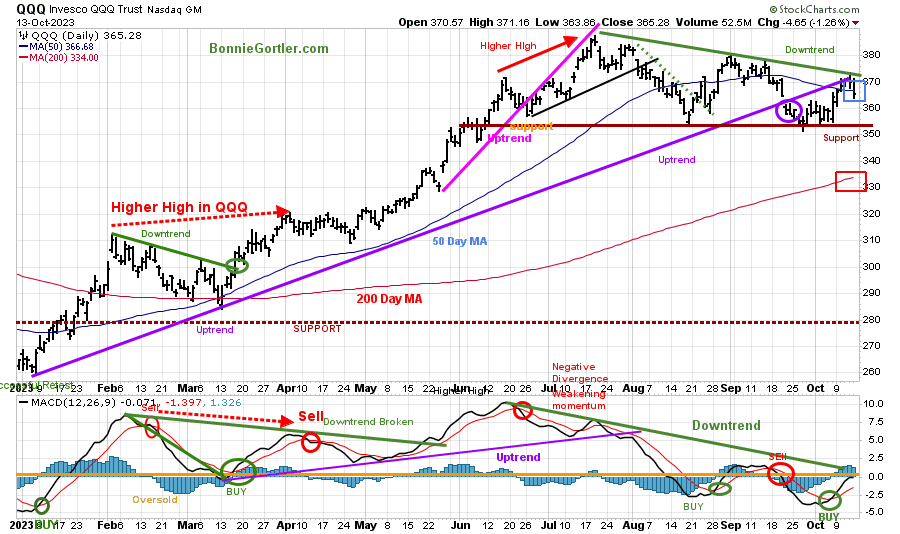
Figure 11: Daily Invesco QQQ Trust (QQQ) Price (Top) and 12-26-9 MACD (Bottom)
101323 QQQ Daily
Source: Stockcharts.com
The chart shows the daily Invesco QQQ, an exchange-traded fund based on the Nasdaq 100 Index. QQQ made a low in October 2022 (red circle), followed by a successful retest of the low in early January 2023 and the start of an uptrend.
QQQ broke its 2023 uptrend (purple circle) after a few attempts at the July high.
Last week, QQQ gained +0.16%, holding support at 355.00, but failed to break the July downtrend (green line), closing at 365.28, slightly below the 50-day Moving Average (blue rectangle) but above the 200-day Moving Average (red rectangle).
Support is 355.00, 350.00, and 335.00, with resistance at 372.00, 375.00, and 380.00.
The bottom chart, MACD (12, 26, 9), remains on a buy, but there is no confirmation of a break of the June momentum downtrend (green line).
At this time, I would like to see QQQ close above Friday’s high of 371.16 and support hold at 355.00.
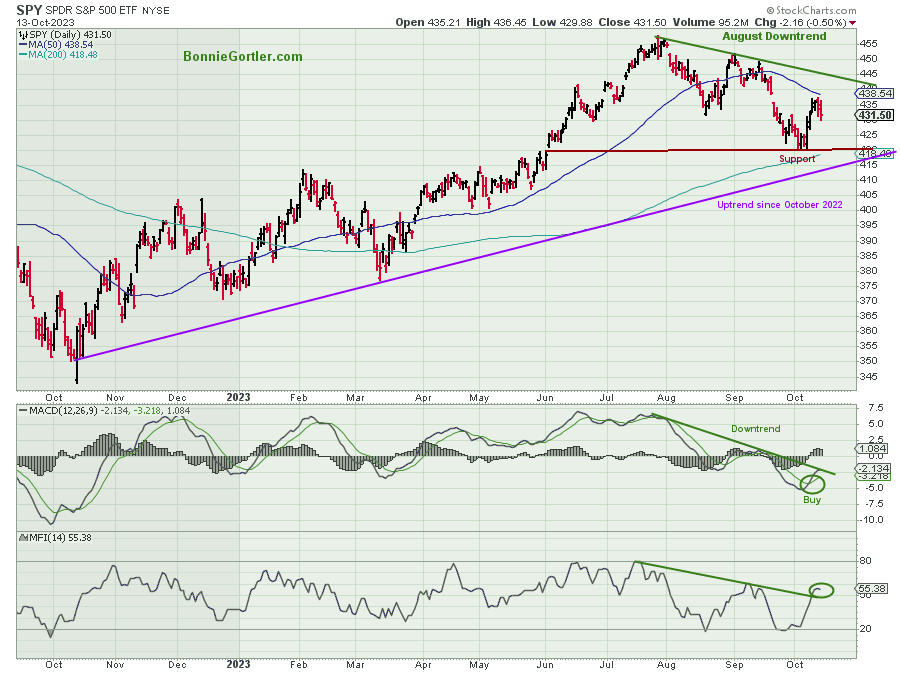
Figure 12: The S&P 500 Index (SPY) Daily (Top) and 12-26-9 MACD (Bottom) and Money Flow (Bottom)
 Source: Stockcharts.com
The S&P 500 (SPY) uptrend remains since October 2022 (purple line).
The SPY was up +0.46%, closing at 431.50, remaining below the falling 50-day Moving Average (blue rectangle) but above the 200-day Moving Average (red rectangle).
Resistance is 439.00, 446.00, and 452.00. Support is at 425.00, 418.00, and 415.00.
MACD (bottom chart) generated a buy, below 0, rising and now close to breaking the downtrend in momentum.
It would be favorable if SPY holds above the 10/6 low at 420.60 and turns up closing above the 50-day MA, which stands at 438.54 at the time of this writing, and then breaks the August downtrend.
Summing Up:
A volatile week ended on a sour note, with stocks giving up early gains on Friday as volatility was up more than 15%, gold jumped over 3%, and Crude Oil over 5% as geopolitical risk increased. Semiconductors and Technology stocks were under selling pressure as profit-taking occurred before the weekend. Market breadth is lackluster, with small-cap stocks, Growth, and Value much weaker than the S&P 500. On the plus side, short-term momentum oscillators generated buy signals, and downside momentum has slowed, no longer accelerating. Be alert to the short-term favorable potential double-bottom formations leading to a tradeable buying opportunity now if the October low holds and the major averages turn up.
Remember to manage your risk, and your wealth will grow.
Let’s talk investing. You are invited to set up your Free 30-minute Wealth and Well-Being Strategy session by clicking here or emailing me at Bonnie@BonnieGortler.com. I would love to schedule a call and connect with you.
Disclaimer: Although the information is made with a sincere effort for accuracy, it is not guaranteed that the information provided is a statement of fact. Nor can we guarantee the results of following any of the recommendations made herein. Readers are encouraged to meet with their own advisors to consider the suitability of investments for their own particular situations and for determination of their own risk levels. Past performance does not guarantee any future results.


Create more wealth in your life
with these simple strategies.
As an added bonus you will also
receive BG’s Updates and Ezine

Discover how to quickly create more well-being in your life with these simple strategies.
As an added bonus you will also
receive BG’s Updates and Ezine

As an added bonus you will receive BG’s Updates and Ezine

All work listed on BonnieGortler.com is licensed under a Creative Commons Attribution - Noncommercial - No Derivative Works 3.0 Unported License.


Free Report:
Grow and Sustain Your Wealth
Discover how to grow your money with these easy, simple steps.

