

10 Simple Tips for Financial Well-Being
07/01/2026
The uptrend continued last week after a memorable November. Ten of eleven S&P SPDR sectors were higher last week. Real Estate (XLRE) and Materials (XLB) were the best sectors, while Energy (XLE) and Communications lagged. The SPDR S&P 500 ETF Trust (SPY) gained +0.83%.
S&P SPDR Sector ETFs Performance Summary
11/24/23-12/01/23
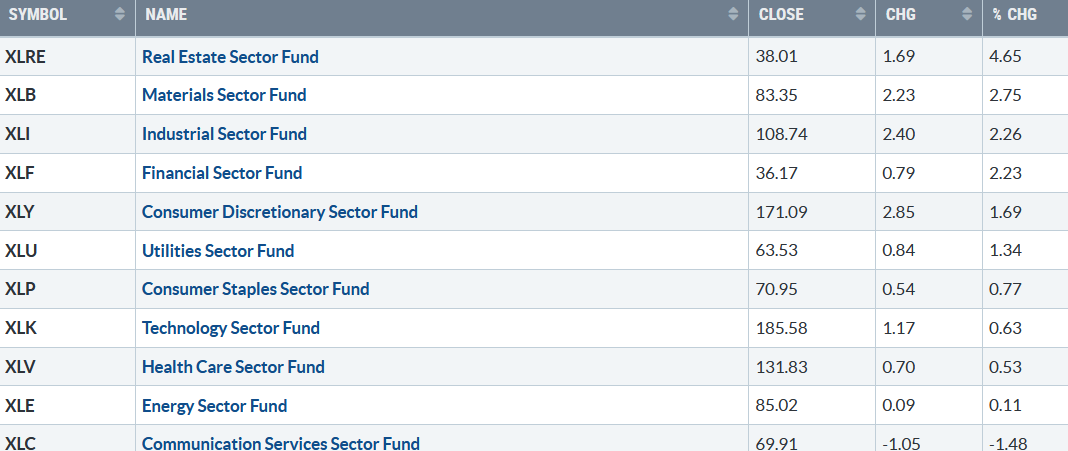
120123 SPDR Sectors
Source: Stockcharts.com
Figure 2: Bonnie’s ETFs Watch List Performance Summary
11/24/23-12/01/23

Source: Stockcharts.com
Transportation, Small Cap Growth, and Small Value led the way. Biotechnology stocks have gained strength, while Semiconductor and Technology stocks, which have led the advance, have slowed their gains. China remains out of favor.
Figure 3: CBOE Volatility Index VIX
120123 VLE Daily
Source: Stockcharts.com
The CBOE Volatility Index (VIX), a measure of fear, traded above 20.00 for most of 2022, with a high at 36.95 on 3/7 (blue circle), which did not get violated in 2023.
VIX closed slightly higher at 12.63 (purple circle) last week, near its lowest close since January 2020.
If the VIX remains below 16, intraday volatility will be limited.
Figure 4: UST 10YR Bond Yields Daily
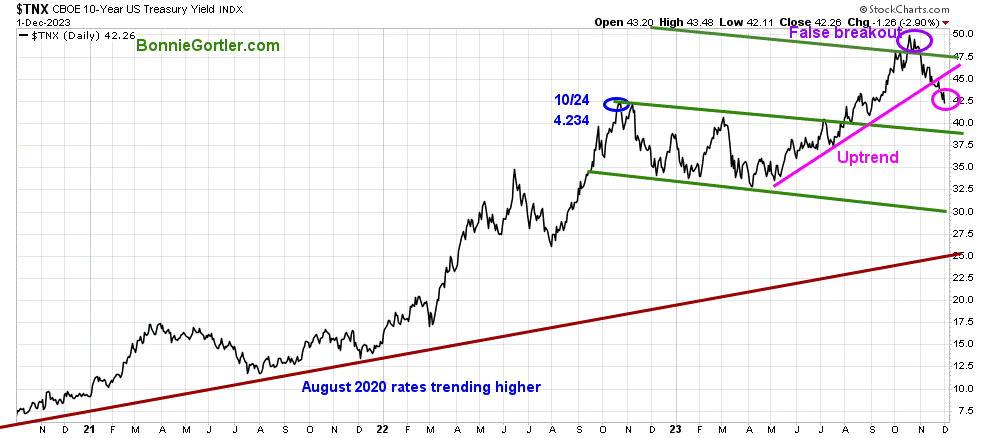
20123 UST 10 Yr Bond Yields Daily
Source: Stockcharts.com
The 10-year U.S. Treasury yields fell last week, closing at 4.226%, trending down and remaining below the May uptrend (pink line).
Support remains at 3.90%. Falling yields will continue to be short-term positive for equities.
The major market averages continued to climb, with the Dow gaining +2.42%, up for the fifth consecutive week, the longest winning streak since 2021. The S&P 500 up +0.77%, and the Nasdaq gained +0.38%. The Russell 2000 Index led the advance, gaining +3.05%. The S&P 500, and Nasdaq had their best monthly gains since July 2022.
Are you interested in learning about the stock market? Learn how to implement a powerful wealth-building mindset and simple, reliable strategies to help you grow your wealth in my eCourse Wealth Through Investing Made Simple in the comfort of your home. Learn more here.
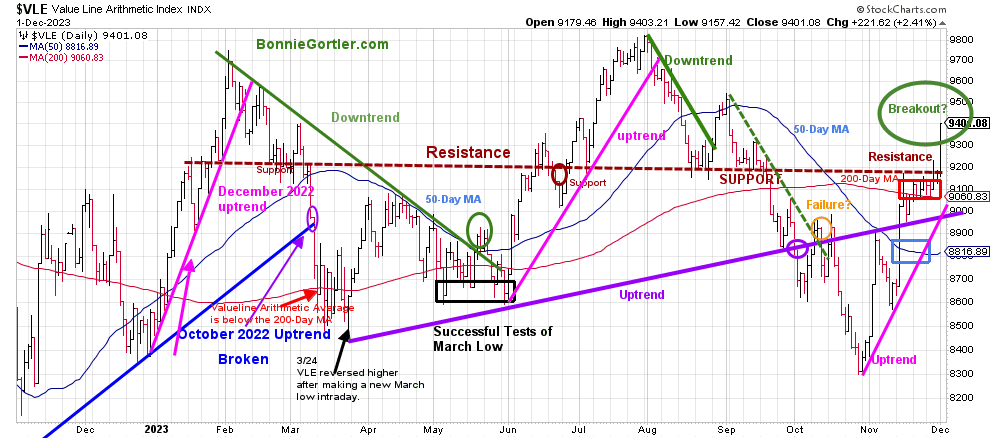
Figure 5: Value Line Arithmetic Average

120123 VLE Daily
Source: Stockcharts.com
The Value Line Arithmetic Index ($VLE) is a mix of approximately 1700 stocks. VLE broke the October 2022 uptrend in early March 2023 (blue line), and April, May, and June successfully tested the March low and ultimately made a new low in October 2023.
The daily trend of VLE is up. VLE closed higher last week at 9401.08, up 2.80%, breaking out above resistance and at its highest close since September. VLE remains above the 50-day MA (blue rectangle) and the 200-day MA (red rectangle), a sign of underlying strength.
Support is 9200, 9000, 8800, and 8600. Resistance is at 9500, 9700, and 9800.
It is bullish that VLE shows strength, closing above 9200 resistance and in an uptrend.
Do you want to go deeper into charting? Learn more in the comfort of your home today with my Free 33-minute Training, Charting Strategies to Cut Risk and Trade with the Trend. Sign up here.
Market breadth continues to improve.
Weekly market breadth was positive on the New York Stock Exchange Index (NYSE) and for the Nasdaq. The NYSE had 2305 advances and 652 declines, with 286 new highs and 64 new lows. There were 3096 advances and 1660 declines on the Nasdaq, with 338 new highs and 373 new lows.
Continued positive market breadth on the NYSE and Nasdaq would be bullish.
If you want to go more in-depth with charts, I invite you to join my Free FB group, Wealth Through Market Charts.
Figure 6: Daily New York Stock Exchange (NYSE) New Lows
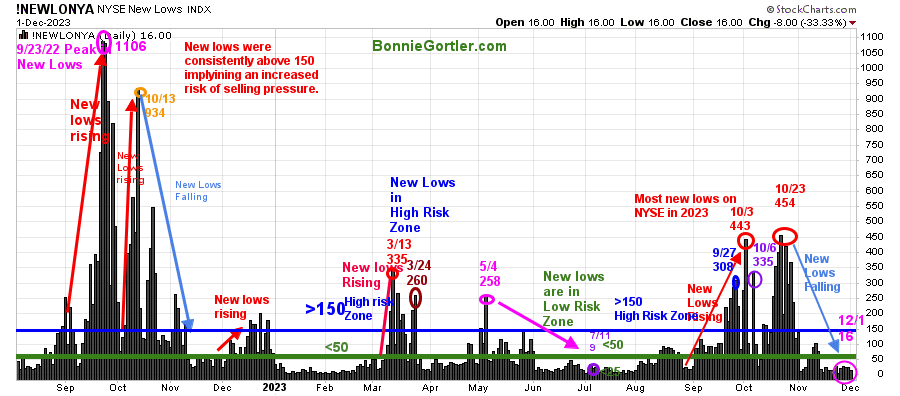
120123 NYSE New Lows Daily
Source: Stockcharts.com
Watching New Lows on the New York Stock Exchange is a simple technical tool that helps awareness of the immediate trend’s direction. New lows warned of a potential sharp pullback, high volatility, and “panic selling” for most of 2022, closing above 150. The peak reading was 9/23/22 when New Lows made a new high of 1106 (pink circle), and New Lows expanded to their highest level in 2023 on 3/13/23 (red circle) to 335.
New Lows increased in September (red arrow on the right) toward the high-risk zone greater than 150, peaking at 443 on 10/3, the highest reading since October 2022.
New lows had stopped accelerating in early October. However, the decline was not complete until the end of the month as New Lows made only a slight new high, peaking at 454 (red circle) on 10/23.
New lows on the NYSE closed at 16 (pink circle) last week, remaining in the lowest risk zone below 25. It would remain positive and imply low risk if New Lows stay between 25 and 50.
On the other hand, an increase above 150 would be a warning sign of a market correction.
Learn more about the significance of New Lows in my book, Journey to Wealth, published on Amazon. If you would like a preview, get a free chapter here.
Figure 7: Daily iShares Russell 2000 (IWM) Price (Top) and 12-26-9 MACD (Middle and Money Flow (Bottom)
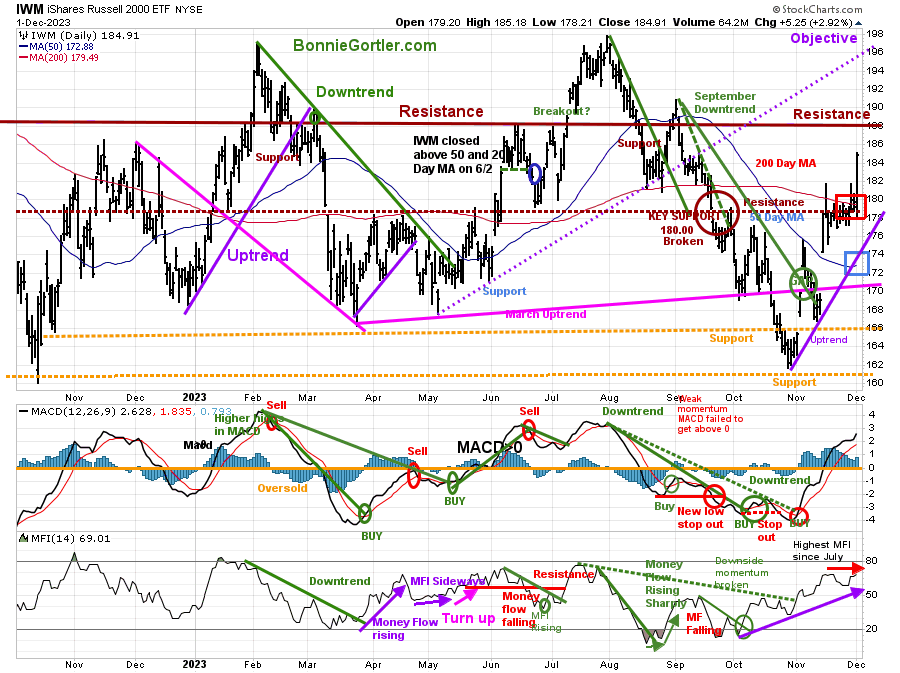
120123 IWM Daily
Source: Stockcharts.com
The top chart is the daily iShares Russell 2000 Index ETF (IWM), the benchmark for small-cap stocks, with a 50-Day Moving Average (MA) (blue line) and 200-Day Moving Average (MA) (red line) that traders watch and use to define trends.
IWM led the market higher, closing at 184.91, up +3.11% last week. IWM broke through resistance at 182.00, remaining above the 50-day MA and strong enough to close above the 200-day MA (blue rectangle).
Support remains at 178.00, 170.00, 166.00, and 161.00. Resistance is at 182.00, 188.00, and 196.00.
MACD (middle chart) remains on a buy, above 0, and rising. After a few whipsaws, MACD has shown continued strength since breaking the August downtrend.
Money Flow (lower chart) turned down the previous week but quickly turned up, which is a positive sign if Money Flow moves higher.
Keep an eye on the Russell 2000 (IWM) for a clue for this week’s direction. It would be positive if IWM showed leadership and was stronger than the S&P 500. However, if IWM lags, it would be a clue that a retracement to 176.00 is necessary before another attempt toward 188.00 and higher.
Figure 8: Daily Semiconductors (SMH) (Top) and 12-26-9 MACD (Middle) and Money Flow (Bottom)
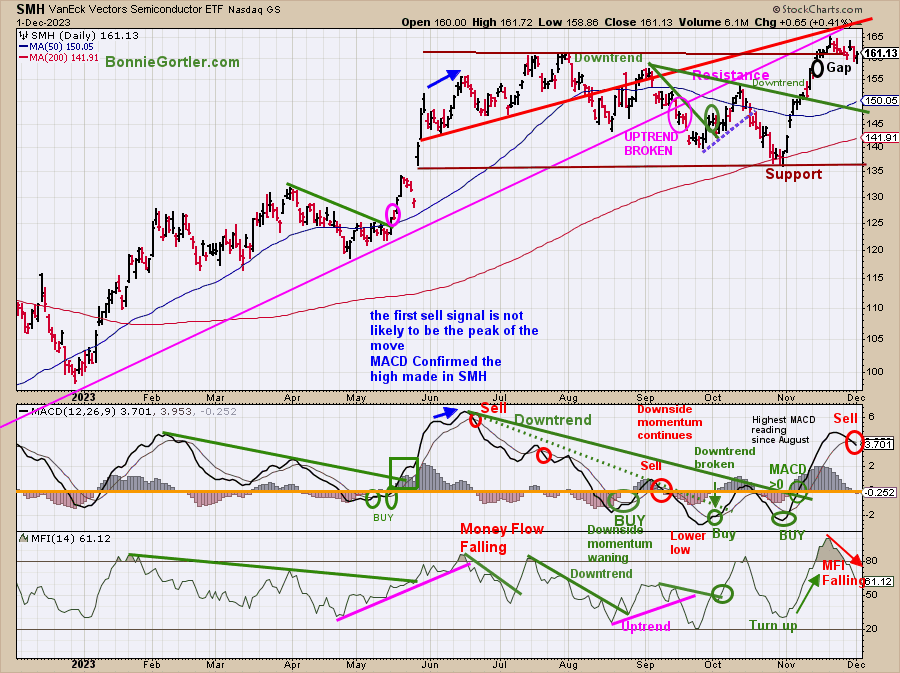
120123 SMH Daily
Source: Stockcharts.com
The top chart shows the Daily Semiconductors (SMH) ETF, concentrated mainly in US-based Mega-Cap Semiconductors companies. SMH tends to be a lead indicator for the market when investors are willing to take on increased risk and the opposite when the market is falling.
The Semiconductor ETF (SMH) rally stalled after three weeks of solid gains and has been consolidating over the past two weeks, not giving up much ground. SMH fell -0.50% the previous week and -0.39% last week, closing at 161.13.
Support remains at 155.00, 148.00, and 137.00. Resistance is at 168.00. The Short-term objective remains185.00.
MACD (middle chart) is on a sell, falling after reaching its highest MACD reading since August. With MACD confirming the high in SMH, the first sell may not be significant.
Money Flow (lower chart) continues to fall after reaching the highest level in 2023, implying that investors have started taking profits to rotate into other market sectors.
The price of gains is likely to slow in Semiconductors after their strong performance this year.
Figure 9: Daily Invesco QQQ Trust (QQQ) Price (Top) and 12-26-9 MACD (Bottom)
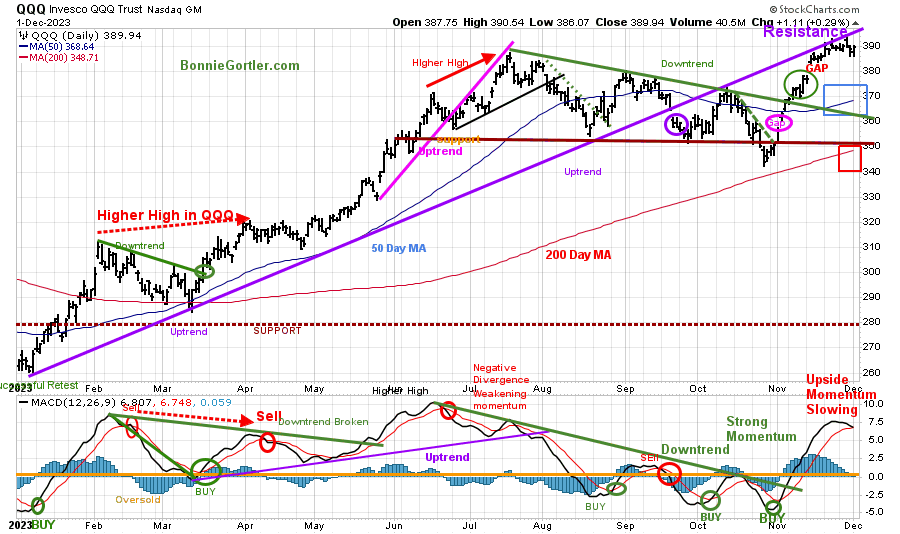
120123 QQQ Daily
Source: Stockcharts.com
The chart shows the daily Invesco QQQ, an exchange-traded fund based on the Nasdaq 100 Index. QQQ made a low in October 2022 (red circle), followed by a successful retest of the low in early January 2023 and the start of an uptrend.
QQQ broke the July downtrend (green line) and continued sharply higher.
Last week, the Nasdaq 100 (QQQ) was little changed, up +0.11%, closing at 389.94. QQQ remains above the 50-day Moving Average (blue rectangle) and the 200-day Moving Average (red rectangle), a sign of underlying strength.
Support is 380.00, 376.00, 368.00, and 350.00, with resistance at 393.00.
The bottom chart, MACD (12, 26, 9), remains on a buy, above 0, falling, with the upside momentum slowing after reaching its highest reading since July and close to giving a sell.
It is bullish that the gap (pink circle) remains, not filled from two weeks ago. However, with MACD momentum slowing and resistance slightly above, after significant gains in November, be alert to profit-taking continuing if QQQ does not get above 393.00.
Figure 10: The S&P 500 Index (SPY) Daily (Top) and 12-26-9 MACD (Bottom)
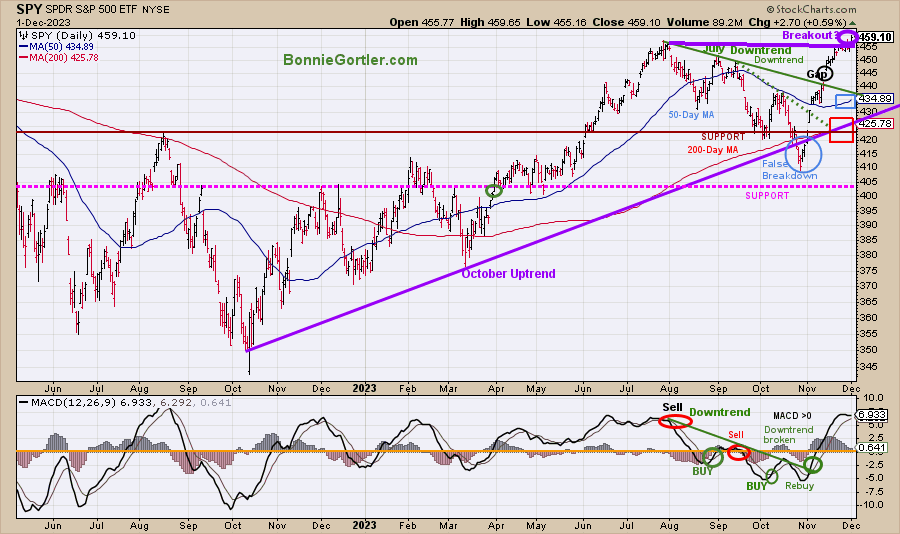
120123 SPY Daily
Source: Stockcharts.com
The S&P 500 (SPY) had a false breakdown (blue circle) in October after being in an uptrend (purple line). Two downtrends were in effect and broken to the upside in September (green dotted line) and August (green solid line).
The daily trend is up. SPY continued higher, closing at 459.10, up +0.83% for the week, remaining above the 50-day Moving Average (blue rectangle) and the 200-day Moving Average (red rectangle), a sign of strength.
Support is at 445.00, 440.00, 433.00, 425.00, and 405.00. SPY was strong enough to close above resistance at 455.00 (purple horizontal line). Time will tell if the breakout above resistance is real or if a consolidation will occur.
MACD (bottom chart) remains on a buy above 0, falling and close to a sell.
A higher objective for the SPY will be given to potentially 485.00 if the SPY closes above 460.00 for two consecutive days and remains above last week’s low of 453.34.
Figure 11: S&P 500 Bullish Percent Index
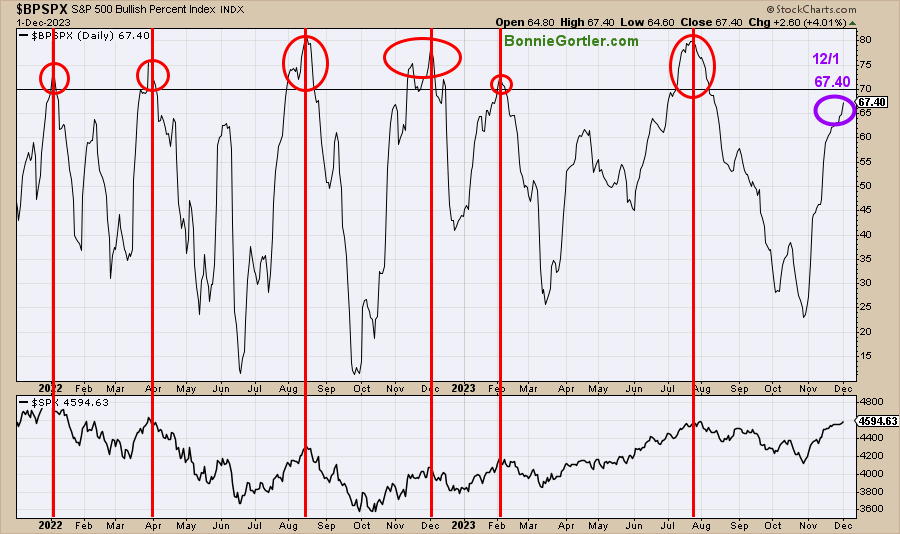
120123 SPY Bullish Percentage Index Daily
Source: Stockcharts.com
The Bullish Percent Index (BPI), developed by Abe Cohen in the 1950s, is a breadth indicator based on the number of stocks based on Point and Figure Buy signals. The indicator helps you know the market’s health and when it’s overbought or oversold.
When the bullish percent index is above 70%, the market is overbought, and when the indicator is below 30%, the market is oversold. Like other overbought indicators, sometimes it does not get as high or as low.
In 2022 and 2023, the indicator reached 70 (overbought) six times (red circles). All occurrences were near market peaks (red lines). The BPI closed at 63 (purple circle), getting closer to achieving the 70 level if there is continued strength in the SPY. A reading over 70, followed by a retracement below 70, would give a sell signal on this indicator.
For now, the BPI is rising and on a buy closing at 67.40, getting closer to 70. This week will likely tell if BPI has the strength to get above 70 or if it will turn lower before reaching 70 (overbought).
Summing Up:
The trend remains up. The major market averages rose, with the Nasdaq and S&P 500 up for the fifth consecutive week, led by the Dow. The market is getting extended for the short term. It’s somewhat concerning that Semiconductors (SMH), which have led the market higher, did not participate in the rally the last two weeks, and technology stocks are also weakening. Daily momentum oscillators are weakening, and investor sentiment no longer shows fear as it did one month ago, now showing greed (a contrary indicator). However, market breadth continues to improve, and the Russell 2000 broke through resistance, joining the advance, which is positive. The bulls will remain in control as long as market breadth is positive and the Russell 2000 is stronger than the S&P 500. Since we are in December, it’s wise to be alert for profit-taking by investors looking to lock in the recent gains to begin sooner rather than later, which could slow the pace of the advance.
Remember to manage your risk, and your wealth will grow.
Let’s talk investing. You are invited to set up your Free 30-minute Wealth and Well-Being Strategy session by clicking here or emailing me at Bonnie@BonnieGortler.com. I would love to schedule a call and connect with you.
Disclaimer: Although the information is made with a sincere effort for accuracy, it is not guaranteed that the information provided is a statement of fact. Nor can we guarantee the results of following any of the recommendations made herein. Readers are encouraged to meet with their own advisors to consider the suitability of investments for their own particular situations and for determination of their own risk levels. Past performance does not guarantee any future results.


Create more wealth in your life
with these simple strategies.
As an added bonus you will also
receive BG’s Updates and Ezine

Discover how to quickly create more well-being in your life with these simple strategies.
As an added bonus you will also
receive BG’s Updates and Ezine

As an added bonus you will receive BG’s Updates and Ezine

All work listed on BonnieGortler.com is licensed under a Creative Commons Attribution - Noncommercial - No Derivative Works 3.0 Unported License.


Free Report:
Grow and Sustain Your Wealth
Discover how to grow your money with these easy, simple steps.

