

10 Simple Tips for Financial Well-Being
07/01/2026
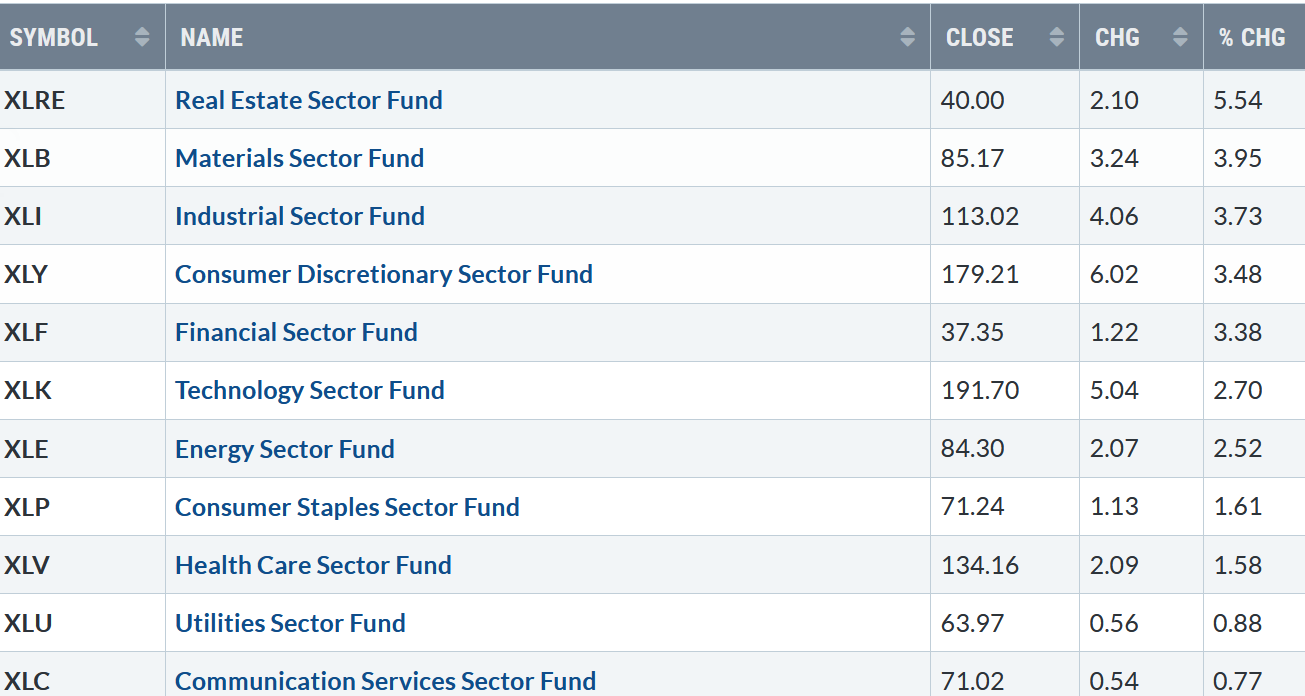
The rally broadens. All eleven S&P SPDR sectors were higher last week. Real Estate (XLRE) and Materials (XLB) were the best sectors, while Utilities (XLU) and Communication Services (XLC) were the weakest but still profitable. The SPDR S&P 500 ETF Trust (SPY) gained +2.40%.
S&P SPDR Sector ETFs Performance Summary 12/8/23 – 12/15/23
121523 SPDR Sectors
Source: Stockcharts.com
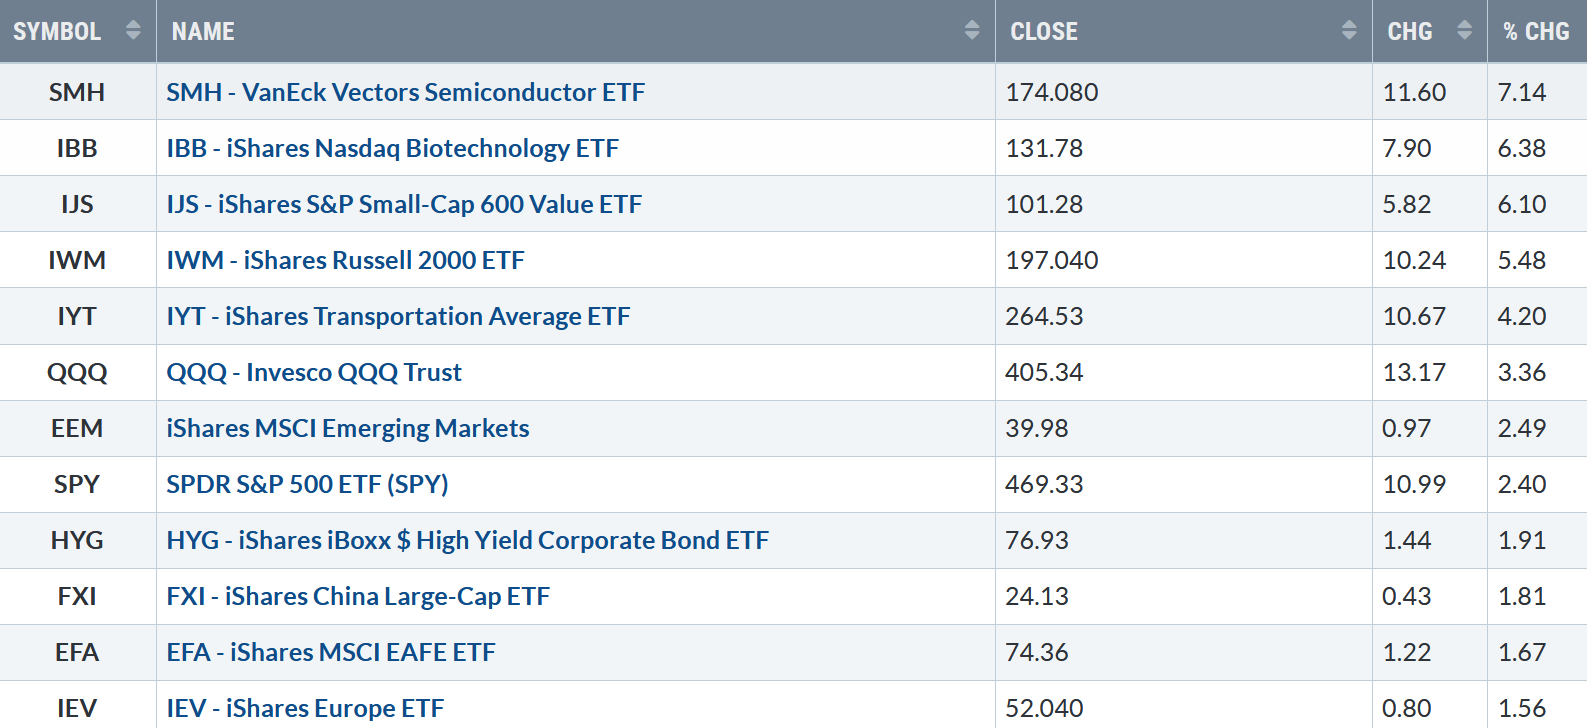
Figure 2: Bonnie’s ETFs Watch List Performance Summary 12/8/23 – 12/15/23
121523 Week ETFs
Source: Stockcharts.com
Semiconductor, Biotechnology, Small Cap Value, Small Cap Growth, and Transportation led the market higher. International markets rose but were not as strong as U.S. equities.
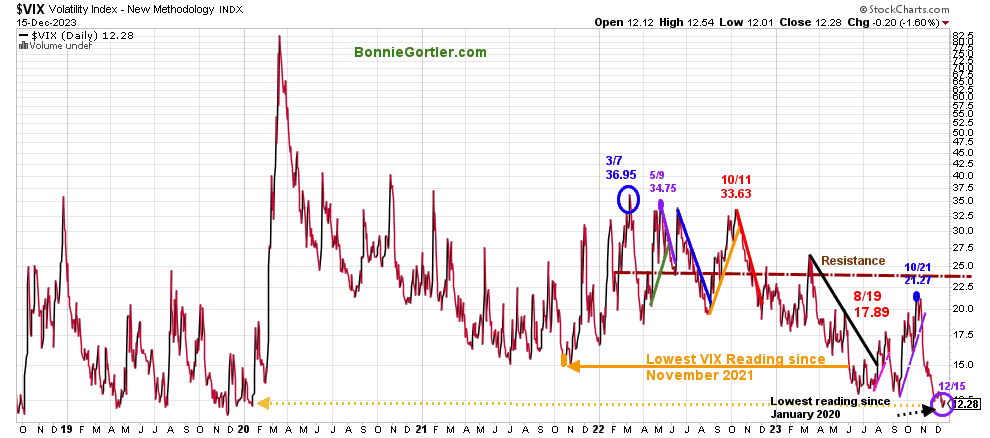
Figure 3: CBOE Volatility Index VIX
121523 VIX Daily
Source: Stockcharts.com
The CBOE Volatility Index (VIX), a measure of fear, traded above 20.00 for most of 2022, with a high at 36.95 on 3/7 (blue circle), which did not get violated in 2023.
VIX trended lower last week, closing at 12.28, with an intraday low of 12.07 on Tuesday not seen since January 2020 (dotted orange line). Historically, low volatility is positive for the market. If the VIX remains below 16, intraday volatility will be limited.
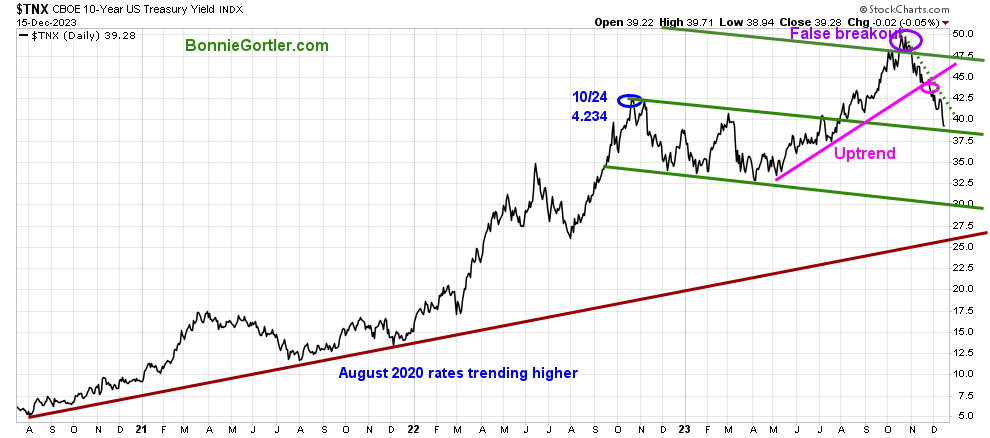
Figure 4: UST 10YR Bond Yields Daily
121523 UST 10 Yr Bond Yields Daily
Source: Stockcharts.com
The 10-year U.S. Treasury yields fell last week, closing at 3.928%, below 4% for the first time since July 31, remaining below the May uptrend (pink line) and in a downtrend from October after the false break out.
Support remains at 3.90%. Falling yields will continue to be short-term positive for equities. A quick rise in yields would likely ignite a short, brief pullback.
The major market averages rose for the seventh week, with the Dow up + 2.92%, making a record high, the S&P 500 +2.49%, while the Nasdaq gained +2.85%. The Russell 2000 Index led the advance, gaining +5.55%.
Are you interested in more knowledge about the stock market? Learn how to implement a powerful wealth-building mindset and simple, reliable strategies to help you grow your wealth in my eCourse Wealth Through Investing Made Simple in the comfort of your home. Learn more here.
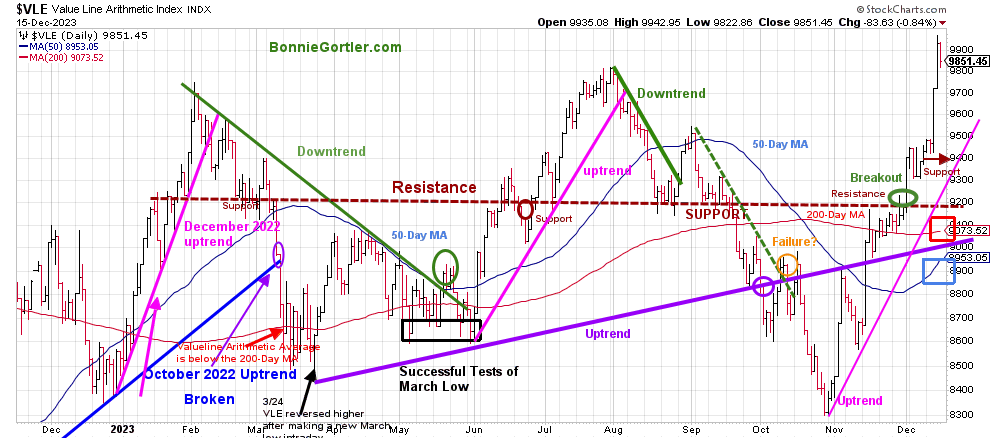
Figure 5: Value Line Arithmetic Average
121523 VLE Daily
Source: Stockcharts.com
The Value Line Arithmetic Index ($VLE) is a mix of approximately 1700 stocks. VLE broke the October 2022 uptrend in early March 2023 (blue line), and April, May, and June successfully tested the March low and ultimately made a new low in October 2023.
The daily trend of VLE remains up. VLE penetrated three resistance levels, 9500, 9700, and 9800, last week, closing at 9851.45, up +4.48%, and taking out the August high. VLE remains above the 50-day MA, which is rising (blue rectangle), and the 200-day MA (red rectangle), a sign of underlying strength.
Support is 9700, 9400, 9200, and 9000. Resistance is at 9950. It would remain positive to retrace towards 9700 and then rise again, surpassing this week’s high of 9972.08.
Do you want to go deeper into charting? Learn more in the comfort of your home today with my Free 33-minute Training, Charting Strategies to Cut Risk and Trade with the Trend. Sign up here.
Improving market breadth is encouraging.
Weekly market breadth was mixed on the New York Stock Exchange Index (NYSE) and the Nasdaq. The NYSE had 2314 advances and 649 declines, with 482 new highs and 71 new lows. There were 3044 advances and 1698 declines on the Nasdaq, with 651 new highs and 422 new lows.
It’s bullish the NYSE and Nasdaq both had an expansion of stocks making new highs.
If you want to go more in-depth with charts, I invite you to join my Free FB group, Wealth Through Market Charts.
Figure 6: Daily New York Stock Exchange (NYSE) New Lows
Source: Stockcharts.com
Watching New Lows on the New York Stock Exchange is a simple technical tool that helps awareness of the immediate trend’s direction. New lows warned of a potential sharp pullback, high volatility, and “panic selling” for most of 2022, closing above 150. The peak reading was 9/23/22 when New Lows made a new high of 1106 (pink circle), and New Lows expanded to their highest level in 2023 on 3/13/23 (red circle) to 335.
New Lows increased in September (red arrow on the right) toward the high-risk zone greater than 150, peaking at 443 on 10/3, the highest reading since October 2022.
New lows had stopped accelerating in early October. However, the decline was not complete until the end of the month as New Lows made only a slight new high, peaking at 454 (red circle) on 10/23.
Last week, New lows on the NYSE closed at 13 (pink circle), remaining in the lowest risk zone below 25. It would remain positive and imply low risk if New Lows stay between 25 and 50. On the other hand, an increase above 150 would be a warning sign of a market correction.
Learn more about the significance of New Lows in my book, Journey to Wealth, published on Amazon. If you would like a preview, get a free chapter here.
Small Caps gain momentum.
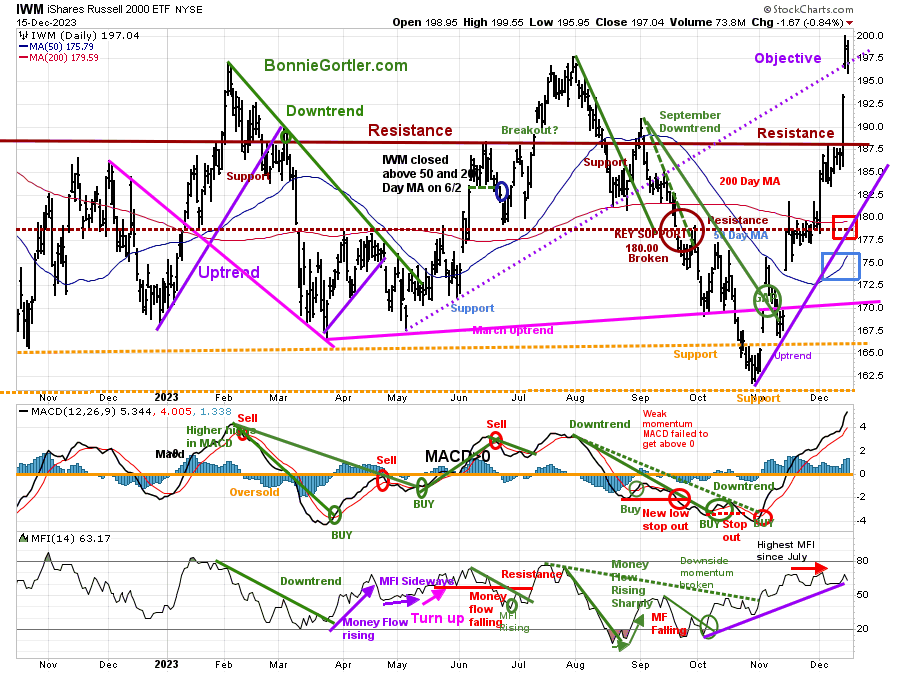
Figure 7: Daily iShares Russell 2000 (IWM) Price (Top) and 12-26-9 MACD (Middle and Money Flow (Bottom)
121523 IWM Daily
Source: Stockcharts.com
The top chart is the daily iShares Russell 2000 Index ETF (IWM), the benchmark for small-cap stocks, with a 50-Day Moving Average (MA) (blue line) and 200-Day Moving Average (MA) (red line) that traders watch and use to define trends.
IWM was a powerhouse, closing at 197.04, up +5.48% last week, closing well above the 50-day MA and the 200-day MA (blue rectangle).
Support is at 194.00, 188.00, and 177.00. Resistance is at 200.00.
MACD (middle chart) remains on a buy, above 0, the year’s highest reading, implying underlying strength and the likelihood of any pullback being short-lived.
Money Flow (lower chart) peaked in November after reaching its highest level since July. The uptrend remains (purple line) for now but is in jeopardy of being broken.
Keep an eye on the Russell 2000 (IWM). It would be positive if IWM remains stronger than the S&P 500. However, if IWM starts to lag, it would be a clue that a retracement after the recent sharp gains is possible.
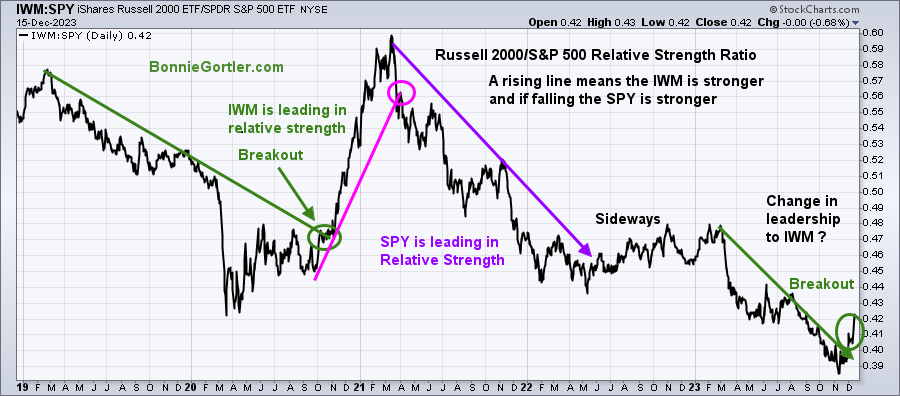
Figure 8: Relative Strength Ratio Russell 2000 vs. S&P 500 (IWM)/S&P500 (SPY)
121523 IWM/SPY Relative Strength Ratio Daily
Source: Stockcharts.com
The chart is the Daily Relative Strength Ratio Russell 2000 vs. S&P 500 (IWM)/S&P500 (SPY). A rising line means the Russell 2000 (IWM) is stronger, and if falling, the S&P 500 (SPY) is stronger.
As mentioned in the 12/8/23 Market Update notice, IWM has broken the downtrend from February 2023 after closing above resistance at 188.00, a positive sign of a change in leadership to small-cap stocks.
Mid Caps gaining in relative strength for the intermediate term
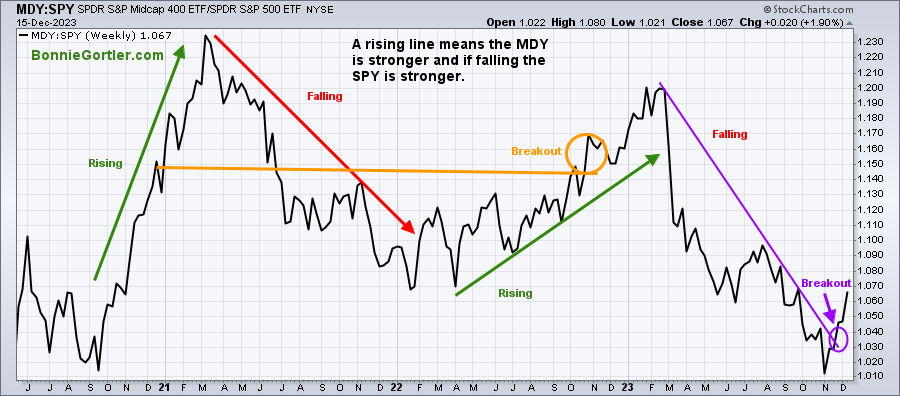
Figure 9: SPDR Midcap 400 (MDY)/ SPDR S&P 500 (SPY) Weekly Relative Strength Ratio
121523 MDY/SPY Relative Strength Ratio Daily
Source: Stockcharts.com
The top part of the chart is the weekly SPDR Midcap 400 (MDY)/ SPDR S&P 500 (SPY) Relative Strength Index Ratio (MDY/SPY). A rising line means the MDY is stronger; if falling, the SPY is stronger.
MDY tracks a market cap-weighted index of mid-cap US companies. Notice that MDY broke the February downtrend and is accelerating, gaining strength after the breakout in November (purple circle). If MDY continues outperforming the SPY, it would imply the breakout is likely sustainable.
Figure 10: Daily Semiconductors (SMH) (Top) and 12-26-9 MACD (Middle) and Money Flow (Bottom)
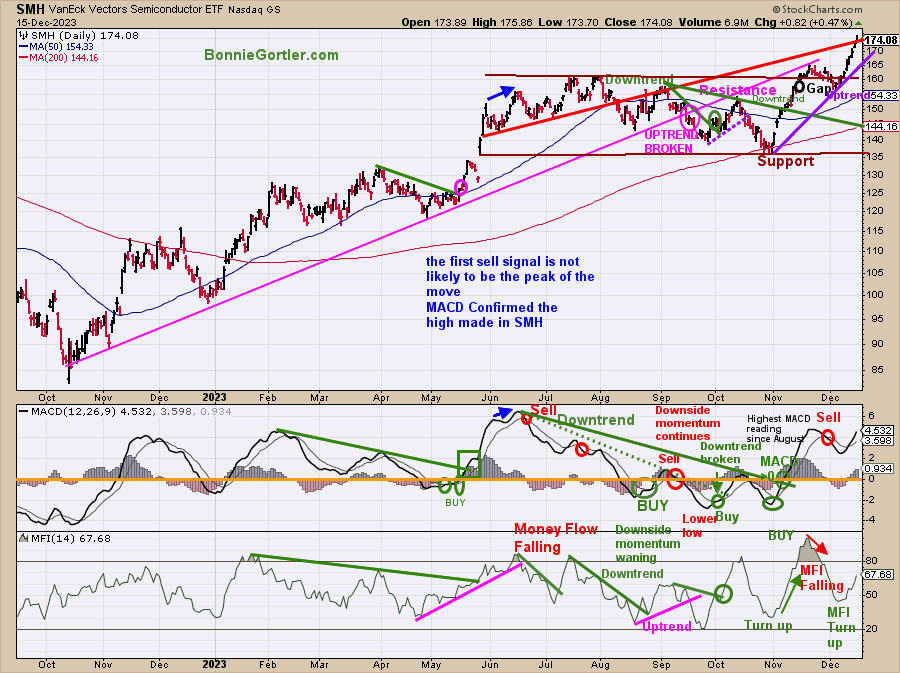
121523 SMH Daily
Source: Stockcharts.com
The top chart shows the Daily Semiconductors (SMH) ETF, which is concentrated mainly in US-based Mega-Cap Semiconductors companies. SMH tends to be a lead indicator for the market when investors are willing to take on increased risk and the opposite when the market is falling.
The Semiconductor ETF (SMH) gained +7.14% last week, closing at 174.08, resuming its uptrend after consolidating over the past few weeks. The short-term objective remains 185.00. Support is at 165.00, 155.00, 145.00, and 135.00. Resistance is at last week’s high of 175.86. The Short-term objective remains 185.00.
MACD (middle chart) is on a sell, rising above 0, a potential double top forming if MACD weakens. It would be positive if MACD makes a higher high, confirming the high made in SMH. On the other hand, if it turns down now, it would be negative.
Money Flow (lower chart) turned higher last week after reaching the highest level in 2023 but did not surpass the previous high. A turndown would imply investors moving away from Semiconductor stocks and cutting back on risk.
Figure 11: Daily Invesco QQQ Trust (QQQ) Price (Top) and 12-26-9 MACD (Bottom)
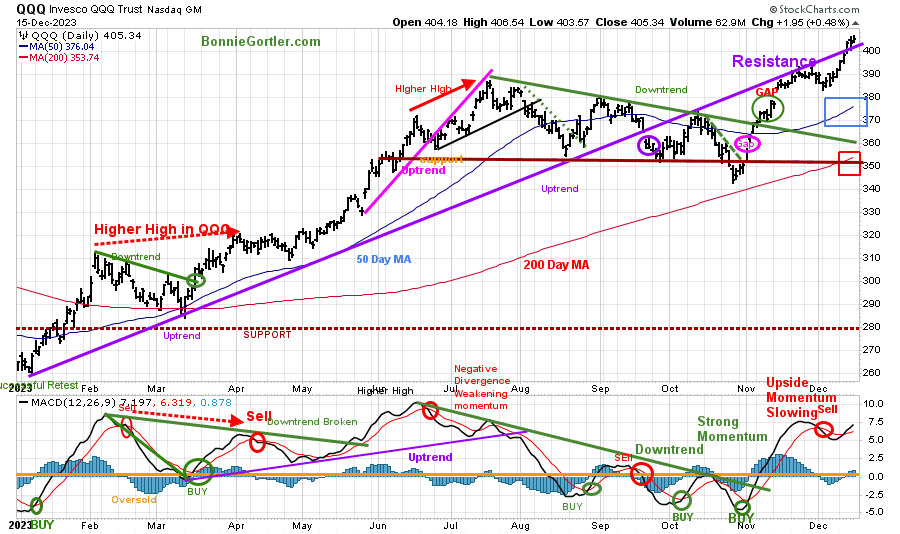
121523 QQQ Daily
Source: Stockcharts.com
The chart shows the daily Invesco QQQ, an exchange-traded fund based on the Nasdaq 100 Index. QQQ made a low in October 2022 (red circle), followed by a successful retest of the low in early January 2023 and the start of an uptrend.
Last week, Nasdaq 100 (QQQ) penetrated 394.00 and gained strength, up +3.36%, closing at 405.34. QQQ remains above the 50-day Moving Average (blue rectangle) and the 200-day Moving Average (red rectangle), a sign of underlying strength.
Support is 390.00, 380.00, 360.00, and 350.00, with resistance at 406.50.
The bottom chart, MACD (12, 26, 9), is on a sell, above 0, rising but not yet making a higher momentum high. A turndown before a new high would be a short-term negative.
Be alert to investors deciding to take profits before the end of the year.
For the latest Bonnie’s charts, visit https://www.bonniegortler.com/marketcharts/
Figure 12: The S&P 500 Index (SPY) Daily (Top) and 12-26-9 MACD (Bottom)
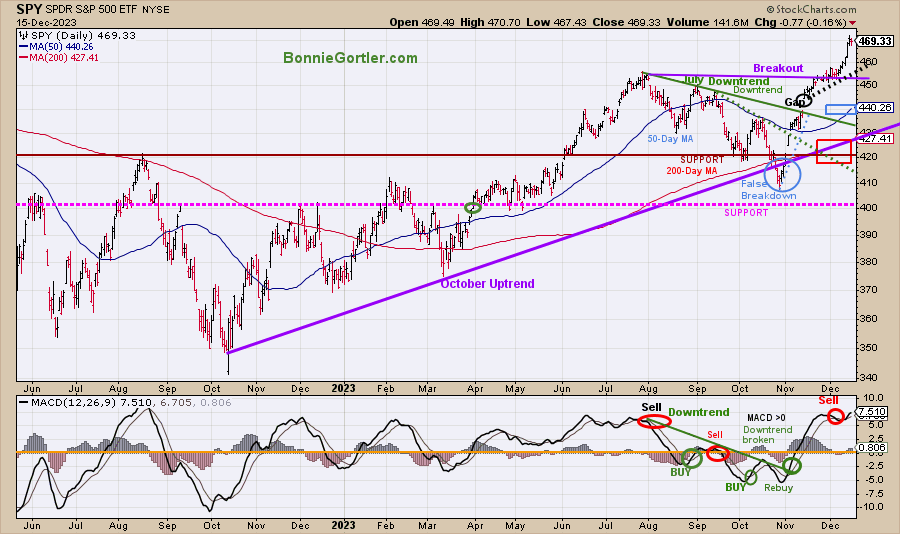
1201523 SPY Daily
Source: Stockcharts.com
The S&P 500 (SPY) had a false breakdown (blue circle) in October after being in an uptrend (purple line). Two downtrends were in effect and broken to the upside in September (green dotted line) and August (green solid line).
The daily trend remains up.
The SPY made a new high for the year, closing at 469.33, up +2.40% for the week, remaining above the 50-day Moving Average (blue rectangle) and the 200-day Moving Average (red rectangle), a sign of strength.
Support is at 455.00, 440.00, 430.00, and 405.00. It’s positive SPY remains above 455.00, where it broke out (purple horizontal line).
MACD (bottom chart) remains on a sell with a potential double top forming.
A higher objective of 485.00 remains for the SPY. It would be positive if SPY remains above 465.00 on Monday and stays above last week’s low of 457.61. With short-term momentum extended, the risk is increasing of a pullback into the end of the year.
Figure 13: S&P 500 Bullish Percent Index
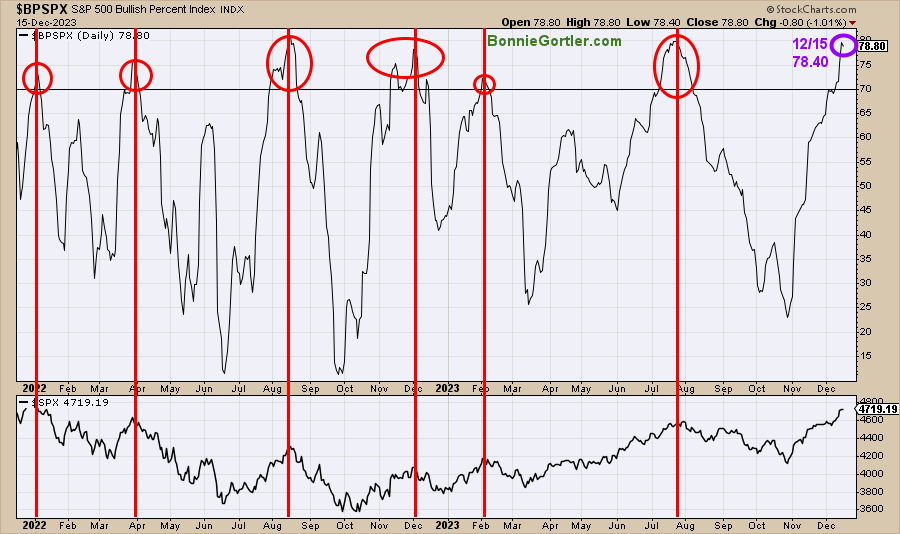
121523 SPY Bullish Percentage Index Daily
Source: Stockcharts.com
The Bullish Percent Index (BPI), developed by Abe Cohen in the 1950s, is a breadth indicator based on the number of stocks based on Point and Figure Buy signals. The indicator helps you know the market’s health and when it’s overbought or oversold.
When the bullish percent index is above 70%, the market is overbought, and when the indicator is below 30%, the market is oversold. Like other overbought indicators, sometimes it does not get as high or as low.
In 2022 and 2023, the indicator reached 70 (overbought) six times (red circles). All occurrences were near market peaks (red lines). Last week, the BPI rose, closing at 78.40 (purple circle). A reading over 70, followed by a retracement below 70, would give a sell signal on this indicator.
Figure 14: The S&P 500 Index (SPY) Weekly (Top) and 12-26-9 MACD (Bottom)
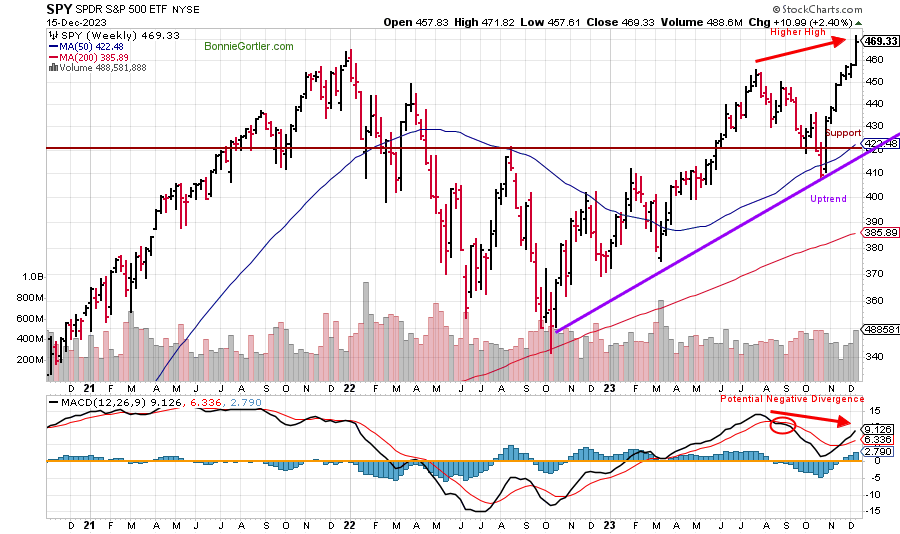
1201523 SPY Weekly
Source: Stockcharts.com
The S&P 500 intermediate trend remains up (purple line). Support is at 422.00. However, be alert that a potential negative divergence in MACD (lower chart) is forming.
Summing Up:
The market uptrend continued after the Federal Reserve meeting, implying lower rates in 2024. Small-cap and Semiconductor stocks led the market higher. Higher objectives remain, but the short-term is extended. If there is a quick rise in yields or investors and institutions decide it’s time to lock in profits for 2023. Be alert for a brief pullback, but currently, the tape remains positive, and the bulls remain in control.
Remember to manage your risk, and your wealth will grow.
Let’s talk investing. You are invited to set up your Free 30-minute Wealth and Well-Being Strategy session by clicking here or emailing me at Bonnie@BonnieGortler.com. I would love to schedule a call and connect with you.
Disclaimer: Although the information is made with a sincere effort for accuracy, it is not guaranteed that the information provided is a statement of fact. Nor can we guarantee the results of following any of the recommendations made herein. Readers are encouraged to meet with their own advisors to consider the suitability of investments for their own particular situations and for determination of their own risk levels. Past performance does not guarantee any future results.


Create more wealth in your life
with these simple strategies.
As an added bonus you will also
receive BG’s Updates and Ezine

Discover how to quickly create more well-being in your life with these simple strategies.
As an added bonus you will also
receive BG’s Updates and Ezine

As an added bonus you will receive BG’s Updates and Ezine

All work listed on BonnieGortler.com is licensed under a Creative Commons Attribution - Noncommercial - No Derivative Works 3.0 Unported License.


Free Report:
Grow and Sustain Your Wealth
Discover how to grow your money with these easy, simple steps.

