

10 Simple Tips for Financial Well-Being
07/01/2026
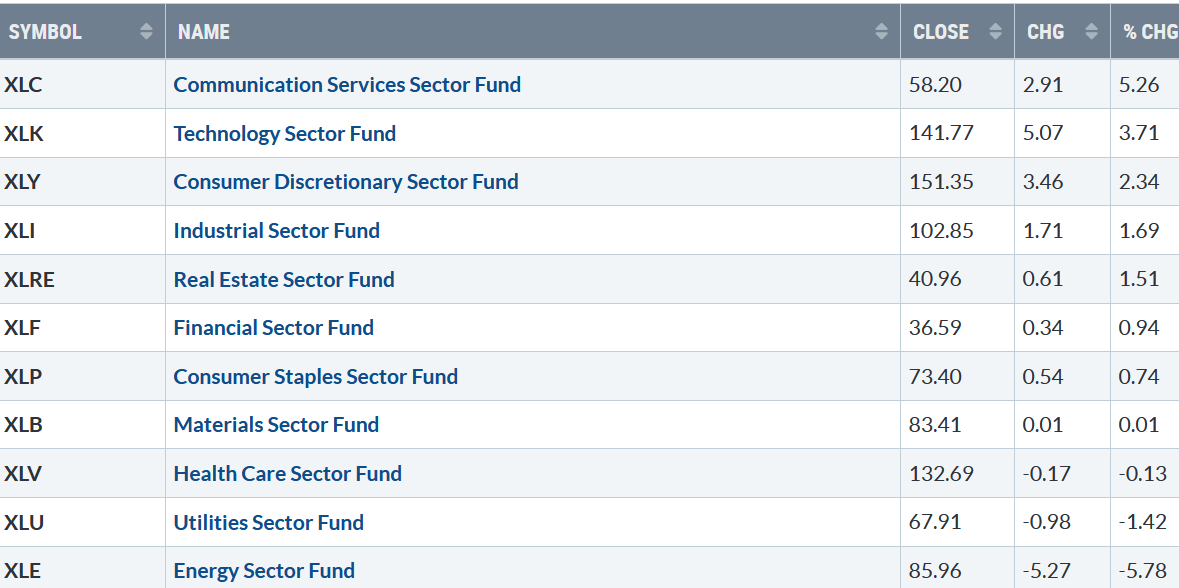
The 2023 advance continued, with eight of eleven S&P SPDR sectors being higher. Communication Services (XLC) and Technology (XLK) were the leading sectors, while Utilities (XLU) and Energy (XLE) were the weakest, with the SPDR S&P 500 ETF Trust (SPY) up +1.64%.
S&P SPDR Sector ETFs Performance Summary 1/27/23 – 2/03/23
020323 SPDR Sectors
Source: Stockcharts.com
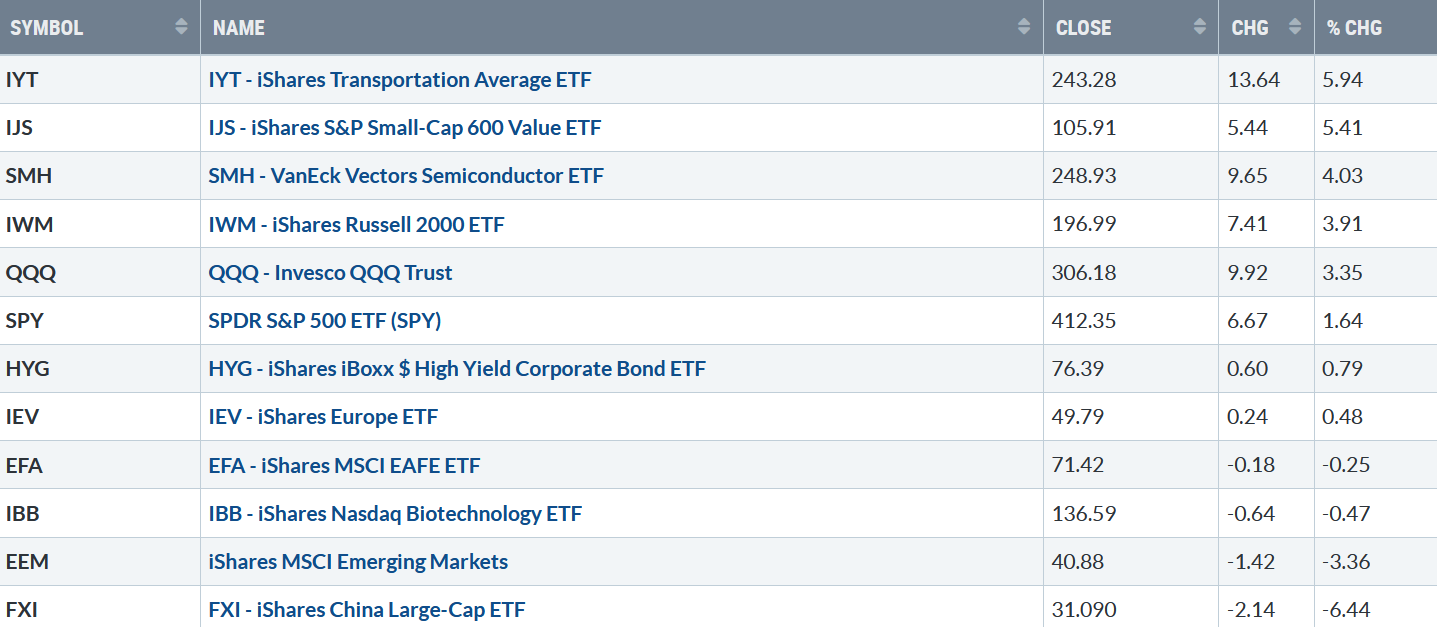
Figure 2: Bonnie’s ETFs Watch List Performance 1/27/23 – 2/03/23
020323 Week ETFs
Source: Stockcharts.com
Transportation, Small Cap Value and Growth, Semiconductors, and Technology outperformed the S&P 500 while internationals were weak, with Emerging Markets and China falling sharply,
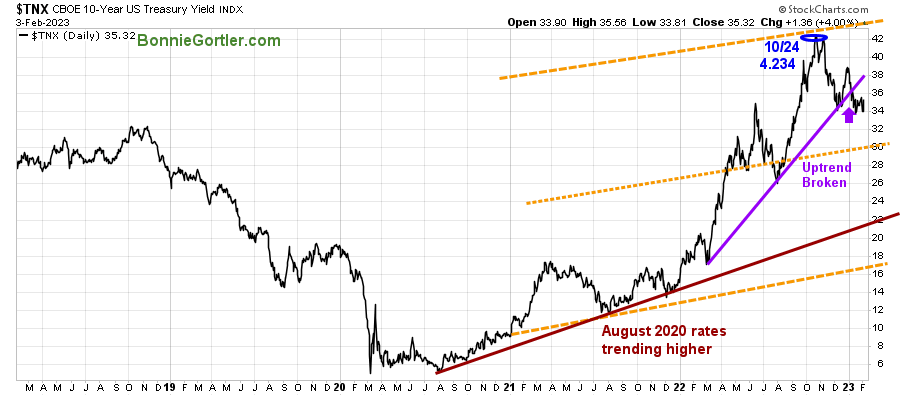
Figure 3: UST 10YR Bond Yields Daily
020323 UST 10 Yr Bond Yields Daily
Source: Stockcharts.com
The 10-Year U.S. Treasury yields rose last week, closing at 3.532%, but trending down after breaking below the uptrend (purple line). Support is at 3.00%, and resistance is at 3.80%.
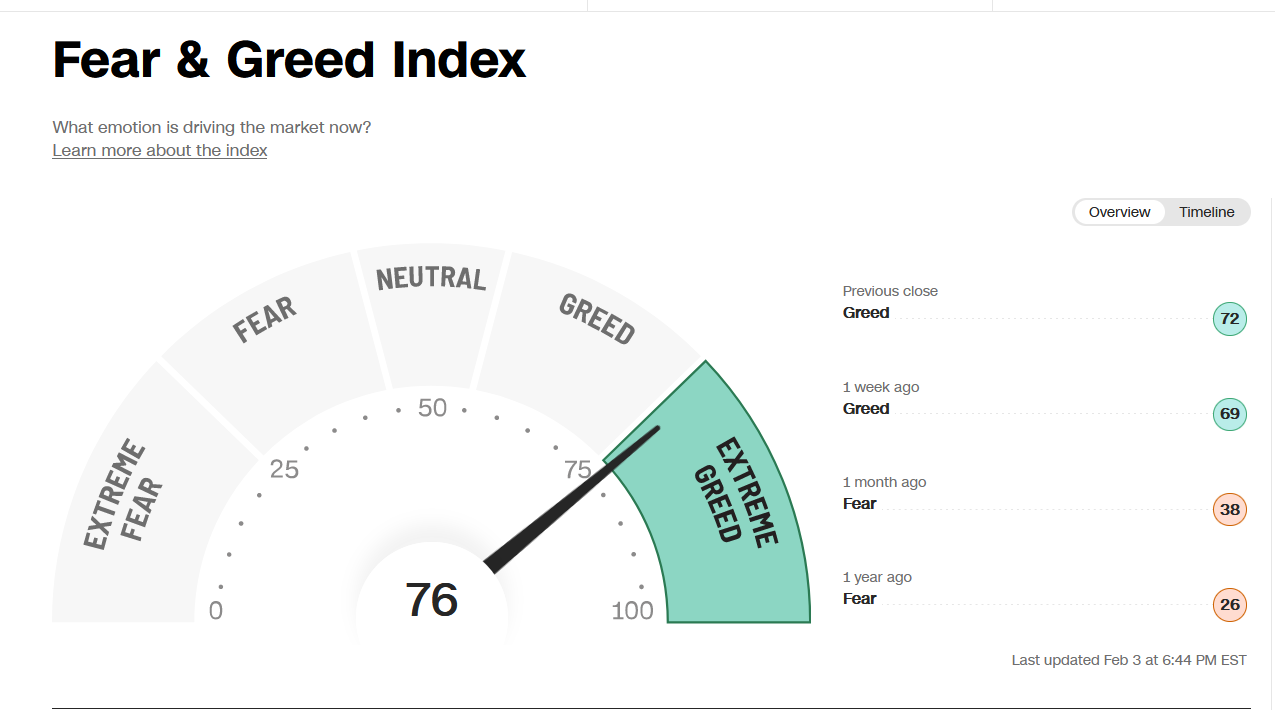
Figure 4: Fear and Greed Index
020323 Fear and Greed Index
Source: CNN
Investor sentiment based on the Fear and Greed Index (a contrarian Index) rose from 69 to 76 last week, showing extreme greed, implying an increased risk of a potential pullback or consolidation in the near term.
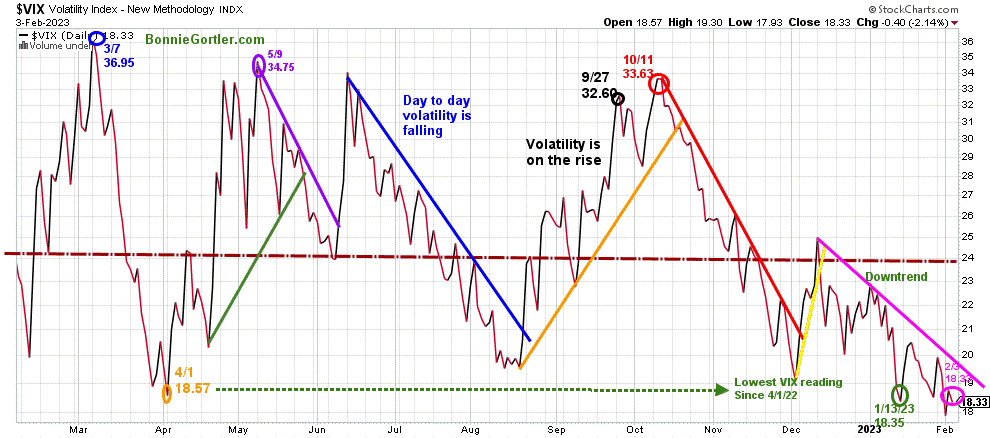
Figure 5: CBOE Volatility Index VIX
020323 VIX Daily
Source: Stockcharts.com
The CBOE Volatility Index (VIX), a measure of fear, traded above 20.00 for most of 2022. In late January 2022, VIX made a high at 36.95 on 3/7 (blue circle) and a low on 4/1/22 at 18.57. A new VIX low didn’t occur until 1/13/23 at 18.35 (green circle).
Last week, VIX closed lower at 18.33 (pink circle). No significant correction will likely begin if VIX remains in a downtrend (green line) and below 21.00.
The major averages for the week were mixed, Dow was down -0.15%, S&P 500 was up +1.62%, and the Nasdaq was up +3.31%. The Russell 2000 Index rose +3.88%, the strongest of the averages, and the Value Line Arithmetic Index (a mix of approximately 1700 stocks) gained +2.83%.
Weekly market breadth was positive on the New York Stock Exchange Index (NYSE) and for Nasdaq. The NYSE had 2244 advances and 1021 declines, with 356 new highs and 18 new lows. There were 3466 advances and 1655 declines on the Nasdaq, with 464 new highs and 106 new lows.
Its bullish Nasdaq and New York continue to have breadth figures showing more new highs than lows every day last week. Watch for New Highs’ expanding on the NYSE and Nasdaq for the rally to accelerate higher, or if they contract, implying the rally has run out of steam.
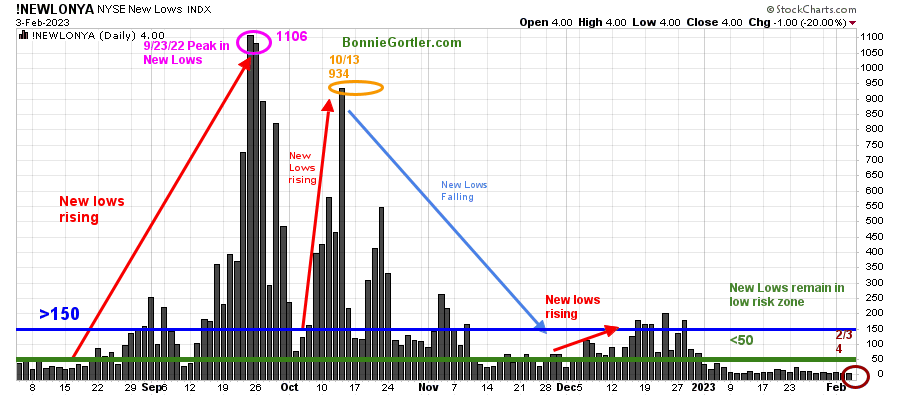
Figure 6: Daily New York Stock Exchange (NYSE) New Lows
020323 NYSE New Lows Daily
Source: Stockcharts.com
Watching New Lows on the New York Stock Exchange is a simple technical tool that helps awareness of the immediate trend’s direction.
New lows warned of a potential sharp pullback, high volatility, and “panic selling” for most of 2022, closing above 150. The peak reading was 9/23/22 when New Lows made a new high of 1106 (pink circle).
New Lows closed on 2/3 at 4 (brown circle), below 25, remaining in the lowest risk zone and short-term positive for the market. On the other hand, a rise above 150 and an expansion of New Lows would be a warning of weakness forthcoming.
Learn more about the significance of New Lows in my book, Journey to Wealth, published on Amazon. If you would like a preview, get a free chapter here.
NYSE breadth is confirming higher prices
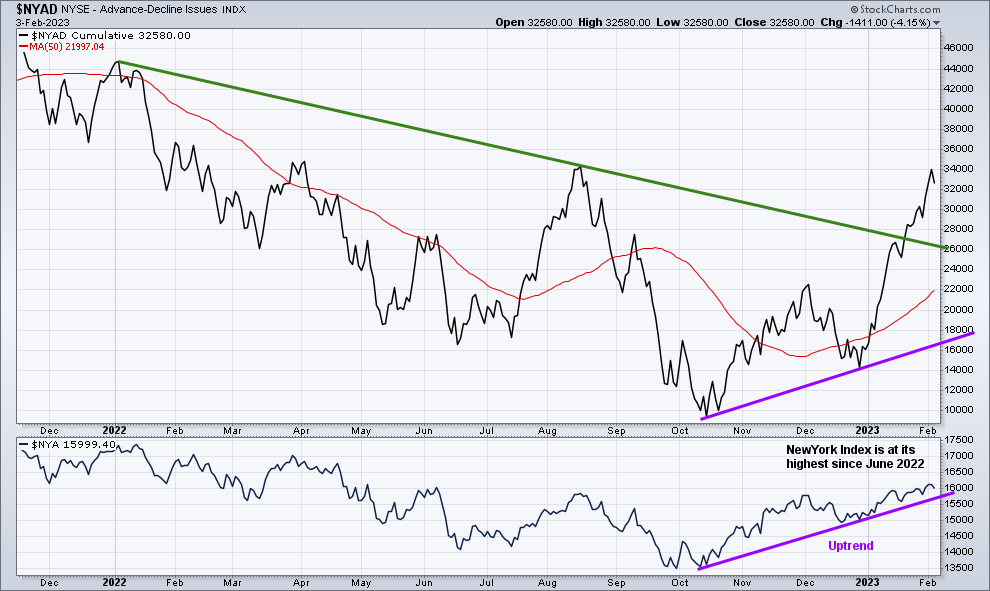
Figure 7: Daily New York Stock Exchange (NYSE) Cumulative Advance-Decline Line
020323 Daily NYSE Cumulative Advance-Decline Line
Source: Stockcharts.com
The above chart is the cumulative Advance-Decline Line (AD Line) of the NYSE, a breadth indicator based on the number of advancing stocks minus the number of declining stocks. It’s positive the 2022 downtrend has been broken, and the AD-Line made a higher high, confirming the NYSE’s high, which is now at its highest level since August 2022.
Breakout in Small Caps
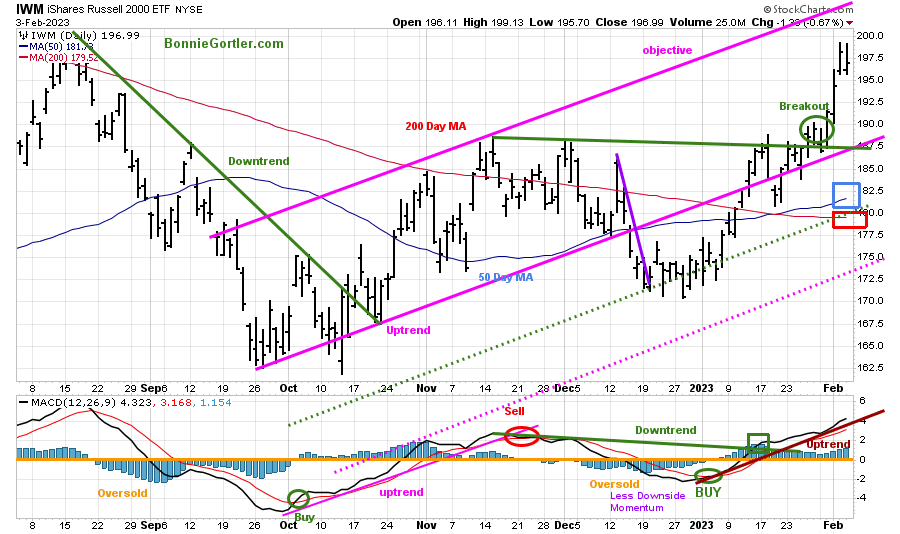
Figure 8: Daily iShares Russell 2000 (IWM) Price (Top) and 12-26-9 MACD Bottom)
020323 IWM Daily
Source: Stockcharts.com
The top chart is the daily iShares Russell 2000 Index ETF (IWM), the benchmark for small-cap stocks, with a 50-Day Moving Average (MA) (blue line) and 200-Day Moving Average (MA) (red line) that traders watch and use to define trends.
IWM closed at 196.99, up +3.91%, a clear breakout, above its 200-Day MA (red rectangle) and 50-Day MA (blue rectangle) and approaching the top of the channel (pink line), and penetrated and closed above resistance at 192.50, the August 2022 high.
MACD remains on a buy, above 0 (orange line), in an uptrend for 2023 and at its highest reading since September 2022, a sign of underlying strength.
Resistance is at 205.00 and 210.00, with support at 192.50 and 180.00.
With the recent strength in IWM, it is now stronger than the S&P 500 based on the relative strength ratio (chart now shown) for both the short and intermediate trends. If you would like the charts, email me at bonnie@bonniegortler.com
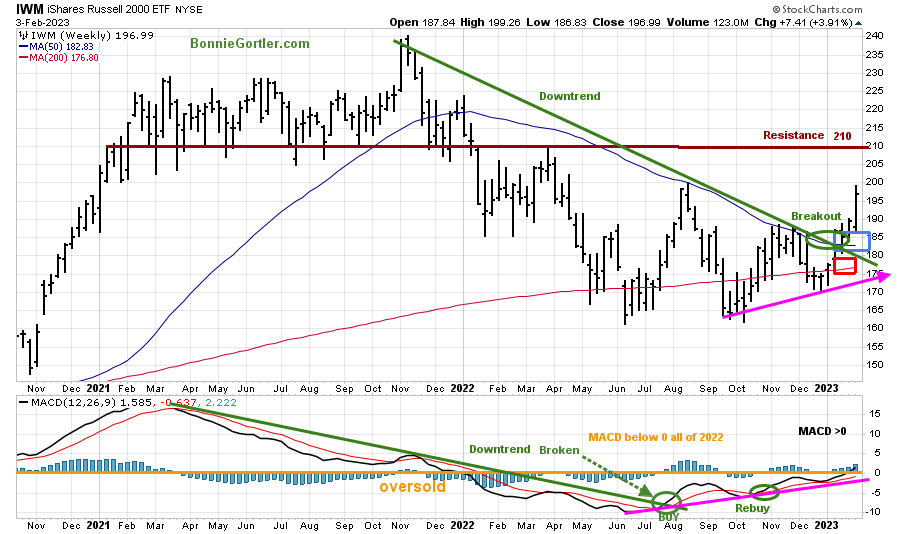
Figure 9: Weekly iShares Russell 2000 (IWM) Price (Top) and 12-26-9 MACD (Bottom)
020323 IWM Weekly
Source: Stockcharts.com
It’s bullish the weekly iShares Russell 2000 Index ETF (IWM) confirmed the daily breakout breaking the weekly downtrend from October 2022 and closing above its 50 and 200 Week Moving Averages. MACD, a measure of momentum, remains on a buy, now above 0 for the first time since 2022, implying underlying strength.
Figure 10: Daily Invesco QQQ Trust (QQQ) Price (Top) and 12-26-9 MACD (Bottom)

020323 QQQ Daily
Source: Stockcharts.com
The chart shows the daily Invesco QQQ, an exchange-traded fund based on the Nasdaq 100 Index. QQQ moved lower after a false break out (purple circle) in September of the August downtrend (green line) but had a few rally attempts after but stalled and made a low in October 2022 (red circle). A successful retest occurred in early January 2023.
Nasdaq tape action has improved considerably in 2023 after breaking the downtrend (purple line) and hitting a new six-month high. QQQ rose +3.35% last week after +4.80% the previous week, clearly outperforming the S&P 500, closing at 306.18. QQQ closed well above the 50-Day Moving Average and the 200-Day Moving Average (red rectangle) after breaking the August downtrend (purple line) and above resistance at 287.00.
QQQ support is at 303.00, 291.00, 287.00, and 280.00, and resistance is at 314.00 and 322.00. The upside objective is 331.00.
The bottom chart is MACD (12, 26, 9) remains on a buy, rising, above 0, with positive momentum, its highest reading since last August.
Learn about coaching with Bonnie. Ask questions. Discover more about the coaching processes in this 15-minute call by emailing me at Bonnie@BonnieGortler.com. I would love to schedule a call and connect with you.
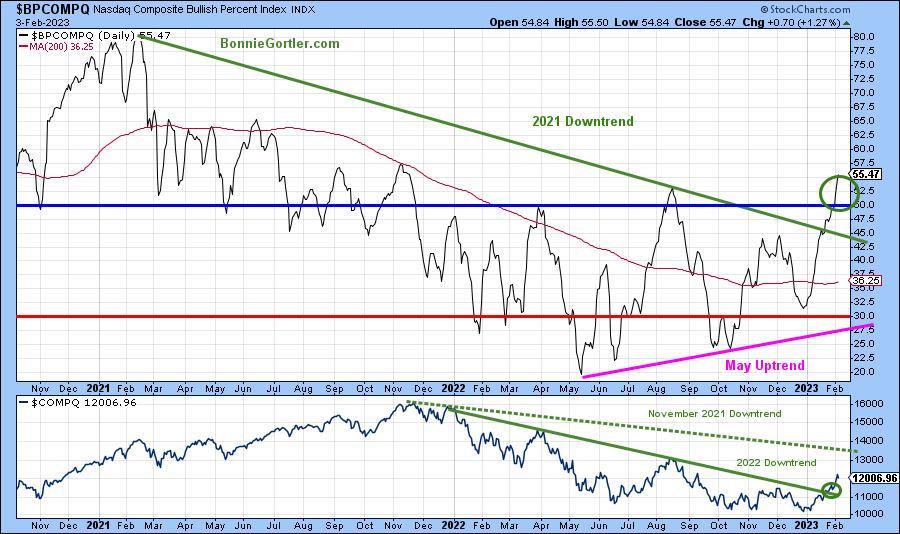
Figure 11: Nasdaq Composite Index Bullish Percent Index (Top) and Nasdaq Composite Index (Bottom)
020323 Nasdaq Bullish Percentage Daily
Source: Stockcharts.com
The Nasdaq Composite Index is a market capitalization-weighted index of more than 3,700 stocks listed on the Nasdaq Stock Exchange.
The Nasdaq index technical indicators continue to improve. The Bullish Percentage indicator (BPI) is a breadth indicator. BPI has had higher lows since May 2022 and has formed an uptrend (pink line). The 2021 downtrend in the BPI broke the previous week, and last week BPI rose, closing at 55.47, giving a buy signal.
The bottom chart is the Nasdaq Composite, with two downtrends (green dotted and solid green line). The Nasdaq Composite shifted to an uptrend the previous week after breaking the 2022 downtrend (solid green line).
Time will tell if Nasdaq has enough strength to surpass the November 2021 (green dotted line) downtrend.
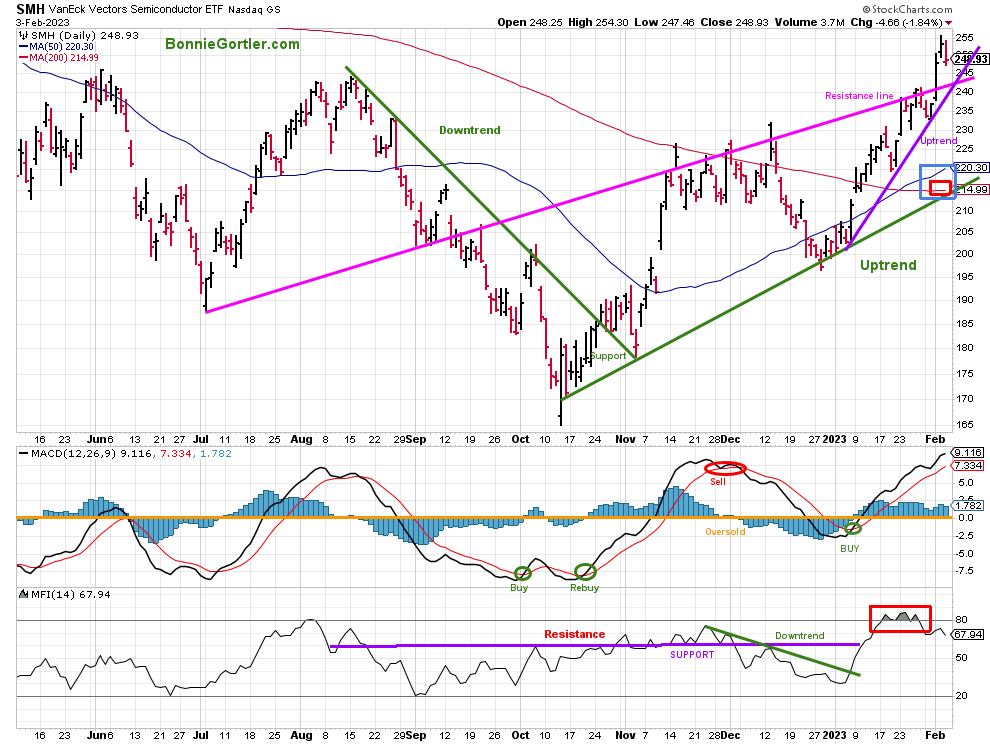
Figure 12: Van Eck Vectors Semiconductor (SMH) Top, 12-26-9 MACD (Middle) and Money Flow (Bottom)
020323 SMH Daily
Source: Stockcharts.com
The top part of the chart shows the Van Eck Vectors Semiconductor (SMH) concentrated, mainly in US-based Mega-Cap Semiconductors companies. SMH is a lead indicator for the market when investors are willing to take on increased risk and the opposite when the market is falling.
Semiconductors (SMH) continued to rise, closing at 248.03, up +4.03% last week and up 22.66% in 2023. SMH has remained in its uptrend since October and remains above its 50 and 200 Day Moving averages (blue and red rectangle) and 50-week and 200-week moving Averages (chart not shown).
SMH hit the resistance line (pink) the previous week, where I thought a consolidation might begin. However, the underlying strength in SMH prevailed, and it held support at 230.00 with a low of 232.19 and powered ahead. Support is at 240.00 and 235.00, which would break the 2023 uptrend and likely cause selling to accelerate to 230.00, followed by 214.00. Resistance is at 260.00.
MACD (middle chart) remains on a buy, rising, showing positive momentum. However, Money Flow (bottom chart) appears to have peaked (red rectangle) and turned down from an overbought level, implying caution in the near term.
S&P 500 Trend daily trend is up after breaking the 2022 downtrend
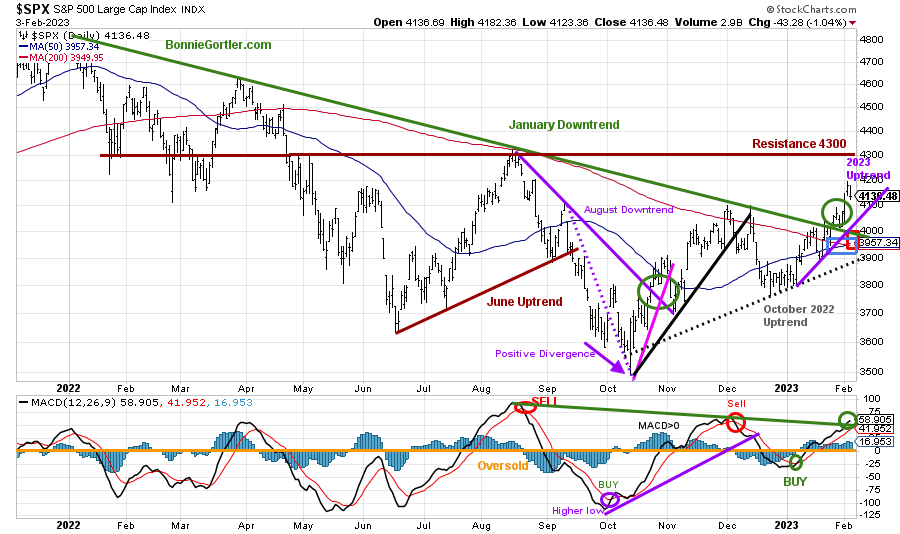
Figure 13: The S&P 500 Index ($SPX) Daily (Top) and 12-26-9 MACD (Bottom)
020323 SPX Daily
Source: Stockcharts.com
The S&P 500 (SPX) failed to get through resistance at 4100 in December 2022 and reversed lower, breaking the October uptrend (black line).
The S&P 500 broke the 2022 downtrend (green line/circle) the previous week, shifting the daily trend to up.
The S&P 500 made a six-month high, gaining +1.62%, closing at 4136.48, above its 50-and 200-Day Moving Average (blue and red rectangle), showing underlying strength.
MACD (lower chart) remains on a buy (green circle) from below 0, is rising, and broke its downtrend, implying the worst downside momentum is complete.
Resistance remains at 4300, while support is at 4000, 3900, and 3800. As long as the 2023 uptrend remains in effect (purple line), the SPX will likely work its way higher toward 4300 for the short term.
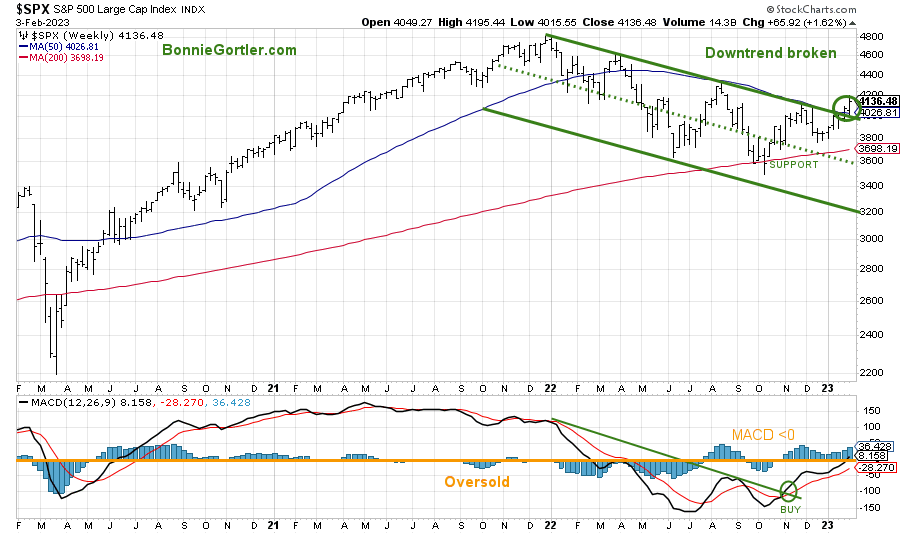
Figure 14: The S&P 500 Index ($SPX) Weekly (Top) and 12-26-9 MACD (Bottom)
020323 SPX Weekly
Source: Stockcharts.com
The top chart shows the weekly S&P 500 Index ($SPX) breaking the weekly downtrend (green line) and shifting the intermediate trend to up.
MACD (lower chart) remains on a buy (green circle), broke the 2022 downtrend in November 2021, and continues to rise, reaching 0, implying a sign of strength.
S&P 500 has broken out to the upside, with an upside target of 4400 and potentially higher, with support at 4000.
Learn more about charting in my free Masterclass, Charting Strategies to Cut Risk and Trade with the Trend. Sign up here.
U.S. Dollar breaks the November 2022 downtrend
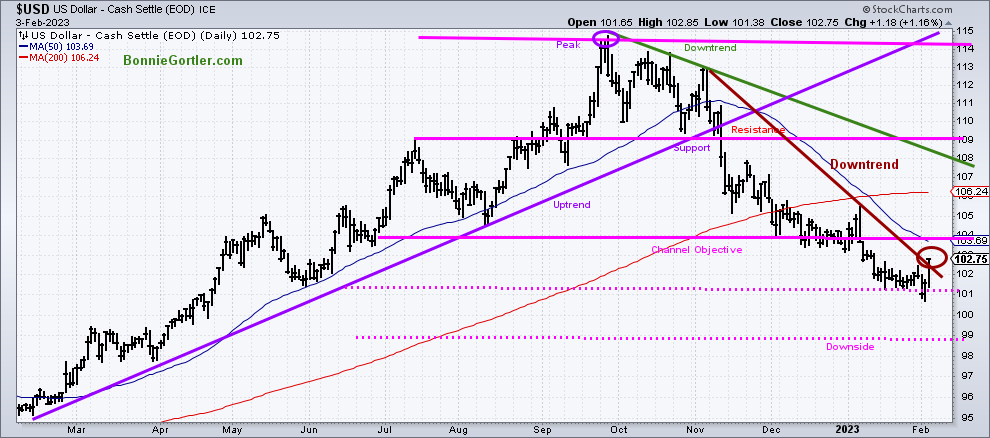
Figure 15: U.S. Dollar Daily
020323 DXY Daily
Source: Stockcharts.com
The U.S. dollar peaked in September 2022 and trended lower into 2023.
The dollar closed up 1.02% for the week, and on Friday, 02/3/23, the dollar closed near its high for the day and highest close in two weeks, breaking the November daily downtrend (brown line) but well below the September 2022 downtrend (green line).
On Friday, 2/3/23, the U.S. dollar’s strength added to the selling of international and U.S. markets. Vanguard FTSE All-World ex-US ETF (VEU) fell -1.17%, Emerging Markets (EEM) fell -1.78%, and China was lower by -2.45%. The dollar strength also put pressure on Gold and Silver, selling off sharply.
The downside objective remains at 98.80 (pink dotted line), but a close above 104.00 would negate the downside objective.
If the dollar rises, look for a pullback in international markets, which have been in a steady uptrend.
On the other hand, if the rise in the dollar was a fake to the upside and is temporary, then global equities will likely work their way higher.
Follow up on XOP
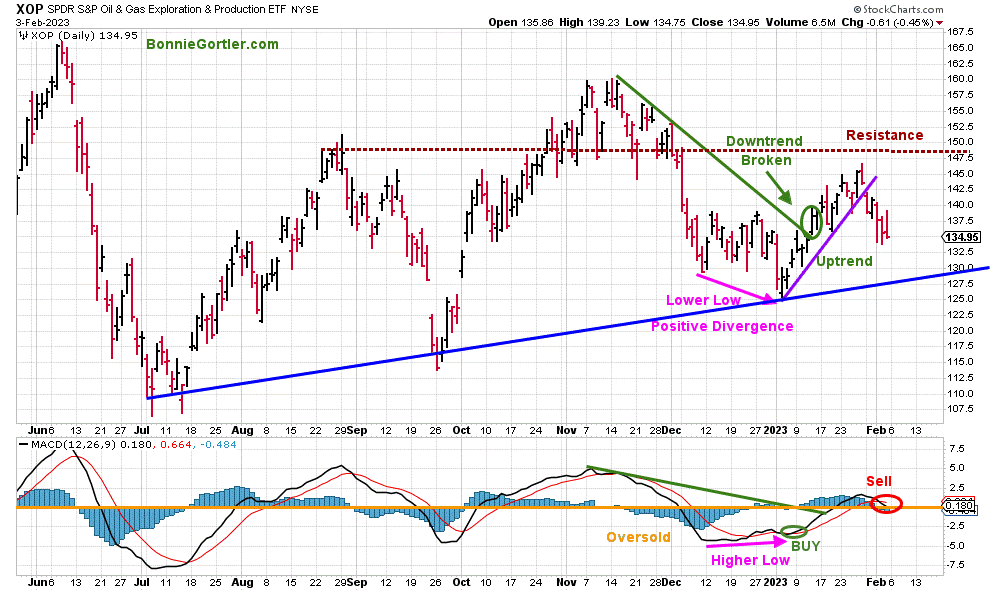
Figure 16: SPDR Oil and Gas Exploration (XOP) and 12-26-9 MACD (Bottom)
020323 XOP Daily
Source: Stockcharts.com
The XOP ETF provides exposure to US companies in oil and gas exploration & production space and rebalances quarterly.
XOP failed at resistance and reversed lower, the selling accelerated in XOP after breaking the 2023 uptrend (purple line) and a MACD sell (lower chart). Therefore the SPDR Oil and Gas Exploration (XOP) was stopped out (per the market update on 1/27/23) after closing below 140.00 on 2/1/23.
With the 2022 uptrend in effect (blue line), I would not be surprised by another rally attempt soon if the Energy sector stabilizes and money shifts out of Technology.
Summing Up:
The S&P 500 and Nasdaq rose to their highest level in six months, adding to their gains in 2023. Nasdaq had its 5th positive week in a row as investors continued to take advantage of technology stocks at bargain prices. Profit-taking on Friday started after news of continued strength in employment, implying possible higher interest rates for longer than expected. Market sentiment in the short run is concerning but the short and intermediate uptrends remain intact. Market breadth remains favorable, with the Russell 2000 leading in relative strength compared to the S&P 500 for the short and intermediate trend. Any pullbacks are likely short-lived and will provide buying opportunities over the next several weeks to months in 2023.
Remember to manage your risk, and your wealth will grow.
Let’s talk investing. You are invited to set up your Free 30-minute Wealth and Well-Being Strategy session by clicking here or emailing me at Bonnie@BonnieGortler.com. I would love to schedule a call and connect with you.
Disclaimer: Although the information is made with a sincere effort for accuracy, it is not guaranteed that the information provided is a statement of fact. Nor can we guarantee the results of following any of the recommendations made herein. Readers are encouraged to meet with their own advisors to consider the suitability of investments for their own particular situations and for determination of their own risk levels. Past performance does not guarantee any future results.


Create more wealth in your life
with these simple strategies.
As an added bonus you will also
receive BG’s Updates and Ezine

Discover how to quickly create more well-being in your life with these simple strategies.
As an added bonus you will also
receive BG’s Updates and Ezine

As an added bonus you will receive BG’s Updates and Ezine

All work listed on BonnieGortler.com is licensed under a Creative Commons Attribution - Noncommercial - No Derivative Works 3.0 Unported License.


Free Report:
Grow and Sustain Your Wealth
Discover how to grow your money with these easy, simple steps.

