

10 Simple Tips for Financial Well-Being
07/01/2026
Selling pressure intensified last week after news of the sudden collapse of SVB Financial Group, with all eleven S&P SPDR sectors negative. Defensive sectors Consumer Staples (XLP) and Utilities (XLU) fell the least, while Materials (XLB and Financials (XLF) were the weakest, with the SPDR S&P 500 ETF Trust (SPY) down -4.52%.
S&P SPDR Sector ETFs Performance Summary 3/03/23-03/10/23
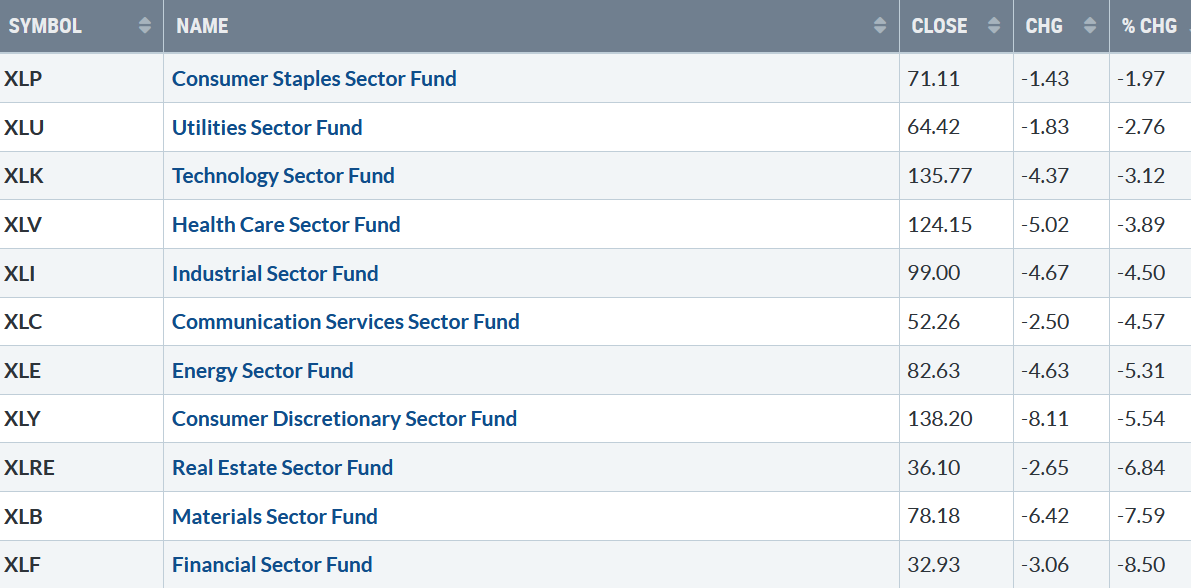
031023 SPDR Sectors
Source: Stockcharts.com
Figure 2: Bonnie’s ETFs Watch List Performance 3/03/23-03/10/23
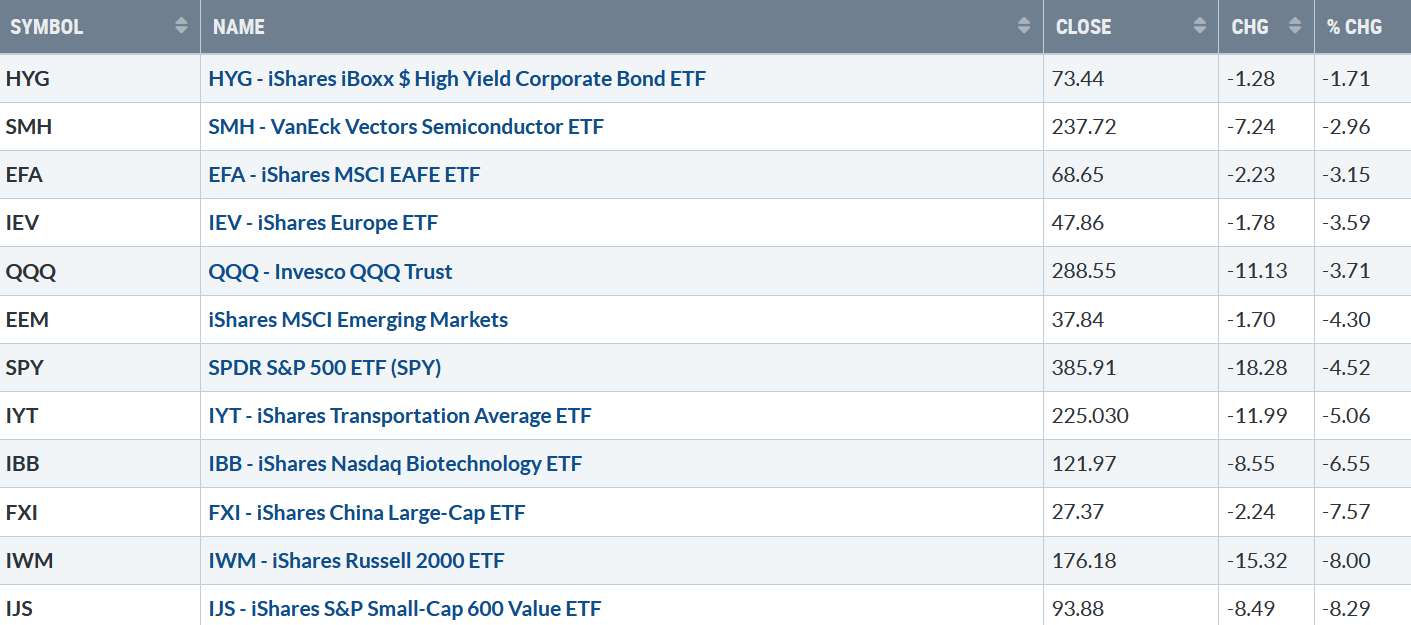
031023 Week ETFs
Source: Stockcharts.com
Last week a broad downside reversal in the international and U.S. markets. Small Cap Growth, and Value, which hold significant bank investments, were down more than twice the S&P 500 (SPY).
Figure 3: CBOE Volatility Index VIX
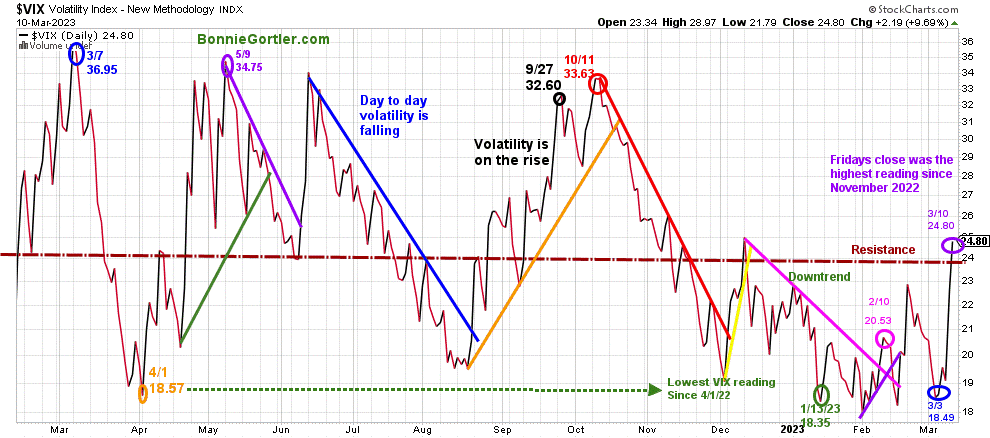
031023 VIX Daily
Source: Stockcharts.com
The CBOE Volatility Index (VIX), a measure of fear, traded above 20.00 for most of 2022, with a high at 36.95 on 3/7 (blue circle) and a low on 4/1/22 at 18.57. A new VIX low didn’t occur until 1/13/23 at 18.35 (green circle) after VIX quieted in early December 2022.
Last week, a broad decline, with VIX rising sharply to the highest reading since November 2022, closing at 24.80 (purple circle). Daily intraday swings are likely to remain high as long as VIX remains above 20.00 and could rise to between 40 and 60 quickly if selling accelerates.
Figure 4: Fear & Greed Index
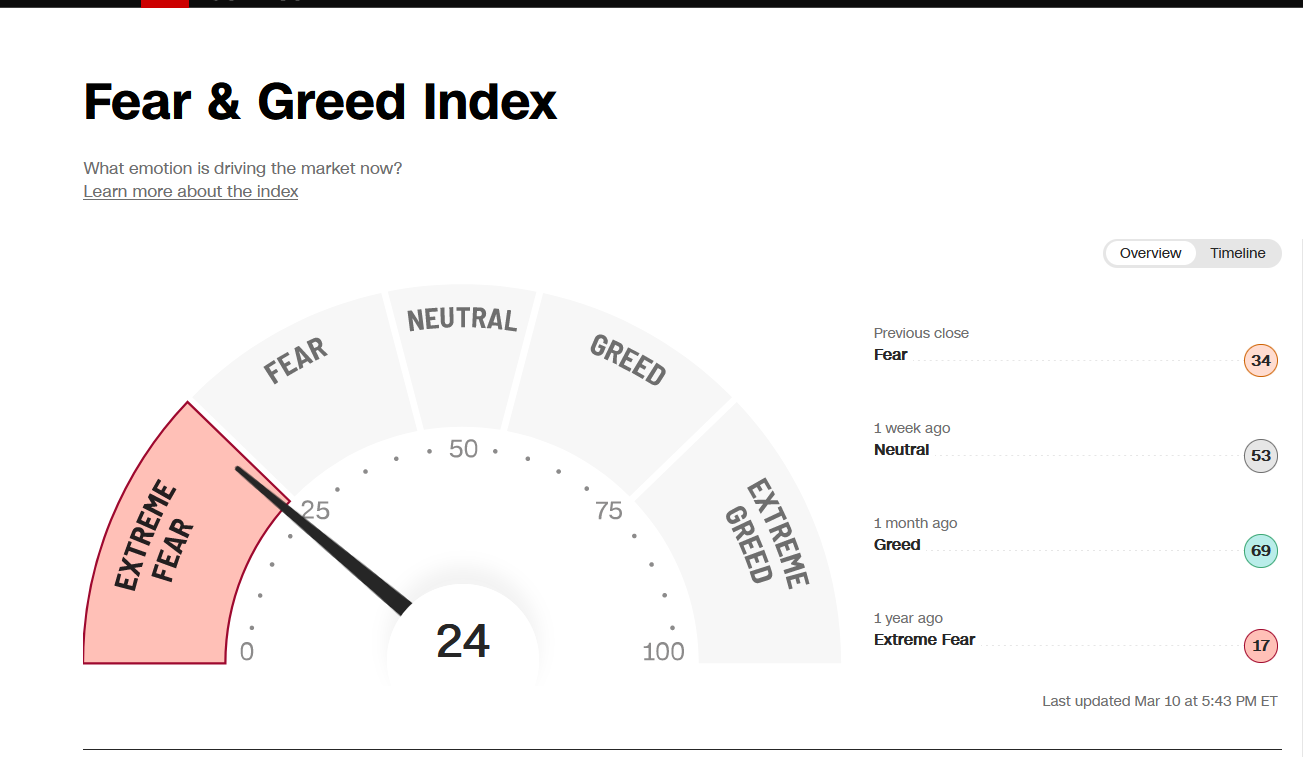
031023 Fear and Greed Index
Source: CNN
Investor sentiment based on the Fear and Greed Index (a contrarian index) fell from Neutral at 53 to 24 Extreme Fear in one week on the news of SVB Financial Group (SVB), the second-biggest bank collapse in U.S. history.
Figure 5: UST 10YR Bond Yields Daily
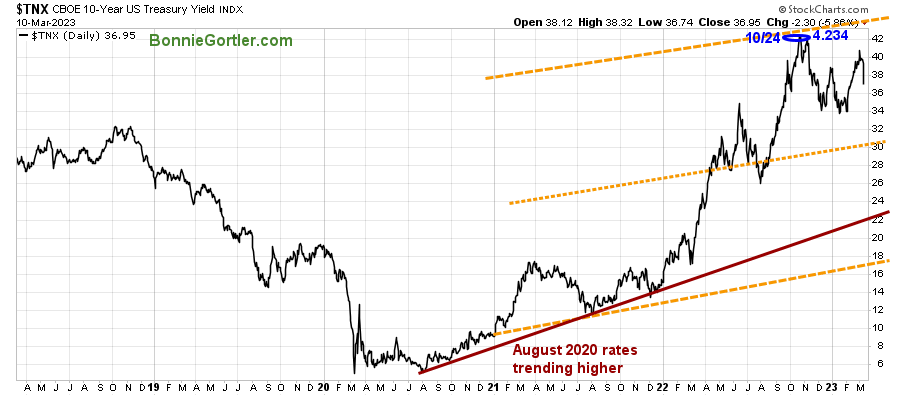
031023 UST 10 Yr Bond Yields Daily
Source: Stockcharts.com
The 10-Year U.S. Treasury yields fell sharply last week, closing Friday at 3.695%, pulling back from its high of 4.091% made on 3/2 as investors bought bonds for safety. Support is 3.00%, and resistance remains at 4.25 and 4.40%.
The major averages for the week were all lower. The Dow fell -4.44%, the S&P 500 was down -4.55% and the Nasdaq -4.71%. The Russell 2000 Index fell sharply, down -8.07%.
Figure 6: Value Line Arithmetic Average
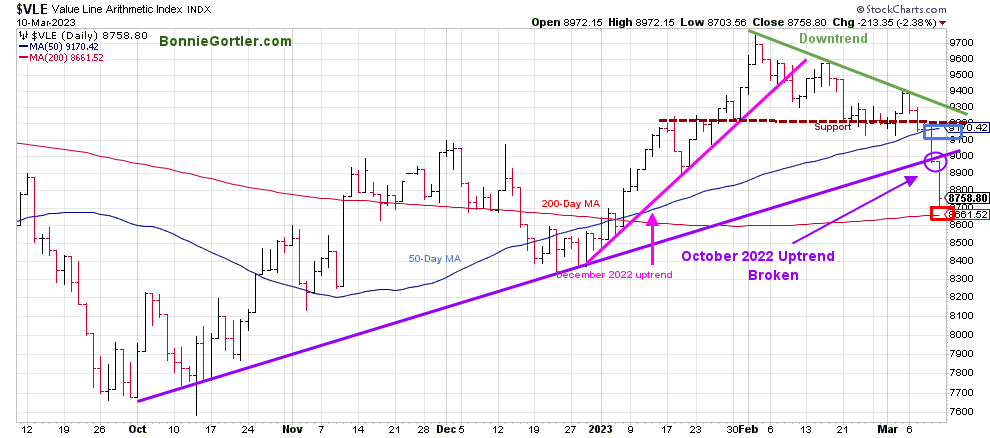
Source: Stockcharts.com
The Value Line Arithmetic Index ($VLE) (a mix of approximately 1700 stocks) fell dramatically, -6.68%, breaking the October uptrend (purple circle), support at 9200, and closing below the 50-Day MA, implying underlying weakness.
Support lies at the 200-Day Moving Average, 8661.52, as of 3/10. Resistance is at 9000 and 9200. The decline will likely continue in the short term if there is no resolution to minimize damages from the SVB Financial Group.
Market internals Weaken
Figure 7: Nasdaq Advance Decline Line Daily (Top) Nasdaq (Bottom)
031023 QQQ Daily
Source: Stockcharts.com
The top chart is the Nasdaq Daily Advance-Decline Line, a technical indicator that plots the difference between the number of advancing and declining stocks daily. In February 2023, the short-term uptrend (purple line) gave way.
In January, the October 2022 downtrend was broken (green line), breadth was improving, and the Nasdaq rallied. However, after turning up the previous week, the AD-Line reversed sharply lower last week, showing a deterioration in market breadth.
Nasdaq (the bottom chart) is in a downtrend (pink line), falling under the march low last week. Risk remains high of more weakness until the Nasdaq breaks the downtrend (pink line).
Watch the market breadth in the short term if there are more advances than declines this week which would be positive, or if there are more declines than advances which would be considered negative in the short term.
New Lows are on the rise for Nasdaq and New York Stock Exchange.
Weekly market breadth was horrendous last week on the New York Stock Exchange Index (NYSE) and for Nasdaq. The NYSE had 389 advances and 2871 declines, with 27 new highs and 177 new lows. There were 1043 advances and 4035 declines on the Nasdaq, with 244 new highs and 653 new lows.
On a side note, volume patterns I track that improved the previous week usually imply that a bottom has formed, turned down, making a new low, which is not what I expected, indicating more time is needed for a safer bottom formation to develop.
Figure 8: Nasdaq New Lows
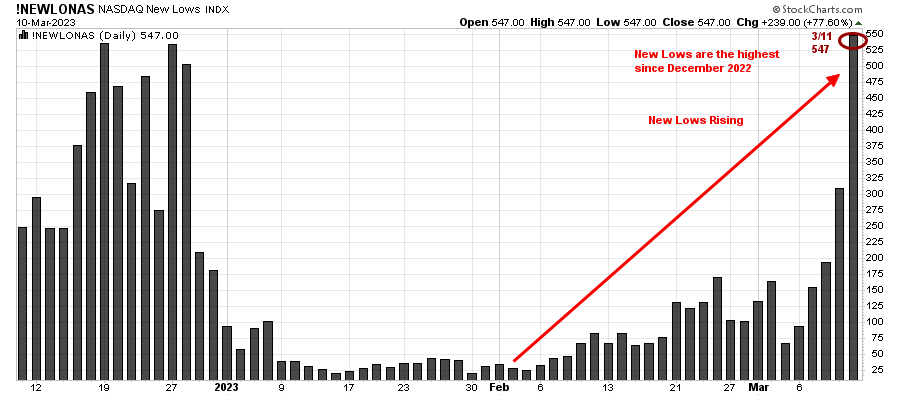
031023 Nasdaq New Lows Daily
As the Nasdaq Index fell, Nasdaq New Lows rose to the highest level since December 2022, which is worrisome.
Learn more about charting in my Free Masterclass, Charting Strategies to Cut Risk and Trade with the Trend. Sign up here
Figure 9: Daily New York Stock Exchange (NYSE) New Lows
031023 NYSE New Lows Daily
Source: Stockcharts.com
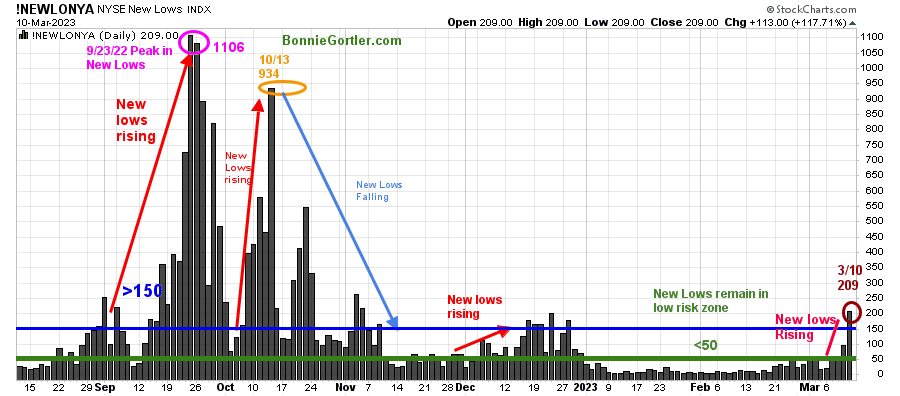
Watching New Lows on the New York Stock Exchange is a simple technical tool that helps awareness of the immediate trend’s direction.
New lows warned of a potential sharp pullback, high volatility, and “panic selling” for most of 2022, closing above 150. The peak reading was 9/23/22 when New Lows made a new high of 1106 (pink circle).
New Lows expanded rapidly to their highest level on Friday since November 2022. New Lows are no longer in a low-risk zone closing at 209 on 3/10 (brown circle), in the high-risk zone, above 150 (blue horizontal line), implying an increased risk of possible further selling pressure.
Here is an excerpt when new lows are above 150, the market is negative, higher risk, and selling is taking place. Sometimes it could be severe, and sometimes on a very nasty day, you can have “panic selling,” and big wild swings (high volatility) to the downside may occur.
Learn more about the significance of New Lows in my book, Journey to Wealth, published on Amazon. If you would like a preview, get a free chapter here.
Caution is recommended until New Lows falls below 150 and then contracting below 50.
Small Caps break down.
Figure 10: Daily iShares Russell 2000 (IWM) Price (Top) and 12-26-9 MACD (Middle) and Money Flow (Bottom)
031023 IWM Daily
Source: Stockcharts.com
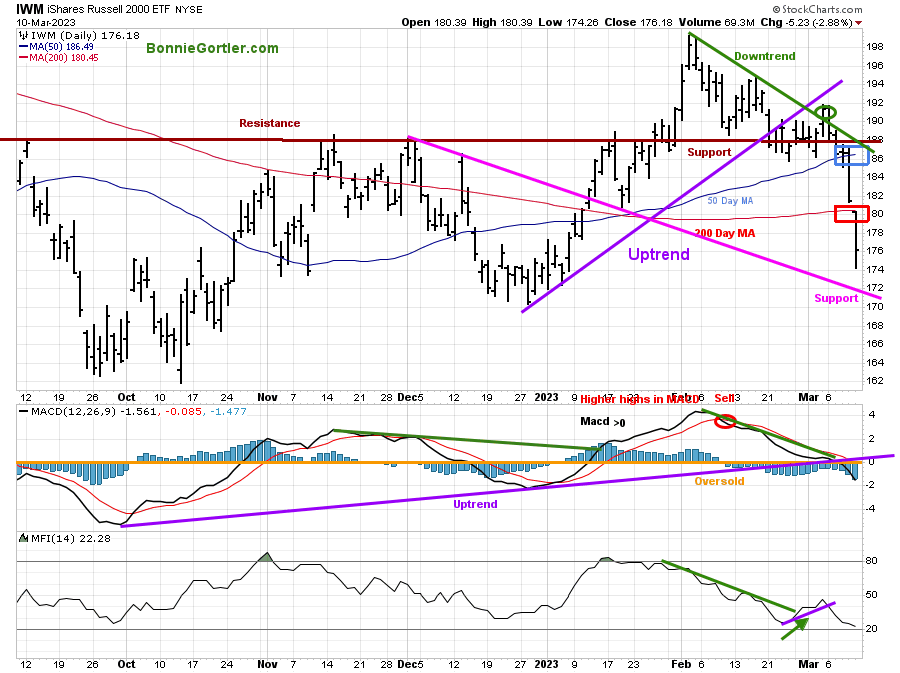
The top chart is the daily iShares Russell 2000 Index ETF (IWM), the benchmark for small-cap stocks, with a 50-Day Moving Average (MA) (blue line) and 200-Day Moving Average (MA) (red line) that traders watch and use to define trends.
An ugly week for small caps, IWM reversed to the downside, falling below support at 188.00, 184.00, and 180.00, closing at 176.18, down -8.00%, below 50-Day MA (blue rectangle) and 200-Day MA (red rectangle). There was no love for small caps last week, with their highest sector exposure of 23.85% (source ETF.com) in Financial stocks, especially Regional Banks.
MACD remains on a sell momentum, accelerating lower after breaking the uptrend from October (purple line).
The Money Flow Index (MFI) in the lower chart was favorable but turned down quickly early last week, breaking its up trend (green line), falling, and oversold.
Support is at 172.00 and 166.00. Resistance is at 180.00 and 186.00, and 188.00.
Figure 11: Weekly iShares Russell 2000 (IWM) Price (Top) and 12-26-9 MACD (Bottom)
031023 IWM Weekly
Source: Stockcharts.com
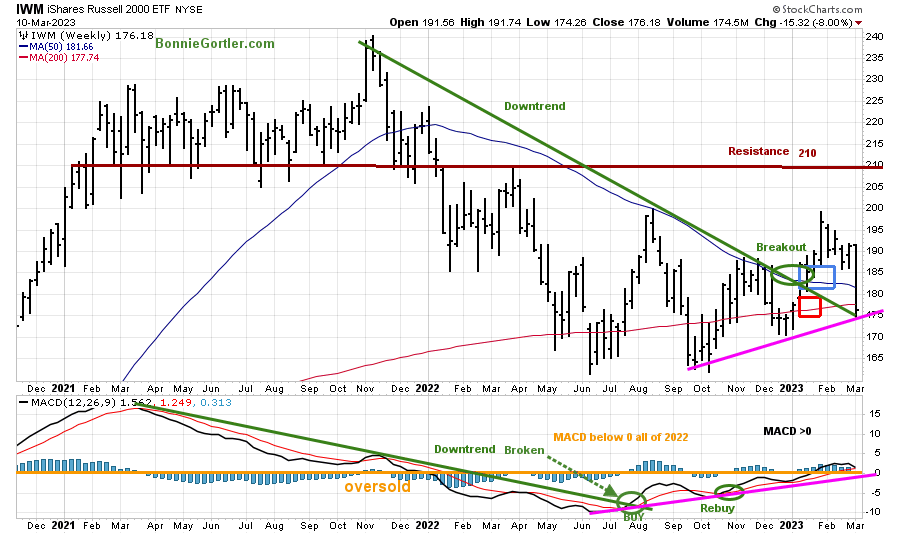
The IWM fell to its lowest level in nearly two months, jeopardizing the intermediate trend after heavy selling. IWM closed near its low for the week and below the 50 and 200-MA, barely holding above the October uptrend. IWM is now up only +1.03% in 2023.
MACD, (a measure of momentum) barely remains on a buy, above 0, and is falling. A MACD sell will be given if the IWM continues to fall, ultimately breaking the weekly uptrend from June 2022 (pink line).
If there is a short-term resolution over the collapse of the SVB Financial Group, IWM is likely to bounce as investors go bargain hunting. But, on the other hand, if there is no resolution, small-caps will likely accelerate lower, testing the October lows.
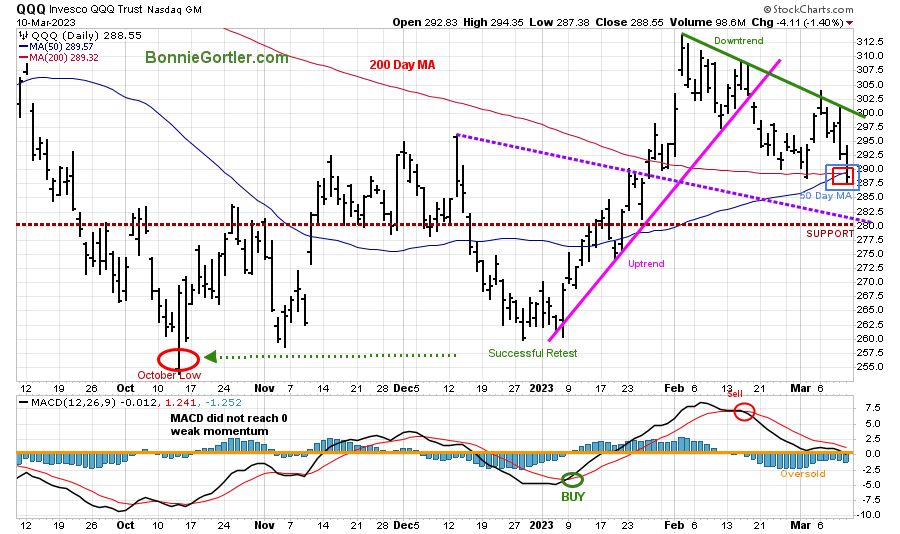
Figure 12: Daily Invesco QQQ Trust (QQQ) Price (Top) and 12-26-9 MACD (Bottom)

031023 QQQ Daily
Source: Stockcharts.com
The chart shows the daily Invesco QQQ, an exchange-traded fund based on the Nasdaq 100 Index. QQQ made a low in October 2022 (red circle), followed by a successful retest of the low in early January 2023, then broke the uptrend (pink line) after reaching a new six-month high in February.
QQQ fell -3.7% last week, closing near its low on Friday at 288.55 below the 50-Day Moving Average and the 200-Day Moving Average (red rectangle).
The bottom chart is MACD (12, 26, 9), remains on a sell, and has worked off its overbought condition.
Support remains at 287, with the following critical support at 280.00. Resistance is 295.00, 303.00, 310.00, and 314.00.
The 280.00 support level is likely an area where sell stops are and an important area to hold.
Learn about coaching with Bonnie. Ask questions. Discover more about the coaching processes in this 15-minute call by emailing me at Bonnie@BonnieGortler.com. I would love to schedule a call and connect with you.
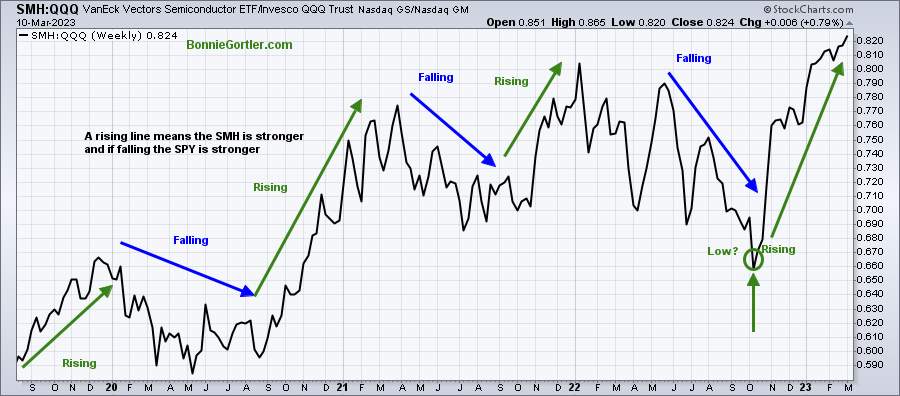
SMH remains stronger than QQQ based on relative strength for the intermediate trend.
Figure 13: Semiconductors (SMH)/Invesco QQQ Trust/ Ratio (SMH/QQQ) Weekly
031123 SMH QQQ Weekly Relative Strength Ratio
Source: Stockcharts.com
The top part of the chart is the weekly Semiconductors (SMH) Invesco QQQ Trust Relative Strength Index Ratio (SMH/QQQ). A rising line means the SMH is stronger; if falling, the QQQ is stronger.
It’s encouraging SMH made a new relative strength high last week. The SMH will often be a clue before a significant correction starts because it will lag and fall faster than the QQQ leading the broad market lower. During the recent pullback, SMH has fallen but is up 17.14% in 2023, more than double the QQQ gains of 8.36%
Keep an eye out next week if SMH continues to outperform the QQQ, which is positive, or on the other hand, if SMH underperforms the QQQ, which would be considered short-term negative.
Figure 14: The S&P 500 Index (SPY) Daily (Top) and 12-26-9 MACD (Bottom)
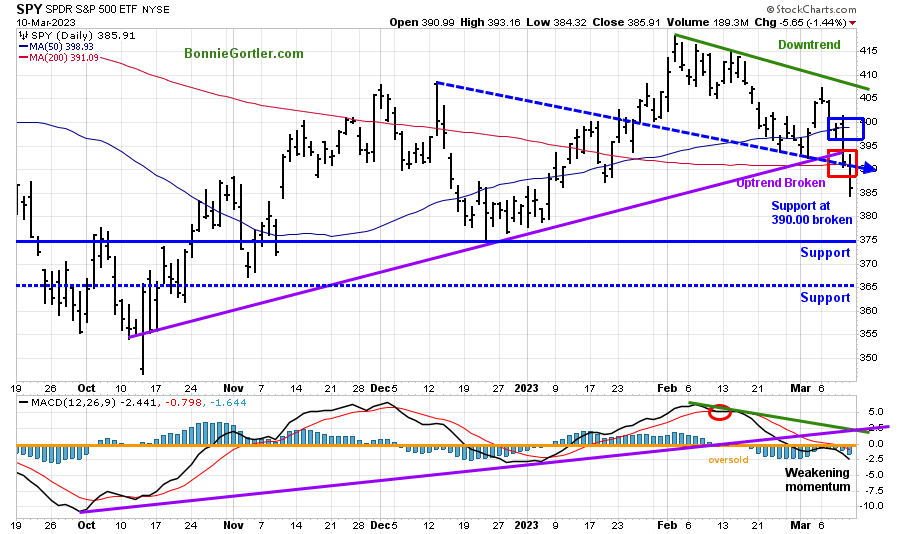
031023 SPY Daily
Source: Stockcharts.com
The S&P 500 (SPY) made a six-month high in early February 2023 and turned down. SPY had heavy selling pressure last week, breaking the October 2022 uptrend, and now up only +0.91% in 2023
SPY reversed sharply lower last week, down -4.52%, closing below the 50-Day Moving Average (blue rectangle) and the 200-Day Moving Average (red rectangle), closing near its lows on Friday. After an apparent short-term cycle bottom occurred, its short-term negative low was taken out in the SPY.
MACD (lower chart) is on a sell, weakening momentum, and broke the October uptrend. It would be positive for momentum to rise quickly, give a new buy and break the downtrend from February (green line).
Support at 390 was broken and is now resistance, followed by 400.00 and 410.00.
The SPY appears headed toward a test of its December low, with the next support being 375.00 and 365.00 (blue dotted lines).
Financials reverse sharply lower after a false breakout.
Figure 15: The Financial Select Sector SPDR (XLF) Daily (Top) and 12-26-9 MACD (Bottom)
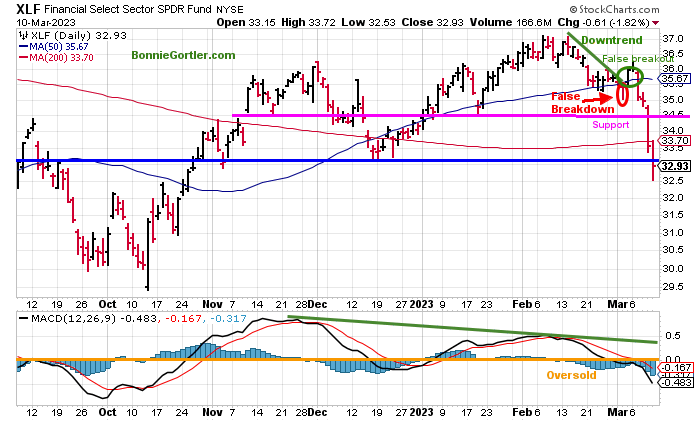
031023 XLF Daily
Source: Stockcharts.com
Financials reversed sharply after a false breakout, down -8.50%, the weakest SPDR sector for the week, breaking 34.50 support and closing near their low on Friday. Regional Banks (KRE) were down even more, -16.05%.
Support is 31.50 and 30.00, and resistance is 33.70 and 34.50.
Risk is likely of an extension of the decline continuing in the short term if there is no resolution to minimize damages from the Silicon Banking collapse and investors feel secure about the banking sector. When the first rally occurs, it will likely be sharp but not likely sustainable.
Summing Up:
Market selling was broad, with all eleven market sectors ending the week in the red. Market internals weakened, technical indicators deteriorated with uptrends broken, volume and momentum patterns turning down, not up, and weakening market breadth. Until more clarity is given after the SVB Financial Group’s collapse and the implications are known for the banking sector, expect wide intraday swings and increased risk. In addition, economic news, including Consumer Price Index and Producer Price Index, will be released this week, followed by the FOMC meeting on March 21-22. In the meantime, it’s wise to review your portfolio to have an exit strategy taking a cautious approach in the near term. Before deciding to add to investments, wait until evidence of safer market conditions develops.
Remember to manage your risk, and your wealth will grow.
Let’s talk investing. You are invited to set up your Free 30-minute Wealth and Well-Being Strategy session by clicking here or emailing me at Bonnie@BonnieGortler.com. I would love to schedule a call and connect with you.
Disclaimer: Although the information is made with a sincere effort for accuracy, it is not guaranteed that the information provided is a statement of fact. Nor can we guarantee the results of following any of the recommendations made herein. Readers are encouraged to meet with their own advisors to consider the suitability of investments for their own particular situations and for determination of their own risk levels. Past performance does not guarantee any future results.


Create more wealth in your life
with these simple strategies.
As an added bonus you will also
receive BG’s Updates and Ezine

Discover how to quickly create more well-being in your life with these simple strategies.
As an added bonus you will also
receive BG’s Updates and Ezine

As an added bonus you will receive BG’s Updates and Ezine

All work listed on BonnieGortler.com is licensed under a Creative Commons Attribution - Noncommercial - No Derivative Works 3.0 Unported License.


Free Report:
Grow and Sustain Your Wealth
Discover how to grow your money with these easy, simple steps.

