

10 Simple Tips for Financial Well-Being
07/01/2026
A volatile week with seven of the eleven S&P SPDR sectors positive, Technology (XLK) and Communication Services (XLC) were the leading sectors, and Financial (XLF) and Energy (XLE) were the weakest, with the SPDR S&P 500 ETF Trust (SPY) up +1.44%.
S&P SPDR Sector ETFs Performance Summary 3/10/23-03/17/23

031723 SPDR SectorsSource: Stockcharts.com
Figure 2: Bonnie’s ETFs Watch List Performance 3/10/23-03/17/23
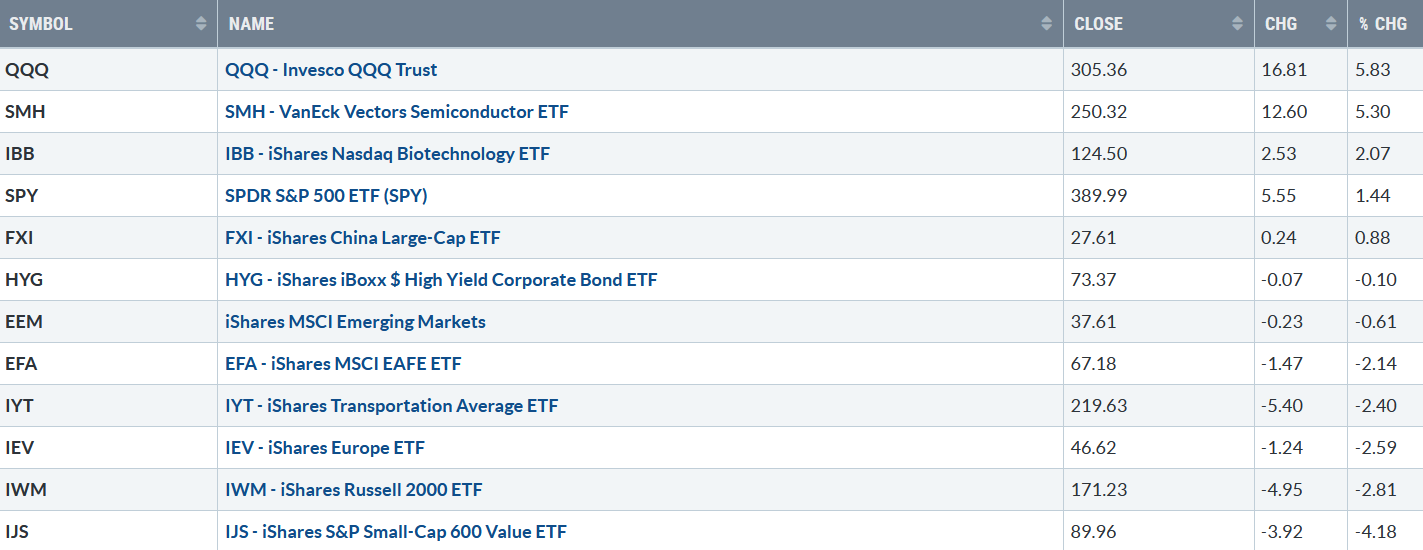
031723 Week ETFs
Source: Stockcharts.com
Mega Cap Technology and Semiconductors stocks were hot last week, helped by falling interest rates, sector rotation out of Financials into Technology, and end-of-quarter window dressing. Small Cap Growth, and Value, which hold significant bank investments, remained under selling pressure.
Figure 3: Fear & Greed Index
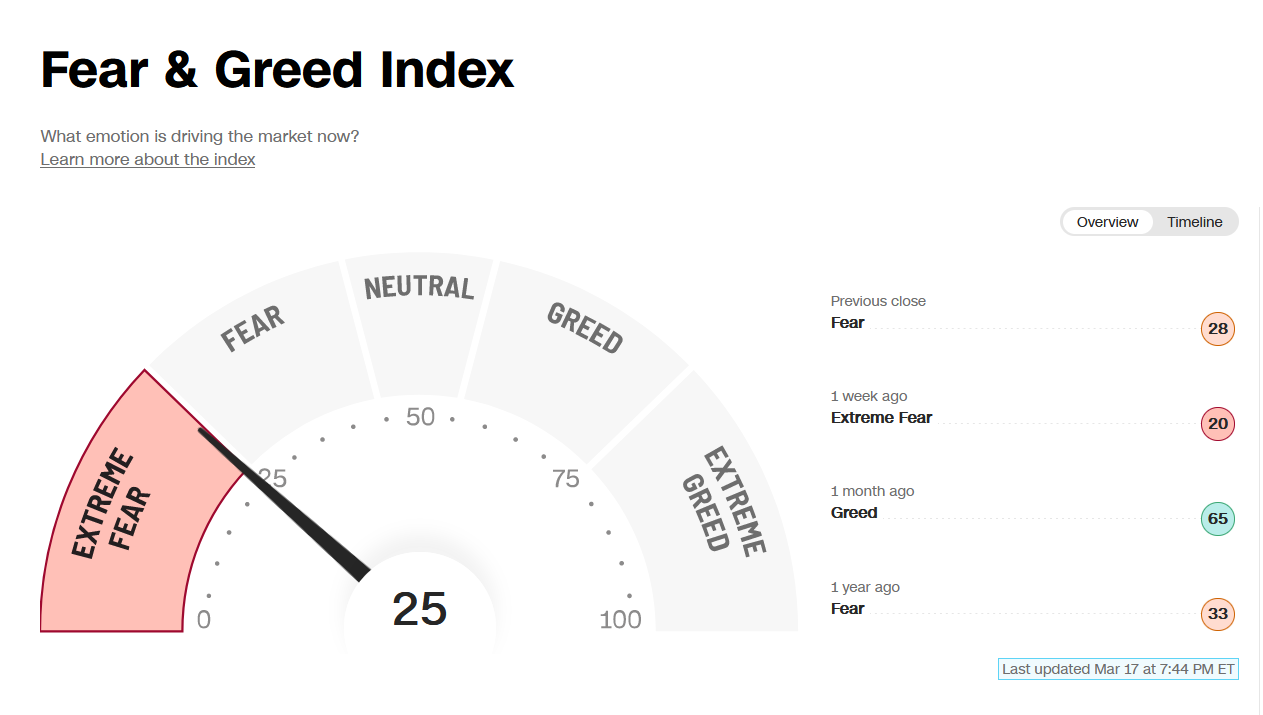
031723 Fear and Greed Index
Source:CNN
Investor sentiment based on the Fear and Greed Index (a contrarian index) rose last week but remained in Extreme Fear, closing at 25.
Figure 4: Citigroup Panic/Euphoria Model
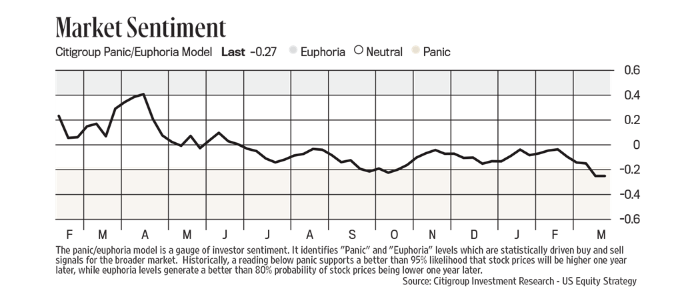
031723 Citigroup Panic Euphoria Model
The Citi Panic Euphoria (a contrarian indicator), a measure of investor sentiment has fallen to the panic zone and is now lower than in October 2022.
Figure 5: CBOE Volatility Index VIX
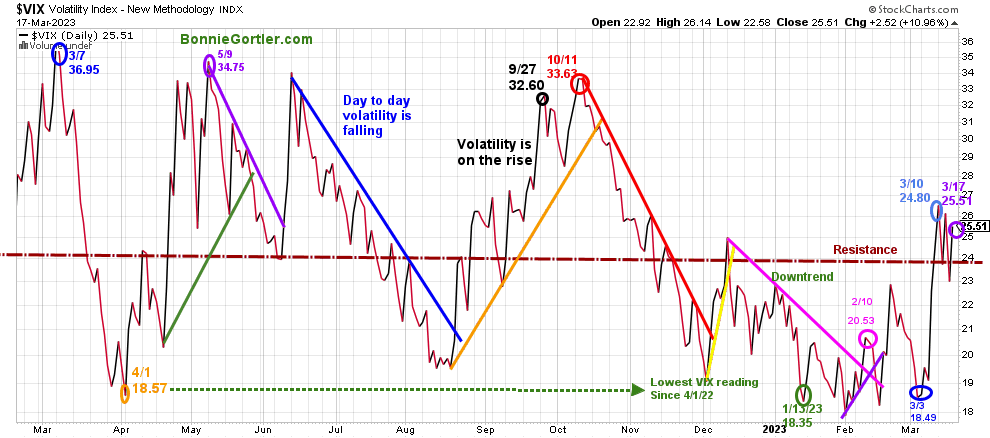
031723 VIX Daily
Source: Stockcharts.com
The CBOE Volatility Index (VIX), a measure of fear, traded above 20.00 for most of 2022, with a high at 36.95 on 3/7 (blue circle) and a low on 4/1/22 at 18.57. A new VIX low didn’t occur until 1/13/23 at 18.35 (green circle).
VIX rose last week, closing at 25.51 (purple circle). VIX above 20.00 suggests daily intraday swings will remain high. If the decline accelerates, VIX will likely go above the high made in October to between 40 and 60.
Figure 6: UST 10YR Bond Yields Daily
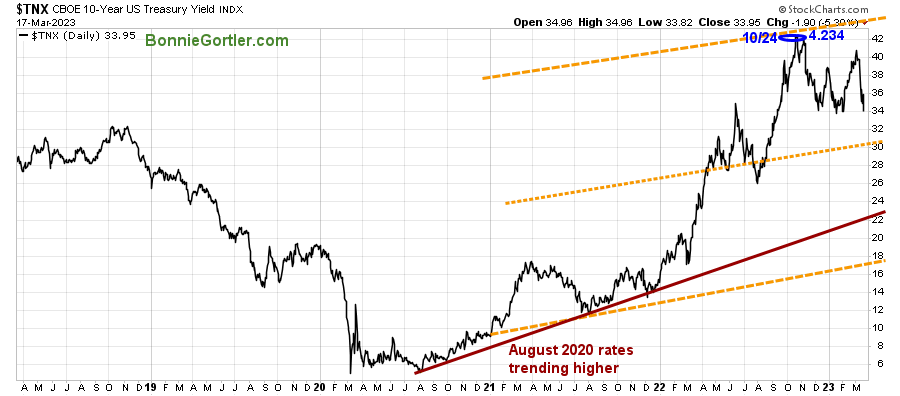
031723 UST 10 Yr Bond Yields Daily
Source: Stockcharts.com
The 10-Year U.S. Treasury yields fell sharply last week, closing at 3.395%, the lowest yield since September and well below its high of 4.091% made on 3/2 as investors continue buying treasury bonds for safety. Support is 3.00%, and resistance remains at 4.25% and 4.40%.
The major averages were resilient despite all the negative news. The Dow fell -0.15%, the S&P 500 was up +2.01%, and the Nasdaq gained +4.41%. However, the Russell 2000 Index continued sharply lower, declining by -2.64%
Figure 7: Value Line Arithmetic Average
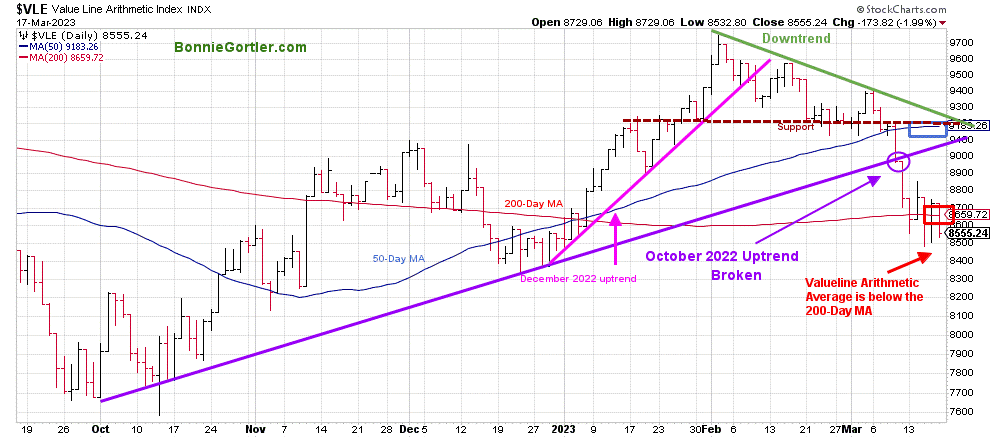
031723 VLE Daily
Source: Stockcharts.com
The Value Line Arithmetic Index ($VLE) (a mix of approximately 1700 stocks) fell -2.32%, remaining below the October uptrend (purple circle).
VLE broke support at 9200 below, closed below the 50-Day MA, and closed under the 200-Day MA, implying underlying weakness.
Resistance lies at 8700, 9000, and 9200. Until the Valueline Index firms, the risk of further decline in the broad market is high.
Weekly market breadth was negative on the New York Stock Exchange Index (NYSE) and for Nasdaq. The NYSE had 943 advances and 2273 declines, with 62 new highs and 534 new lows. There were 1957 advances and 3062 declines on the Nasdaq, with 152 new highs and 960 new lows.
Learn about coaching with Bonnie. Ask questions. Discover more about the coaching processes in this 15-minute call by signing up here or emailing me at Bonnie@BonnieGortler.com. I would love to schedule a call and connect with you.
Market internals remain weak
Figure 8: Nasdaq Advance Decline Line Daily
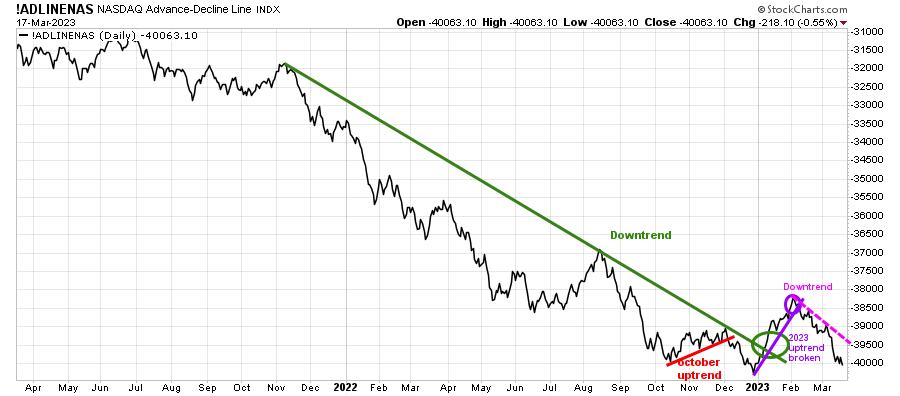
031723 Daily Nasdaq Cumulative Advance-Decline Line
Source: Stockcharts.com
The top chart is the Nasdaq Daily Advance-Decline Line, a technical indicator that plots the difference between the number of advancing and declining stocks.
In January, the October 2022 downtrend was broken (green line) but was short-lived, and in February 2023, the short-term uptrend (purple line) gave way as market breadth deteriorated.
Watch the market breadth if there are more advances than declines this week which would be positive, or if there are more declines than advances which would be considered negative in the short term and imply the recent rise in Nasdaq is unsustainable.
Figure 9: Nasdaq New Highs
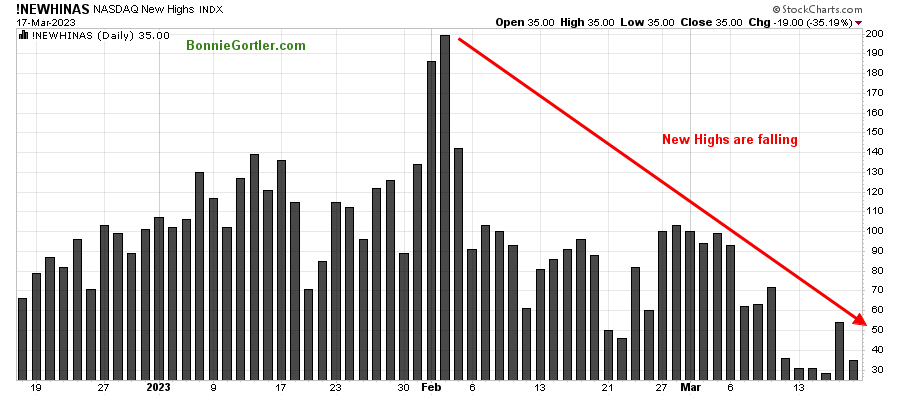
031723 Nasdaq New Highs Daily
Source: Stockcharts.com
The Nasdaq Index rose 4.41% and is up 11.12% in 2023. It concerns me that the number of stocks making new highs has been falling since February and are not expanding.
New Lows are falling on the Nasdaq but remain high
Figure 10: Nasdaq New Lows
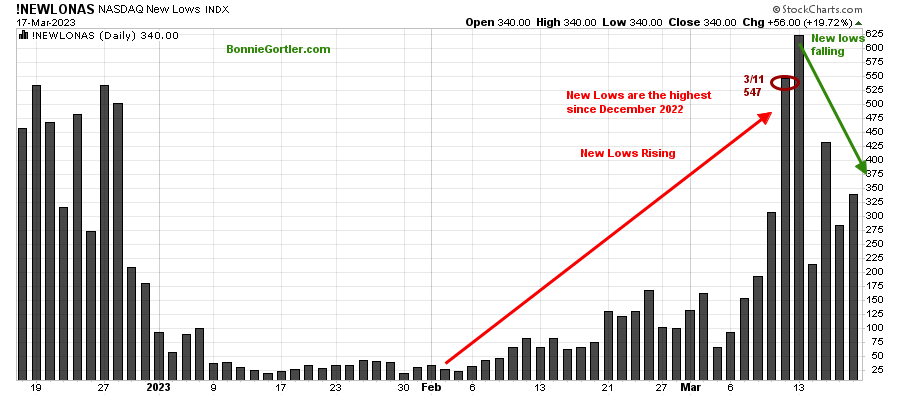
031723 Nasdaq New Lows Daily
Source: Stockcharts.com
Nasdaq New Lows declined but remain higher than in early 2023, which is worrisome.
Learn more about charting in my Free Masterclass, Charting Strategies to Cut Risk and Trade with the Trend. Sign up here
Figure 11: Daily New York Stock Exchange (NYSE) New Lows
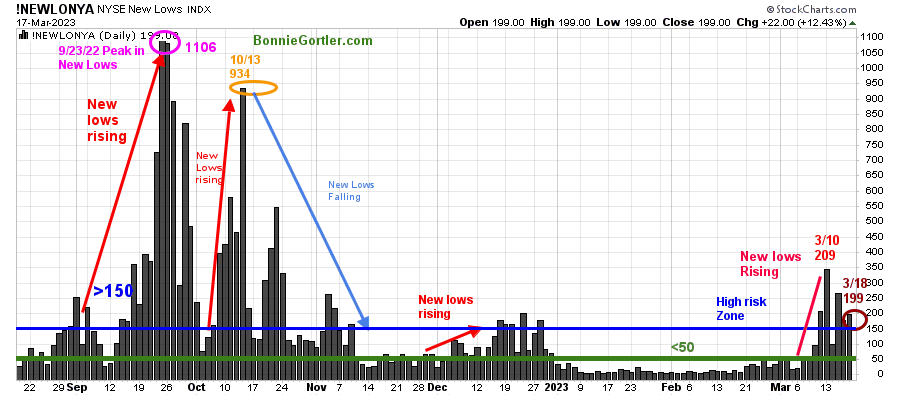
031723 NYSE New Lows Daily
Source: Stockcharts.com
Watching New Lows on the New York Stock Exchange is a simple technical tool that helps awareness of the immediate trend’s direction.
New lows warned of a potential sharp pullback, high volatility, and “panic selling” for most of 2022, closing above 150. The peak reading was 9/23/22 when New Lows made a new high of 1106 (pink circle).
After New Lows expanded to their highest level in 2023 on 3/10, New Lows fell slightly, closing last week at 199 on 3/17 (brown circle), remaining in the high-risk zone, above 150 (blue horizontal line), implying an increased risk of possible further selling pressure.
Here is an excerpt when new lows are above 150, the market is negative, higher risk, and selling is taking place. Sometimes it could be severe, and sometimes on a very nasty day, you can have “panic selling,” and big wild swings (high volatility) to the downside may occur.
Learn more about the significance of New Lows in my book, Journey to Wealth, published on Amazon. If you would like a preview, get a free chapter here.
Caution is recommended until New Lows fall below 150 and contracts below 50.
Small Caps break down continues
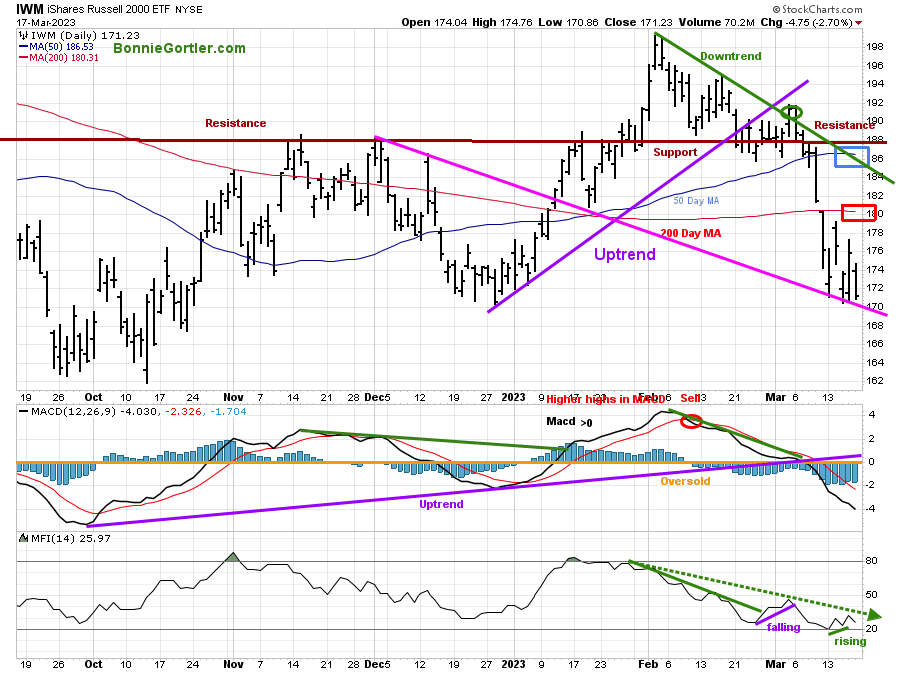
Figure 12: Daily iShares Russell 2000 (IWM) Price (Top) and 12-26-9 MACD (Middle) and Money Flow (Bottom)
031723 IWM Daily
Source: Stockcharts.com
The top chart is the daily iShares Russell 2000 Index ETF (IWM), the benchmark for small-cap stocks, with a 50-Day Moving Average (MA) (blue line) and 200-Day Moving Average (MA) (red line) that traders watch and use to define trends.
More selling pressure for Small Cap stocks, the highest sector in Financials, including the Regional Banks, remained under pressure. IWM was down -2.81%, closing at 171.23, below the 50-Day MA (blue rectangle) and 200-Day MA (red rectangle).
Resistance is well below previous support at 180.00, 184.00, and 188.00, where IWM broke down. Support is at 170.00, 166.00, and 160.00.
MACD remains on a sell, falling with momentum accelerating lower after the sell and breaking the uptrend from October (purple line). MACD is now at the most oversold level since October 2022, with no signs of downside momentum slowing.
The Money Flow Index (MFI) in the lower chart remains in a downtrend trend (green line), falling as investors shy away from small caps.
It would be a positive sign of a relief rally in the short term if IWM remains holds above 170.00 towards 180.00.
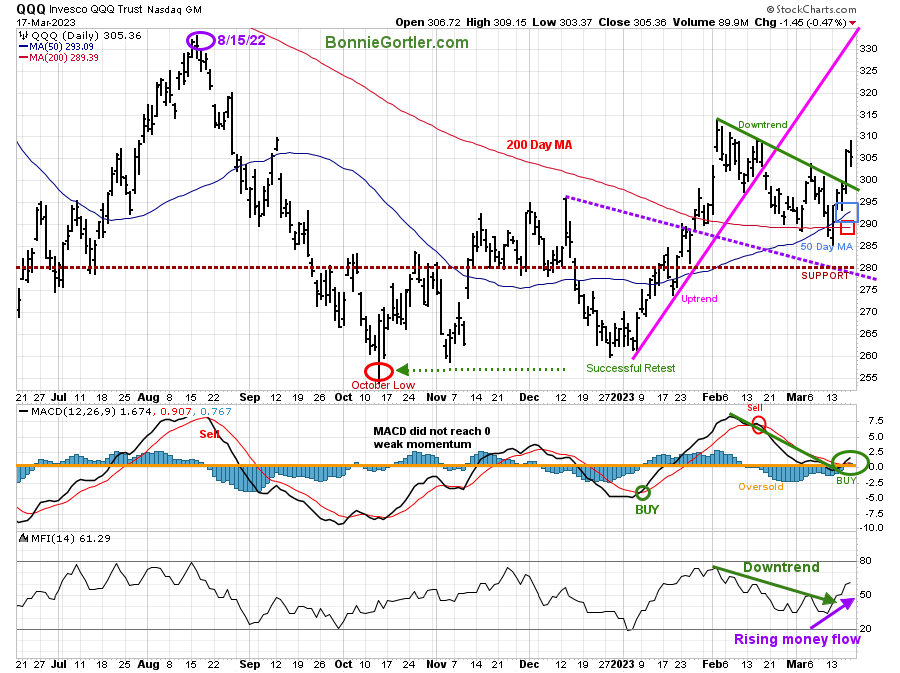
Figure 13: Daily Invesco QQQ Trust (QQQ) Price (Top) and 12-26-9 MACD (Middle) and Money Flow (Bottom)
031723 QQQ Daily
Source: Stockcharts.com
The chart shows the daily Invesco QQQ, an exchange-traded fund based on the Nasdaq 100 Index. QQQ made a low in October 2022 (red circle), followed by a successful retest of the low in early January 2023, then broke the uptrend (pink line) after reaching a new six-month high in February.
QQQ rose sharply, +5.83% last week, at 305.36, crossing above the 50-Day Moving Average and the 200-Day Moving Average (red rectangle) and breaking the February downtrend, shifting the daily trend to up. Top holdings, Microsoft (MSFT), Alphabet (GOOGL), and Nvidia (NVDA), were all up slightly over 12.00%, leading the QQQ higher.
QQQ penetrated support at 287,00 (tripping the stops) intraday on Monday, 3/13, but held above the critical support at 280.00 before reversing higher through resistance at 295.00, 303.00, but stalling at 310.00 before turning lower on Friday.
The middle chart is MACD (12, 26, 9), a measure of momentum that gave a fresh buy signal last week, confirmed by the breaking of the February downside trendline.
The Money Flow Index (MFI) in the lower chart also broke the downtrend trend (green line) and is rising, confirming the breakout in QQQ.
Resistance is 310.00, 314.00, 320.00, and 330.00, the old highs made in August 2022.
Figure 14: The S&P 500 Index (SPY) Daily (Top) and 12-26-9 MACD (Bottom)
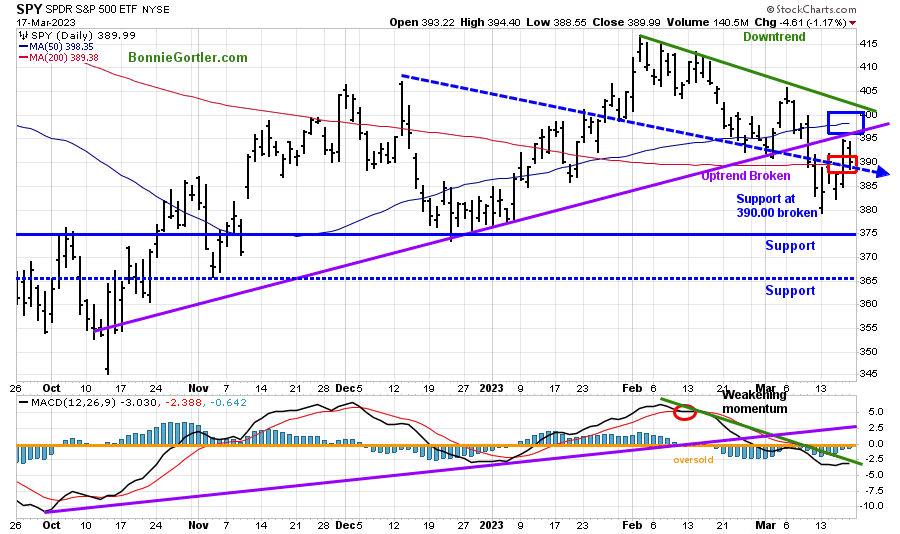
031723 SPY Daily
Source: Stockcharts.com
The S&P 500 (SPY) made a six-month high in early February 2023 and turned lower.
Last week SPY rose +1.44%, failing to get through the overhead and closing below the October 2022 uptrend (purple line), where it broke down. SPY remains below the 50-Day Moving Average (blue rectangle) but closed slightly above the 200-Day Moving Average (red rectangle).
MACD (lower chart) remains on a sell, oversold below 0, close to generating a buy if SPY moves higher. It’s a positive sign momentum is no longer accelerating and is close to breaking the downtrend from February (green line) next week.
Resistance is 395.00, followed by 400.00 and 405.00. Support is at 380.00, 375.00, and 365.00. A close below 365.00 would imply a test of its December low.
Financials remained under selling pressure.
Figure 15: The Financial Select Sector SPDR (XLF) Daily (Top) and 12-26-9 MACD (Bottom)
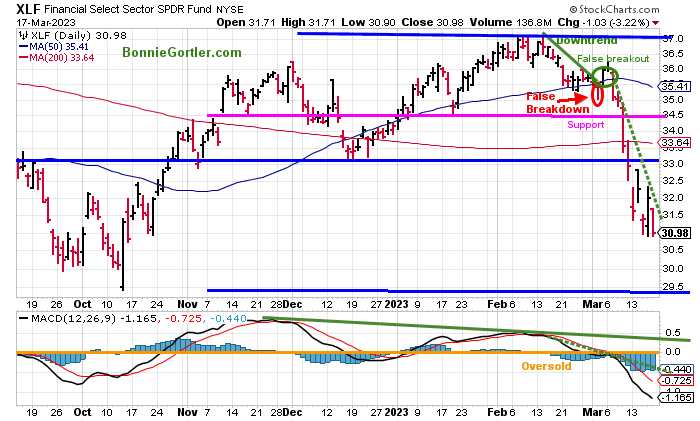
031723 XLF Daily
Source: Stockcharts.com
With the collapse of Silicon Valley and Signature Bank, Financials (XLF) fell sharply last week, down -5.92% and closing near their low on Friday. Regional Banks (KRE) remained under selling pressure, down -14.30%, as Credit Suisse added to the woes in the banking center.
Last week XLF traded below 34.50 support and selling accelerated. The next support is at 31.50, followed by 30.00.
Resistance is at 31.50, 33.70, and 34.50.
Risk is likely of an extension of the decline continuing in the short term if there is no resolution for investors to feel secure about the banking sector. If and when there is confidence restored, the first rally will be sharp as many stocks have fallen substantially, and investors will go bargain hunting.
The first rally is likely, not sustainable; a safer entry, not necessarily at a lower price, will be in 3-6 weeks after the low occurs.
(At the time of this writing (3/19), the Financial Times reported there are negotiations that UBS offered to buy Credit Suisse for up to $1 Billion, and soon after that, news of UBS buying Credit Suisse for just over 3 billion, with Swiss gov’t loss guarantees and liquidity assistance). Time will tell how global and U.S. markets will respond.
.
Rotation into Utilities?- Short Term-Buying Opportunity Developing
Figure 16: Utilities SPDR (XLU) Daily (Top) and 12-26-9 MACD (Bottom)
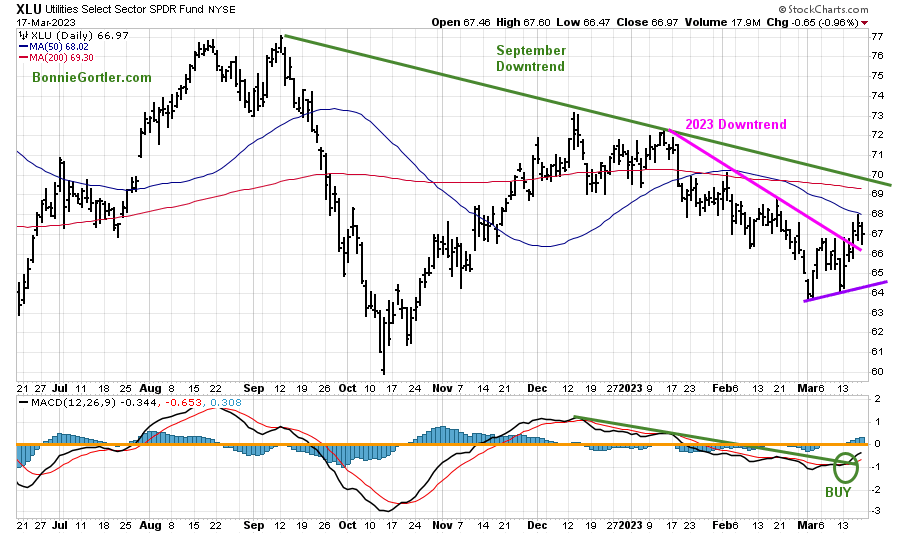
031723 XLU Daily
The Utilities SPDR (XLU) has been in a downtrend in 2023 that began in September 2022.
XLU was the third-best sector gaining +3.96% stronger than the S&P 500. Its positive XLU broke the 2023 downtrend on Wednesday. However, XLU stalled at the 50-Day Moving Average but remains constructive, pulling back where XLU broke the downtrend, testing the breakout.
MACD, a measure of momentum, is now on a buy (green circle) along with a break of downside momentum since December 2022.
A close above 68.00 would imply XLU will trend higher, and a close below 64 would negate my positive outlook.
Summing Up:
Market internals continues to weaken despite the weekly gains in Nasdaq and the S&P 500. Nasdaq rose but had fewer stocks participating in the rally, with Large Cap Technology stocks dominating. At the same time, it’s concerning the broad market continued lower, including the Russell 2000, Valueline Arithmetic Index, Financials, and Energy. Unless the banks stabilize quickly, market breadth improves, and the averages get above resistance, a rally will likely be narrow in scope. With all the uncertainty and fear, intraday volatility will remain higher than average. The FOMC meeting is on March 21-22, where we will find out the next course of action by the Fed, which could give more clarity in the future. Finally, reviewing your portfolio and planning your exit strategies before adding long-term investments is wise until there is lower intraday volatility and evidence of safer market conditions.
Remember to manage your risk, and your wealth will grow.
Let’s talk investing. You are invited to set up your Free 30-minute Wealth and Well-Being Strategy session by clicking here or emailing me at Bonnie@BonnieGortler.com. I would love to schedule a call and connect with you.
Disclaimer: Although the information is made with a sincere effort for accuracy, it is not guaranteed that the information provided is a statement of fact. Nor can we guarantee the results of following any of the recommendations made herein. Readers are encouraged to meet with their own advisors to consider the suitability of investments for their own particular situations and for determination of their own risk levels. Past performance does not guarantee any future results.


Create more wealth in your life
with these simple strategies.
As an added bonus you will also
receive BG’s Updates and Ezine

Discover how to quickly create more well-being in your life with these simple strategies.
As an added bonus you will also
receive BG’s Updates and Ezine

As an added bonus you will receive BG’s Updates and Ezine

All work listed on BonnieGortler.com is licensed under a Creative Commons Attribution - Noncommercial - No Derivative Works 3.0 Unported License.


Free Report:
Grow and Sustain Your Wealth
Discover how to grow your money with these easy, simple steps.

