

10 Simple Tips for Financial Well-Being
07/01/2026
An improving tape last week with seven of the eleven S&P SPDR sectors higher Technology (XLK) and Communication Services (XLC) were the best sectors, while Real Estate (XLRE) and Utilities lagged with the SPDR S&P 500 ETF Trust (SPY) up +1.71%.
S&P SPDR Sector ETFs Performance Summary 5/12/23-05/19/23
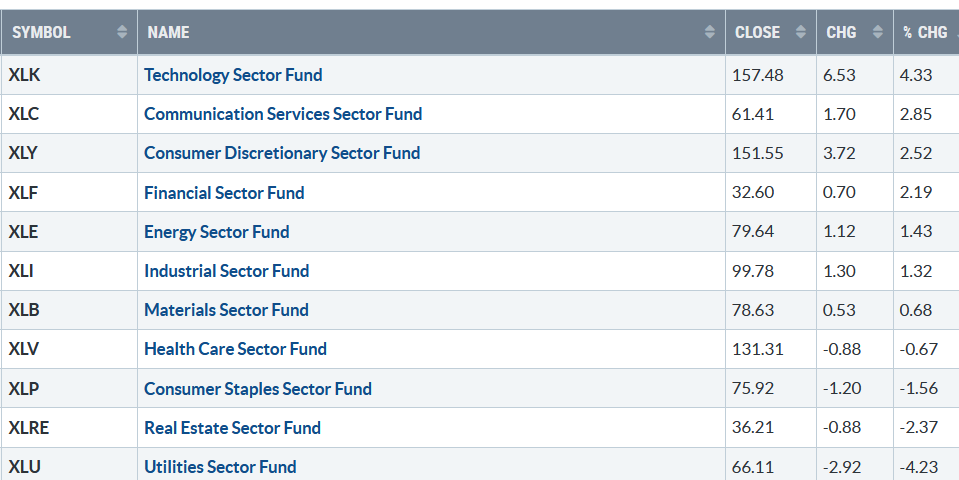
Source: Stockcharts.com
Bonnie’s ETFs Watch List Performance Summary 5/12/23-05/19/23
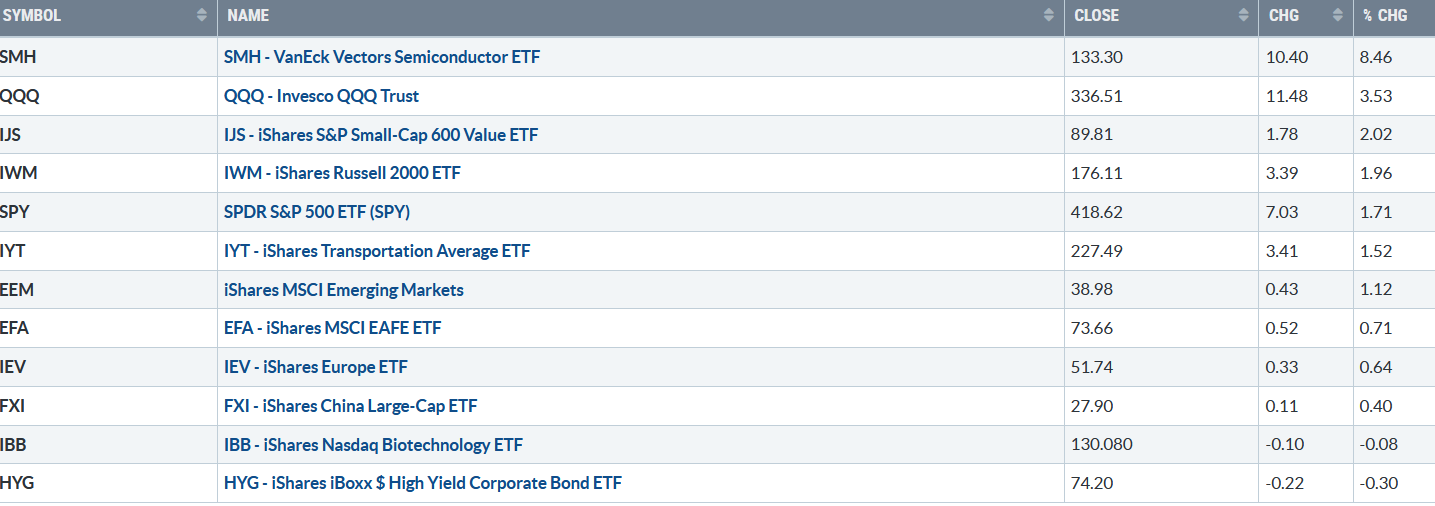 Source: Stockcharts.com
Semiconductors were hot, leading the market higher. Technology and Small and Mid-Cap Stocks also performed well, a bullish sign for the continuation of the rally. Biotechnology and Hi Yield was weak, not participating in the rally.
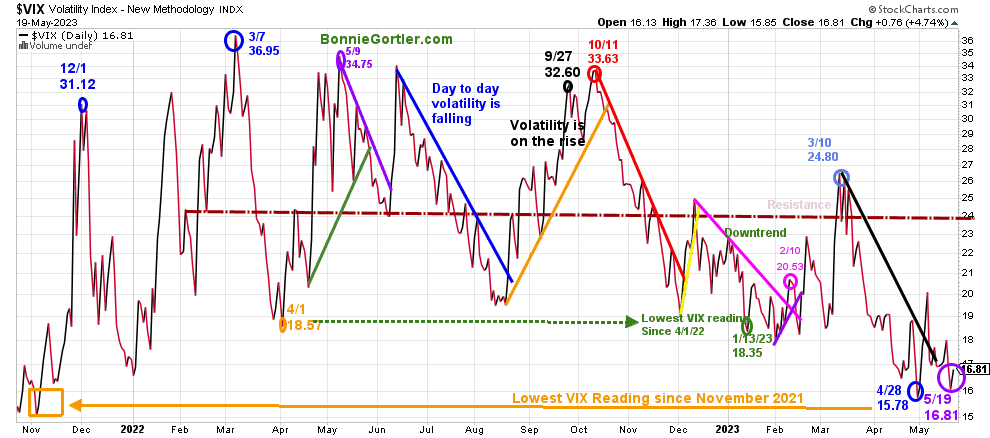
Figure 3: CBOE Volatility Index VIX
051923 VIX Daily
Source: Stockcharts.com
The CBOE Volatility Index (VIX), a measure of fear, traded above 20.00 for most of 2022, with a high at 36.95 on 3/7 (blue circle) and a low on 4/1/22 at 18.57. A new VIX low did not occur until 1/13/23 at 18.35 (green circle).
The volatility Index (VIX) fell last week, with VIX (purple circle) closing at 16.81.
Watch for increasing daily fluctuations and a more severe pullback if VIX closes above 20.00 and then closes above 24.00.
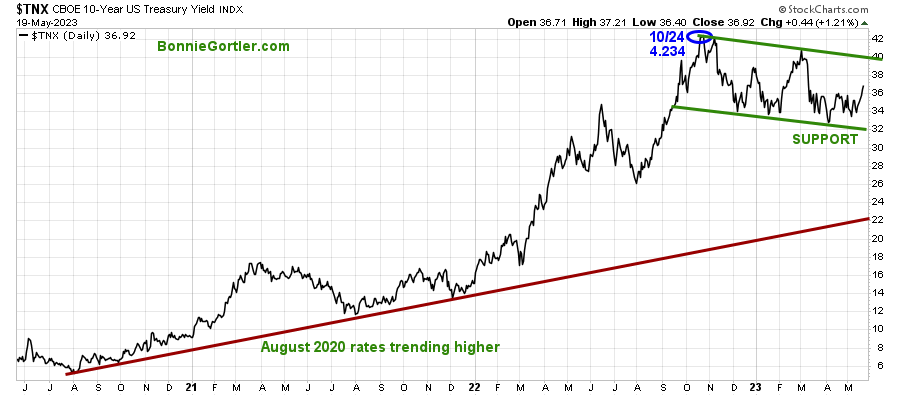
Figure 4: UST 10YR Bond Yields Daily
051923 UST 10 Yr Bond Yields Daily
Source: Stockcharts.com
The 10-Year U.S. Treasury yields rose last week, closing at 3.692%. Support remains at 3.20%, with resistance at 4.00%.
The major market averages were all higher last week. The Dow rose +0.38%, lagging the other major averages, the S&P 500 up +1.65%, and the Nasdaq gained +3.04%. The Russell 2000 Index had a good week rising +1.89%.
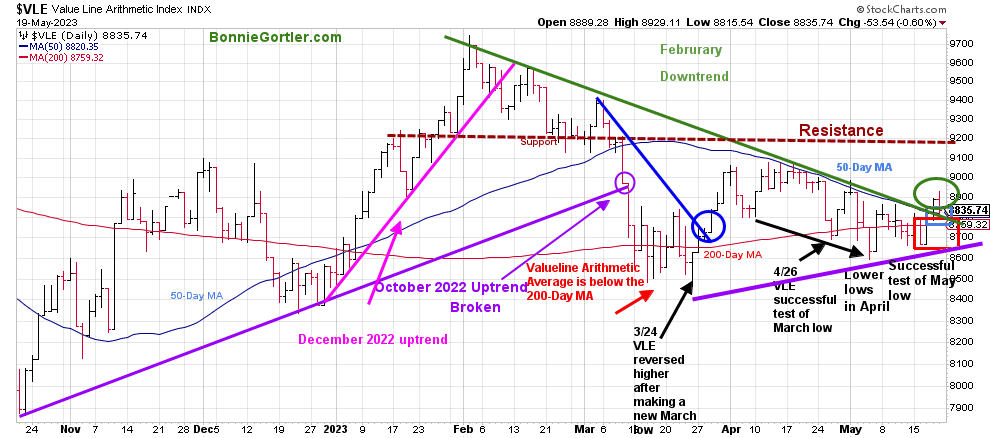
Figure 5: Value Line Arithmetic Average
051923 VLE Daily
Source: Stockcharts.com
The Value Line Arithmetic Index ($VLE) is a mix of approximately 1700 stocks. VLE broke the October 2022 uptrend in early March, headed lower, and on 3/24, bottomed and reversed higher.
The decline held above the May low, and then last week, the February downtrend (green line) broke (green circle), with the VLE gaining +1.41% and closing above the 200-Day MA and the 50-Day MA (blue rectangle), implying underlying strength.
Key resistance remains at 9200, and support is at 8700, 8650, and 8600.
However, it would be negative if the Value Line Index reverses, closes below the April 26 low, and breaks the March uptrend (purple line), and would likely start a decline toward the 3/24 low at 8466. A close below would be a warning a significant decline could begin.
Learn more about charting in my Free 33-minute training. Sign up here
An improvement in market breadth.
Weekly market breadth was positive on the New York Stock Exchange Index (NYSE) and for the Nasdaq. The NYSE had 1814 advances and 1320 declines, with 160 new highs and 188 new lows. There were 2973 advances and 1953 declines on the Nasdaq, with 262 new highs and 429 new lows.
For the advance to broaden, you want to see an expansion in the weekly number of New Highs and New Lows to contract.
February downtrend in AD-Line broken
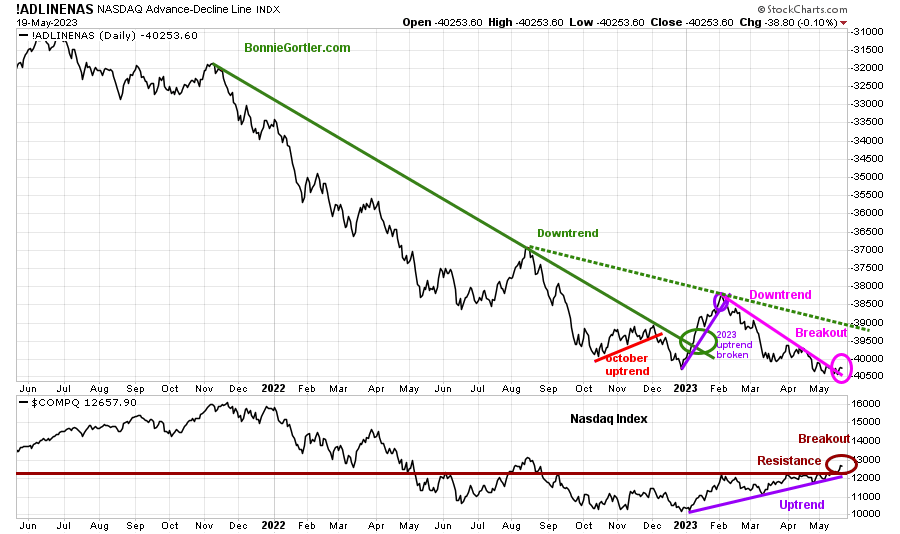
Figure 6: Nasdaq Advance Decline Line Daily (Top) and Nasdaq (Bottom)
Source: Stockcharts.com
The chart is the Nasdaq Daily Advance-Decline Line, a technical indicator that plots the difference between the number of advancing and declining stocks.
In January, the October 2022 downtrend was broken (green line). However, the improvement in the market breadth was short-lived, with the Nasdaq Advance-Decline line deteriorating in February 2023 and staying in a downtrend (pink line top chart) as the Nasdaq (bottom chart) moved higher.
Finally, the downtrend broke last week (pink circle), a positive sign in the short term. Watch the August downtrend (green dotted line) for further confirmation if it breaks. However, the rally will likely fail if the AD-Line turns down before breaking the August downtrend.
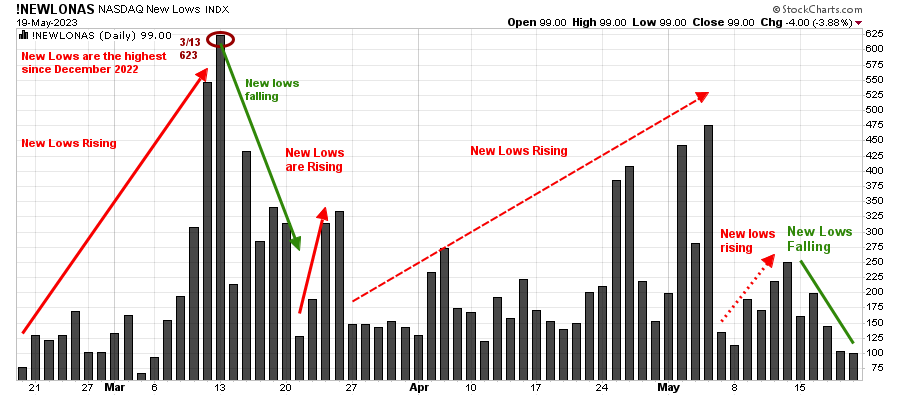
Figure 7: Nasdaq New Lows
051923 Nasdaq New Lows Daily
Source: Stockcharts.com
Nasdaq New Lows had begun to increase in May (red dotted line on the right) but stayed below 475, which was a positive sign.
Last week Nasdaq New Lows fell, closing at 99, its lowest reading since early March, and would be positive if New Lows continue to contract.
On the other hand, a rise above 275 and then 475 would be a negative sign implying the increased odds of a market decline.
Learn about coaching with Bonnie. Ask questions. Discover more about the coaching processes in this 15-minute call by signing up here or emailing me at Bonnie@BonnieGortler.com. I would love to schedule a call and connect with you.
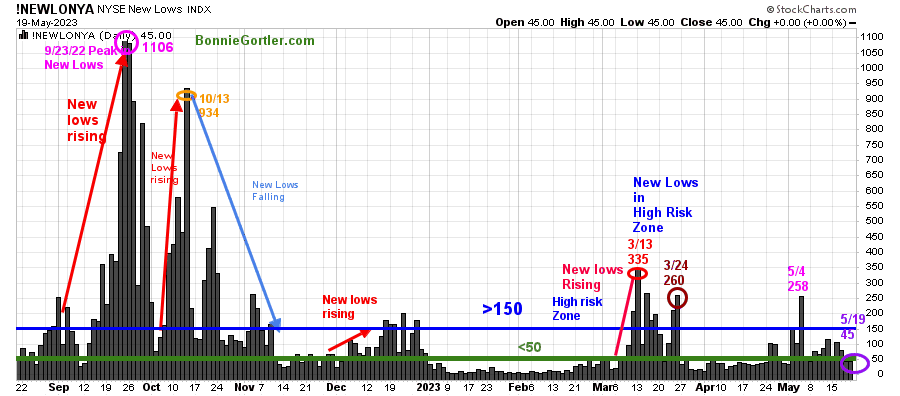
Figure 8: Daily New York Stock Exchange (NYSE) New Lows
051923 NYSE New Lows Daily
Source: Stockcharts.com
Watching New Lows on the New York Stock Exchange is a simple technical tool that helps awareness of the immediate trend’s direction.
New lows warned of a potential sharp pullback, high volatility, and “panic selling” for most of 2022, closing above 150. The peak reading was 9/23/22 when New Lows made a new high of 1106 (pink circle), and New Lows expanded to their highest level in 2023 on 3/13 (red circle) to 335, which have not been taken out in late March or during the weakness in early May.
New Lows fell last week, closing at 45 (purple circle), no longer in the high-risk zone of >150 (blue horizontal line), and falling to the lower-risk zone between 25 and 50.
I want New Lows to fall next week to the lowest risk zone below 25 and stay there. Also, seeing an increase of the New Highs to more than 203 will imply a sign of a potential broadening rally to begin.
On the other hand, two closes above 150 New Lows would imply an increased risk of a decline forthcoming.
Learn more about the significance of New Lows in my book, Journey to Wealth, published on Amazon. If you would like a preview, get a free chapter here.
Small Caps downtrend broken.
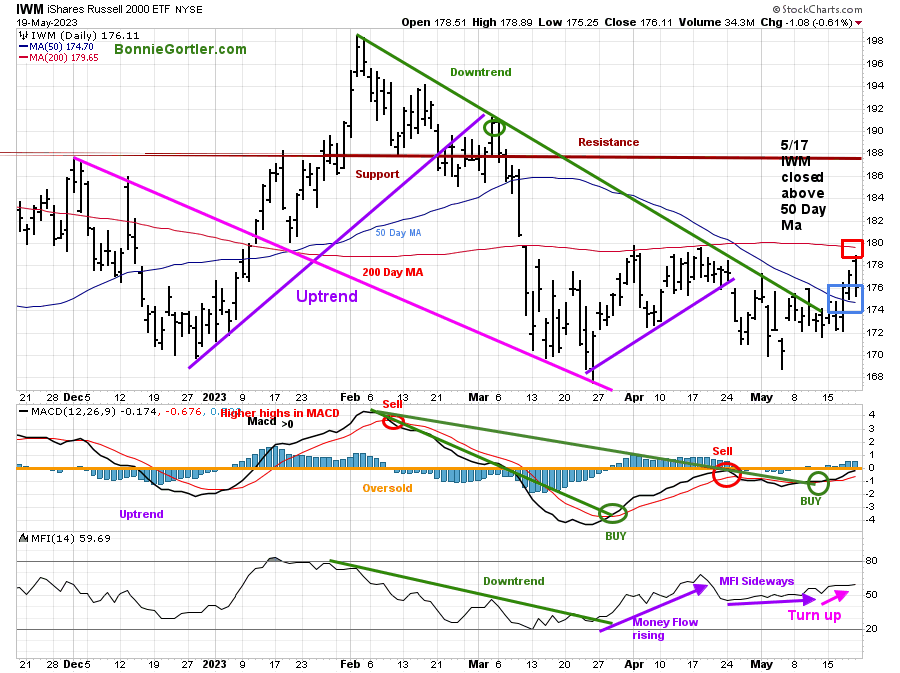
Figure 9: Daily iShares Russell 2000 (IWM) Price (Top) and 12-26-9 MACD (Middle and Money Flow (Bottom)
051923 IWM Daily
Source: Stockcharts.com
The top chart is the daily iShares Russell 2000 Index ETF (IWM), the benchmark for small-cap stocks, with a 50-Day Moving Average (MA) (blue line) and 200-Day Moving Average (MA) (red line) that traders watch and use to define trends.
The February downtrend in IWM broke last week (solid green line) above the 50-Day MA (blue rectangle) and is now close to its 200-Day MA (red rectangle), which closed at 179.65.
IWM was strong last week, closing at 176.11, up +1.96%. Resistance remains at 178.00, 180.00, and 188.00, where IWM broke down in March. Support is at 174.00. 169.00 and 166.00.
MACD is on a buy showing better momentum and close to getting over 0, indicating a sign of strength.
Money Flow (lower chart) is rising after moving sideways in April.
It would be favorable and likely to attract more buying if IWM can overcome resistance at 180.00 and MFI rises above the April high.
Nasdaq breaks out above resistance.
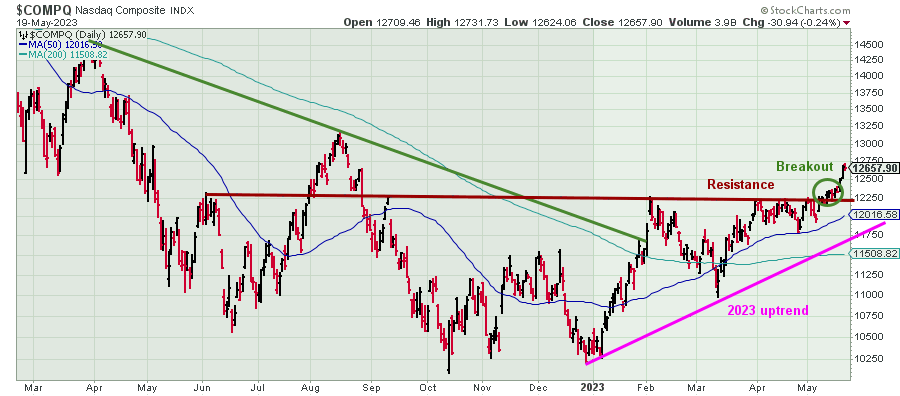
Figure 10: Nasdaq Composite
051923 Nasdaq Composite Daily
Source: Stockcharts.com
Nasdaq penetrated resistance of 12300 last week, closing at 12657.30, breaking out and ready to test or surpass the August highs as long as Nasdaq remains above 12250.
Overhead Resistance Remains
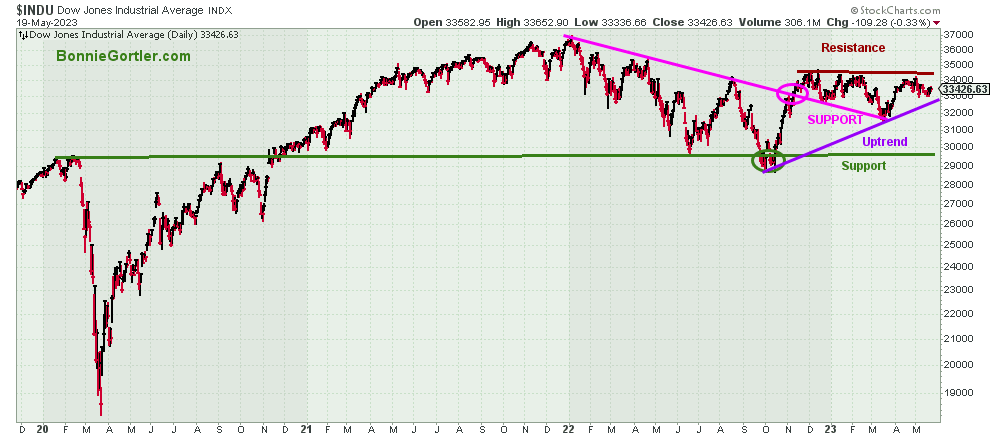
Figure 11: Dow Jones Industrial Average
051923 Dow Jones Industrial Daily
Source: Stockcharts.com
The Dow Jones Industrial Average closed higher by +0.38% at 33426.63, below resistance at 34250. A close above resistance for two days could fuel bargain hunting as the Dow has underperformed in 2023.
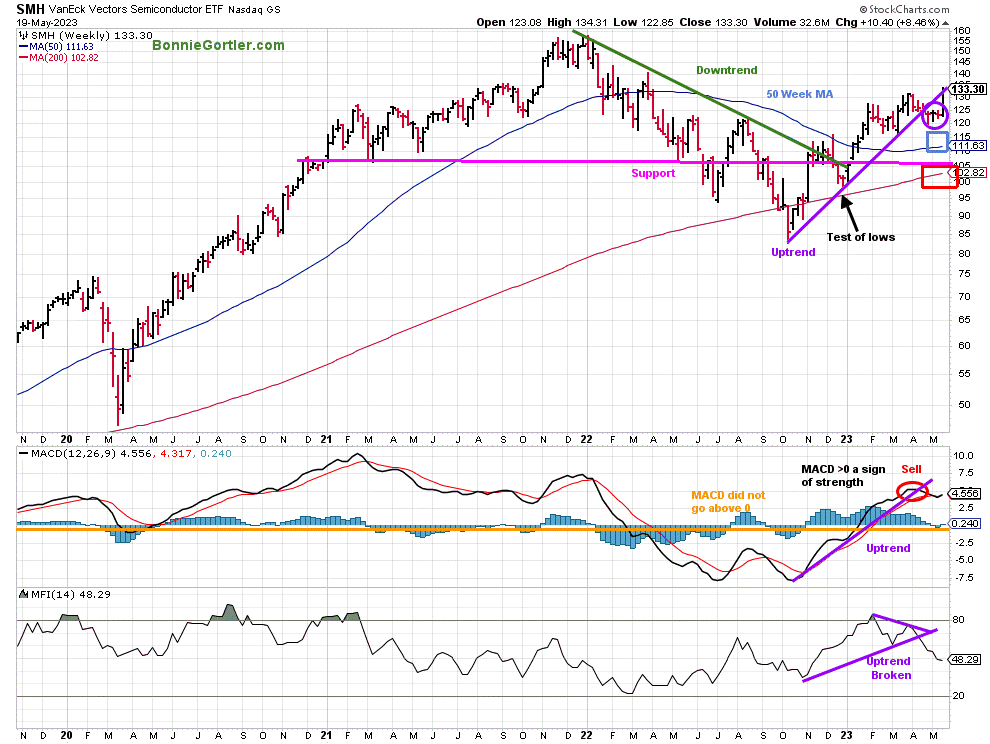
Figure 12: Weekly Vaneck Vectors Semiconductors (SMH) Price (Top) and 12-26-9 MACD (Middle) and Money Flow (Bottom)
051923 SMH Weekly
Source: Stockcharts.com
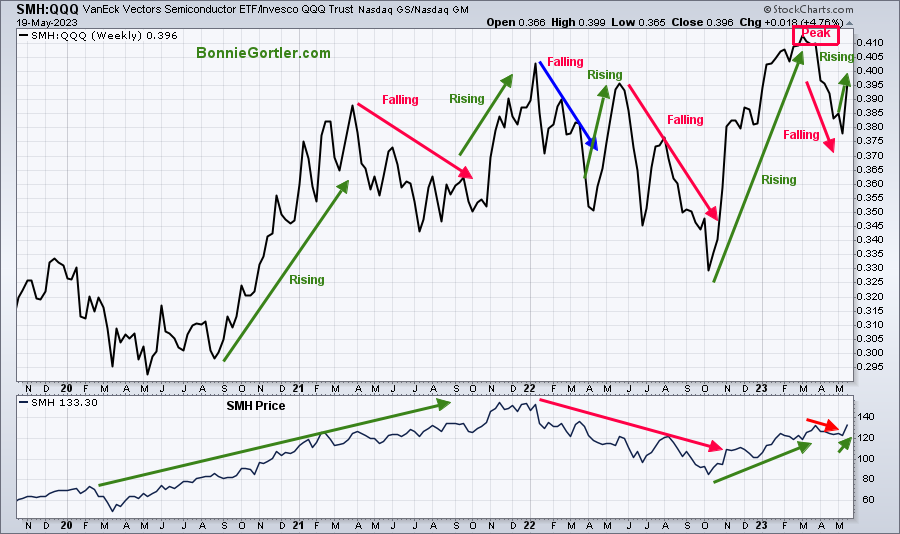
The top chart shows the Weekly Semiconductors (SMH) ETF, concentrated mainly in US-based Mega-Cap Semiconductors companies.
SMH tends to be a lead indicator for the market when investors are willing to take on increased risk and the opposite when the market is falling. SMH broke its downtrend in October 2022 (green line), retraced the breakout in late December and March, and is now rising again.
Last week SMH led, rising +8.46%, precisely what the market needed to move higher, as mentioned in the 5/12/23 Market Update. Its positive SMH closed above the 50 and 200-week MA (blue and red rectangle).
MACD, (the middle chart) is on a sell with momentum weakening, not in a position to generate a new buy.
Money Flow (MFI) broke the October uptrend in April and continues to move lower.
SMH looks higher but is more of a hold than a buy now.
SMH Relative Strength vs. QQQ turn up
Figure 13: VanEck Vectors Semiconductor/Invesco QQQ Trust (SMH/QQQ) Weekly Relative Strength Index Ratio
051923 SMH QQQ Weekly Relative Strength Ratio
Source: Stockcharts.com
The top part of the chart is the weekly VanEck Vectors Semiconductor/Invesco QQQ Trust (SMH/QQQ) Index Ratio. A rising line means the SMH is stronger, and if falling, the QQQ is stronger.
The SMH/QQQ ratio peaked in March.
Semiconductors outperformed QQQ, turning the (SMH/QQQ) Index Ratio higher, which bodes well for the overall market in the short term if this relationship continues.
Figure 14: Daily Invesco QQQ Trust (QQQ) Price (Top) and 12-26-9 MACD (Middle) and Money Flow (Bottom)
051923 QQQ Daily
Source: Stockcharts.com
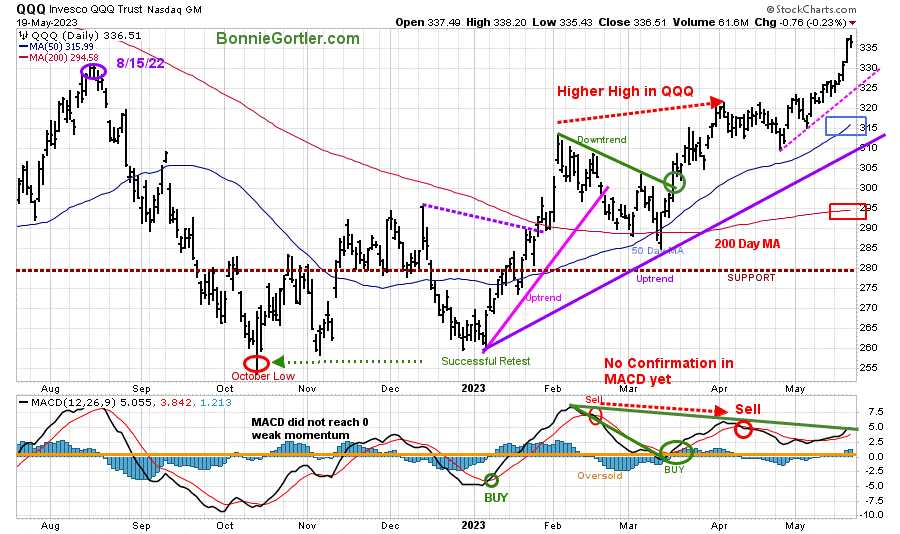
The chart shows the daily Invesco QQQ, an exchange-traded fund based on the Nasdaq 100 Index. QQQ made a low in October 2022 (red circle), followed by a successful retest of the low in early January 2023.
The 2023 uptrend remains in effect,
QQQ rose +3.53% last week, closing at 336.51, near its high for the week, and continues to strengthen, closing above the 50-Day Moving Average and the 200-Day Moving Average (red rectangle).
QQQ broke the old high made in August 2022 (purple circle) above resistance at 331.16. Support is at 325.00, 320.00, and 310.00.
The bottom chart is MACD (12, 26, 9), a measure of momentum remains on a sell, but no buy is possible with MACD above 0. However, it would be favorable if MACD continues to rise, taking out April highs to confirm the high made-in price.
With QQQ continuing the pattern of higher lows and higher highs, the benefit of the doubt remains with the bulls.
Figure 15: Weekly Invesco QQQ Trust (QQQ) Price (Top) and 12-26-9 MACD (Bottom)
051923 QQQ Weekly
Source: Stockcharts.com
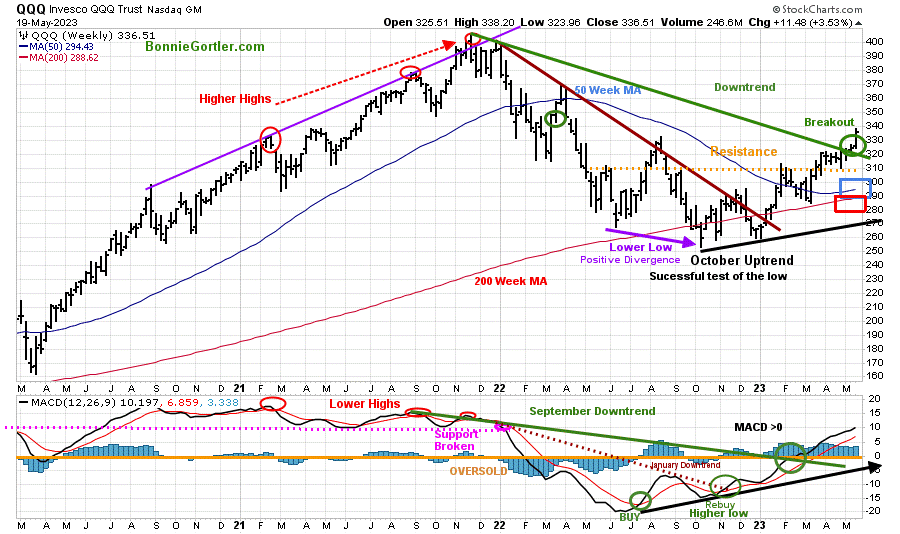
The intermediate trend remains up.
QQQ broke the November 2022 weekly price downtrend (green line top chart) and closed above the August 2022 highs.
Its positive QQQ continues its pattern of higher lows and higher highs, closing above the 50 and 200 Week MA and remaining above the old resistance at 310.00, acting as key support.
Its positive MACD remains above 0, rising to a new high, confirming the breakout in QQQ.
Figure 16: The S&P 500 Index (SPY) Daily (Top) and 12-26-9 MACD (Bottom)
051923 SPY Daily
Source: Stockcharts.com
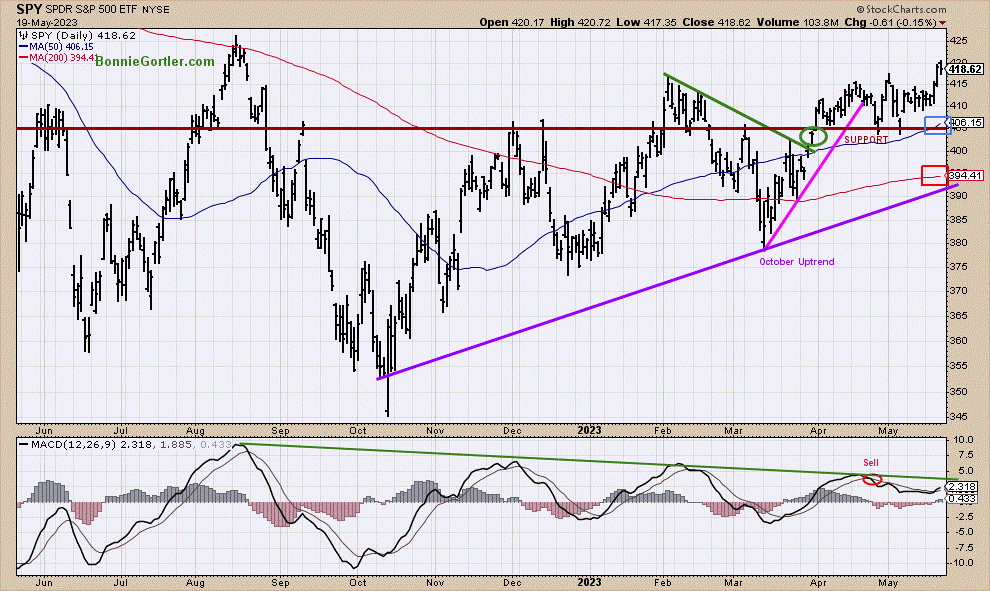
The S&P 500 (SPY) made a high in April 2023 and then turned lower.
SPY rose +1.71%, breaking out above the current trading range, remaining above the 50-Day Moving Average (blue rectangle) and above the 200-Day Moving Average (red rectangle), a sign of underlying strength.
MACD (bottom chart) remains on a sell.
Resistance is at 425.00. Support is at 417.00, 405.00, and 400.00
The bulls are in control as long as SPY remains above 405.00.
Figure 17: Daily SPDR S&P 500 ETF Trust (SPY), (Top) and below SPDR S&P MidCap 400 (MDY), iShares Core S&P Small-Cap (IJR), and iShares Micro-Cap (IWC) ETF
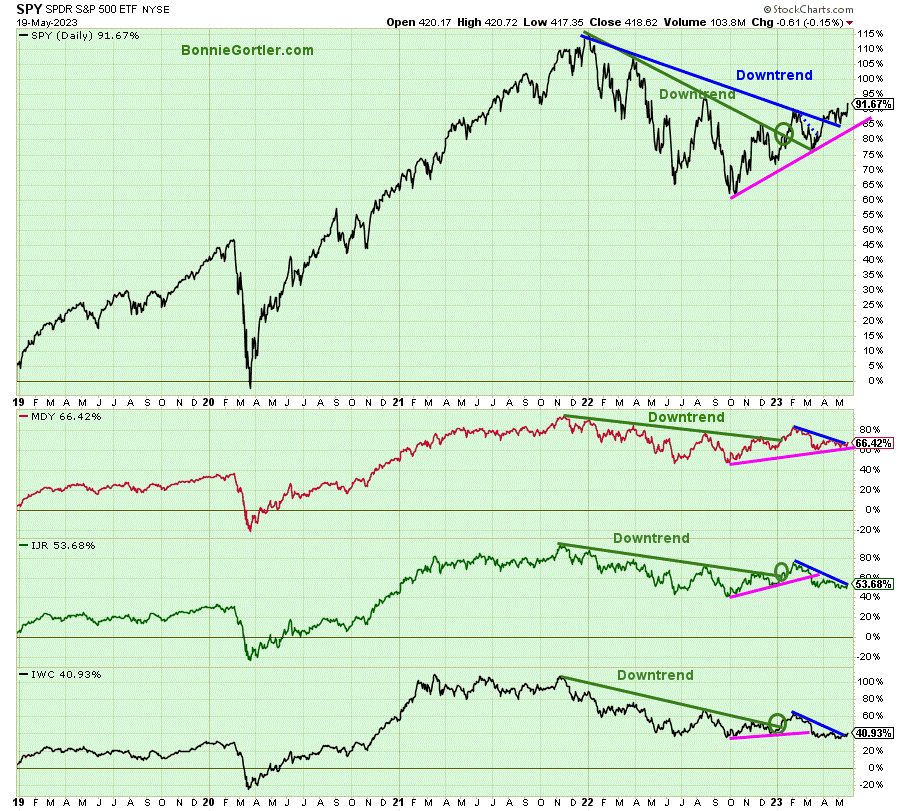
051923 SPY MDY, IJR, and IWC ETF Daily
Source: Stockcharts.com
The above chart is The SPDR S&P 500 ETF Trust (SPY), SPDR S&P MidCap 400 ETF (MDY), iShares Core S&P Small-Cap (IJR), and iShares Micro-Cap (IWC).
All four ETFs broke the longer-term downtrends earlier this year (green lines), but the rally has been narrow in 2023, with SPY the only one trading above the February downtrend (blue line).
Last week all 4 ETFs were higher, but there is more work to do for confirmation.
You want to see the downtrends breaking in MDY, IJR, and IWC this week and price stronger than the SPY to confirm the breakout.
Summing Up:
Last week, U.S. debt ceiling negotiations progressed, but no deal as negotiations will continue. The major market averages moved higher. S&P 500 and Nasdaq had their best weeks since the end of March, led by strength in Semiconductors and Technology. As a result, market breadth improved, momentum patterns turned up, and overhead resistance penetrated, which implies higher prices in the near term.
Remember to manage your risk, and your wealth will grow.
Let’s talk investing. You are invited to set up your Free 30-minute Wealth and Well-Being Strategy session by clicking here or emailing me at Bonnie@BonnieGortler.com. I would love to schedule a call and connect with you.
Disclaimer: Although the information is made with a sincere effort for accuracy, it is not guaranteed that the information provided is a statement of fact. Nor can we guarantee the results of following any of the recommendations made herein. Readers are encouraged to meet with their own advisors to consider the suitability of investments for their own particular situations and for determination of their own risk levels. Past performance does not guarantee any future results.


Create more wealth in your life
with these simple strategies.
As an added bonus you will also
receive BG’s Updates and Ezine

Discover how to quickly create more well-being in your life with these simple strategies.
As an added bonus you will also
receive BG’s Updates and Ezine

As an added bonus you will receive BG’s Updates and Ezine

All work listed on BonnieGortler.com is licensed under a Creative Commons Attribution - Noncommercial - No Derivative Works 3.0 Unported License.


Free Report:
Grow and Sustain Your Wealth
Discover how to grow your money with these easy, simple steps.

