

10 Simple Tips for Financial Well-Being
07/01/2026
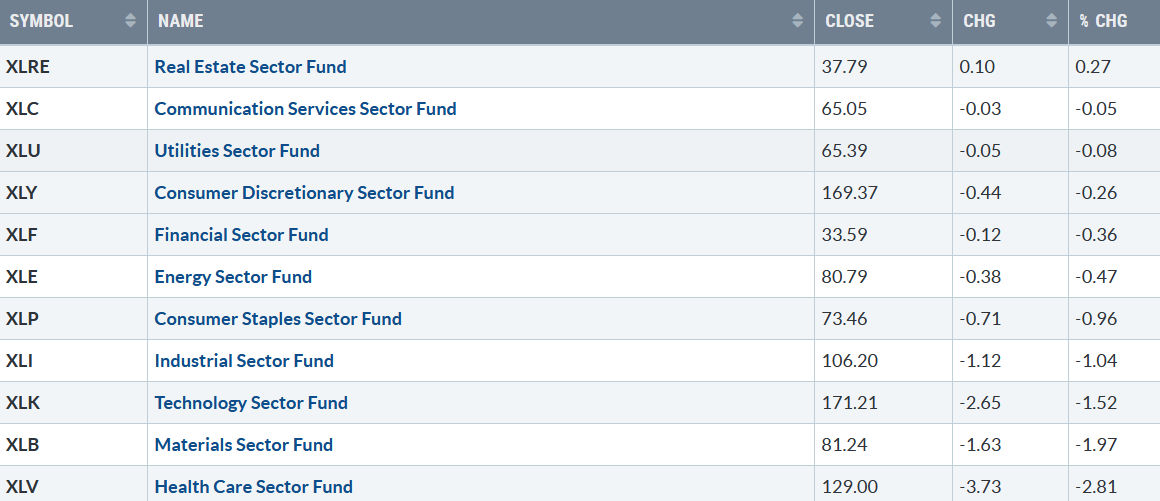
The market was volatile last week, with ten of eleven S&P SPDR sectors lower. Real Estate (XLRE) and Consumer Services (XLC) were the leading sectors, while Materials (XLB) and Health Care (XLV) were the weakest. The SPDR S&P 500 ETF Trust (SPY) was down -1.07 %.
S&P SPDR Sector ETFs Performance Summary 6/30/23-7/07/23
070723 SPDR Sectors
Source: Stockcharts.com
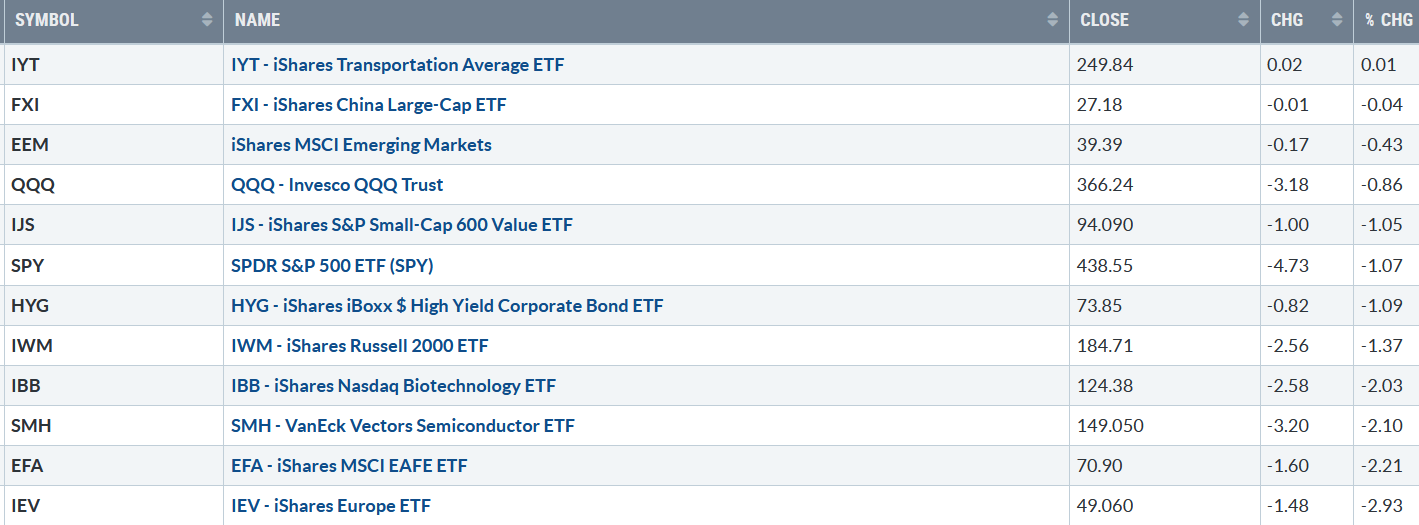
Figure 2: Bonnie’s ETFs Watch List Performance Summary 6/30/23-7/07/23
070723 Week ETFs
Source: Stockcharts.com
Transports held steady, consolidating their big gains from the previous week, while Semiconductors, Biotechnology, and Europe were weak.
Overhead Resistance Remains
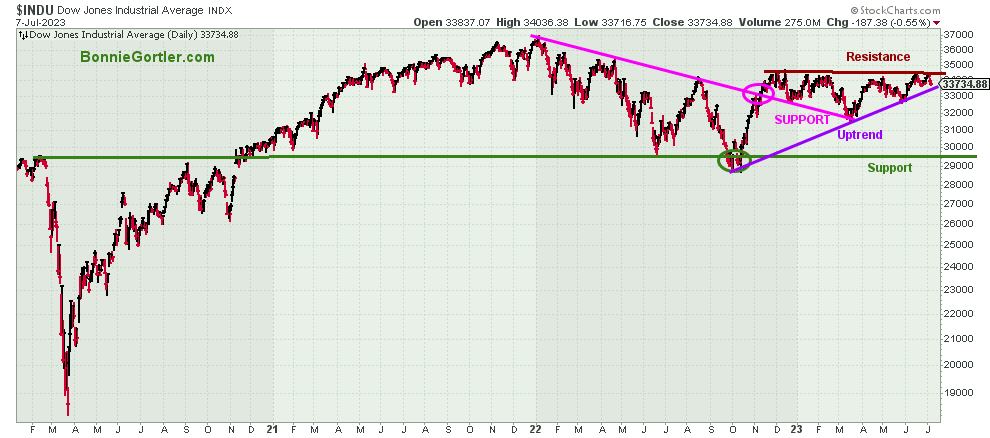
Figure 3: Dow Jones Industrial Average
 Source: Stockcharts.com
The Dow Jones Industrial Average failed to get above resistance and turned down, -1.96%, giving back the previous week’s gains, closing at 33734.88.
The October uptrend remains in effect but continues to underperform in 2023.
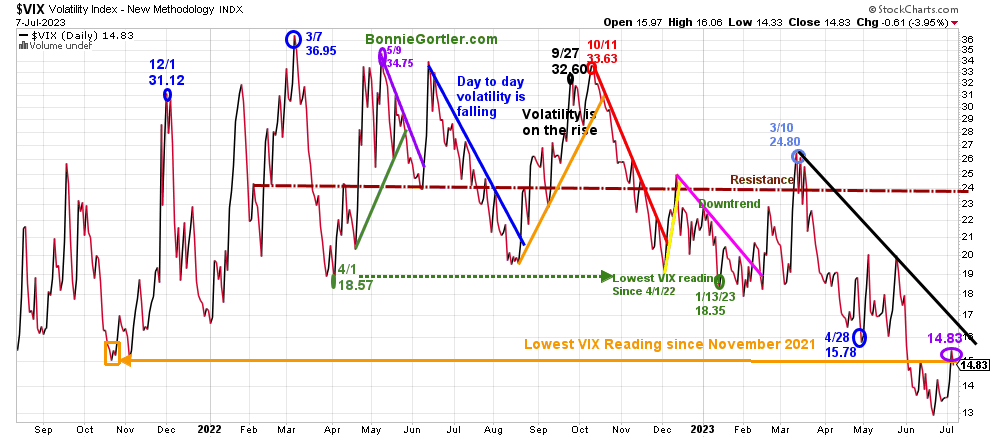
Figure 4: CBOE Volatility Index VIX
070723 VIX Daily
Source: Stockcharts.com
The CBOE Volatility Index (VIX), a measure of fear, traded above 20.00 for most of 2022, with a high at 36.95 on 3/7 (blue circle). A new VIX low did not occur until 1/13/23 at 18.35 (green circle). Volatility Index (VIX) peaked in October 2022 and has trended lower since March 2023.
VIX rose last week, closing at 14.83 (purple circle), remaining below the downtrend from March, trading near January 2020 levels. Intraday volatility will likely remain low in July and August. However, if VIX closes above 20.00 (May’s high), look for volatility to increase towards 24.00 and potentially higher.
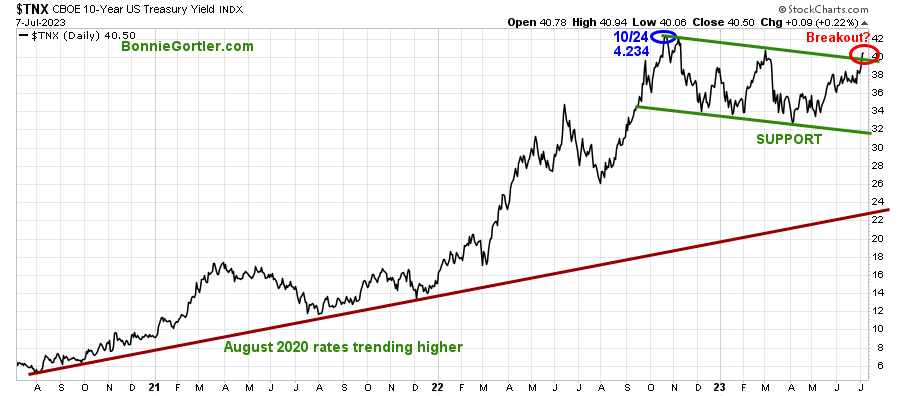
Figure 5: UST 10YR Bond Yields Daily
070723 UST 10 Yr Bond Yields Daily
Source: Stockcharts.com
The 10-Year U.S. Treasury yields jumped last week, closing above resistance at 4.050% slowing down the rally in equities. Support is 3.60% and 3.20%. Yields accelerating higher could lead to a deeper short-term correction in equities.
The major market averages all fell last week. The Dow dropped -1.90%, the largest weekly decline since March. The S&P 500 fell -1.20 %, the Nasdaq dropped -0.90%, and the Russell 2000 Index down -1.27%.
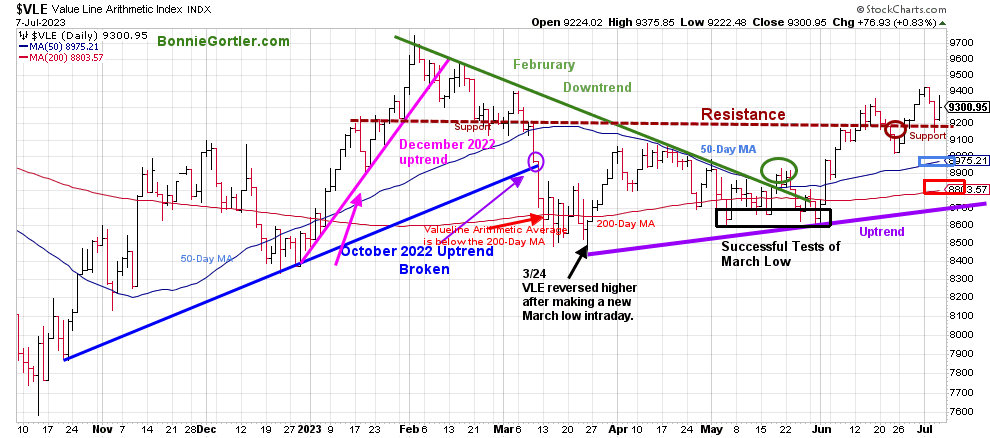
Figure 6: Value Line Arithmetic Average
070723 VLE Daily
Source: Stockcharts.com
The Value Line Arithmetic Index ($VLE) is a mix of approximately 1700 stocks. VLE broke the October 2022 uptrend in early March (blue line), reversed higher, and in April, May, and June had successful tests of the low. In July, whipsaw action so far. VLE fell -0.86% remaining above the 50-Day MA (blue rectangle) and the 200-Day MA (red rectangle), with the uptrend remaining intact from March (purple line).
Resistance is at 9500 and 9700. Support is at 9200, 8900, and 8700. Two closes below 8700 would break the uptrend and be a warning of a potential decline toward the March lows and potentially more.
Market breadth lacked strength.
Weekly market breadth was negative on the New York Stock Exchange Index (NYSE) and for the Nasdaq. The NYSE had 1189 advances and 1895 declines, with 167 new highs and 62 new lows. There were 1993 advances and 2782 declines on the Nasdaq, with 185 new highs and 229 new lows.
Its positive New Lows contracted on the NYSE and Nasdaq. However, weekly New Highs did not expand, implying fewer stocks gaining strength. Without New Lows contracting and New Highs growing, the pace of gains will slow.
Do you want to go more in-depth with charts, I invite you to join my FB group Wealth Through Market Charts.
Nasdaq breadth remains below resistance.
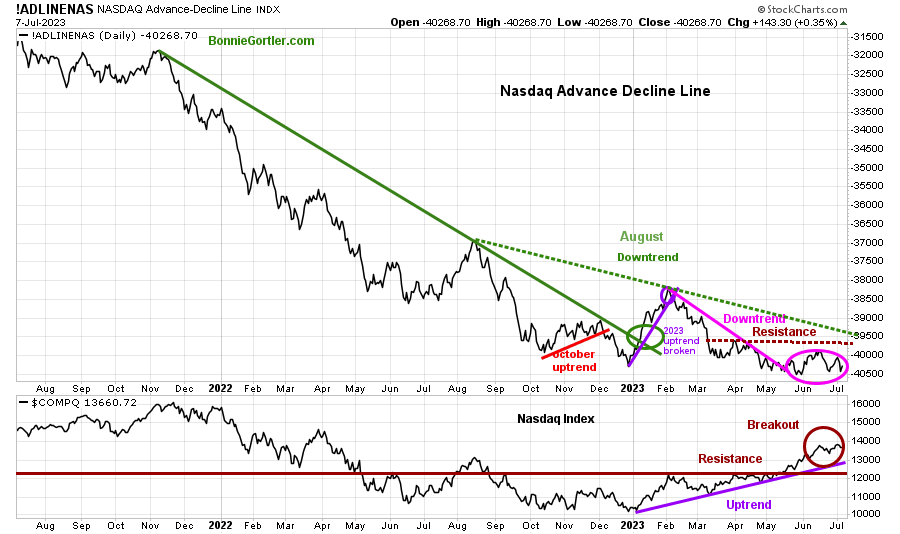
Figure 7: Nasdaq Advance Decline Line Daily (Top) and Nasdaq (Bottom)
070823 Daily Nasdaq Cumulative Advance-Decline Line
Source: Stockcharts.com
The chart is the Nasdaq Daily Advance-Decline Line, a technical indicator that plots the difference between the number of advancing and declining stocks.
In January, the October 2022 downtrend was broken (solid green line) but turned down in February 2023 as Nasdaq rose, with the large Mega Cap Stocks leading the way.
The Nasdaq AD-Line closed below resistance. To confirm more stocks will participate in the advance, the AD-Line needs to close above (brown dotted line) and then break the August downtrend (green dotted line).
Do you want to go deeper into charting? Learn more in the comfort of your home today with my Free 33-minute Training, Charting Strategies to Cut Risk and Trade with the Trend. Sign up here
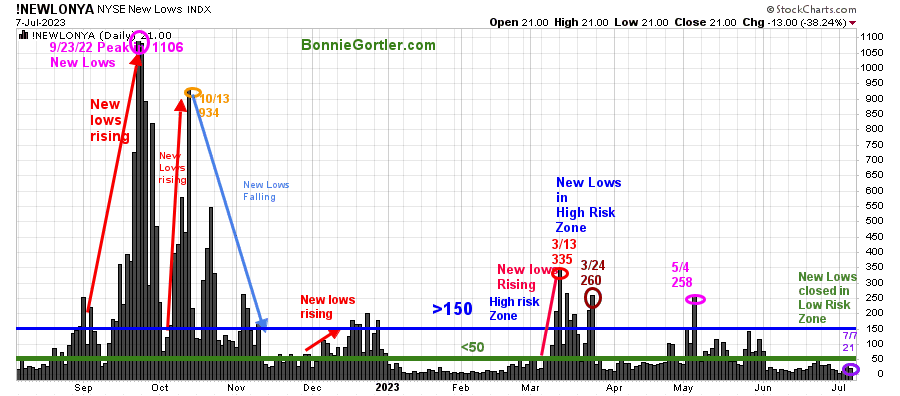
Figure 8: Daily New York Stock Exchange (NYSE) New Lows
070723 NYSE New Lows Daily
Source: Stockcharts.com
Watching New Lows on the New York Stock Exchange is a simple technical tool that helps awareness of the immediate trend’s direction. New lows warned of a potential sharp pullback, high volatility, and “panic selling” for most of 2022, closing above 150. The peak reading was 9/23/22 when New Lows made a new high of 1106 (pink circle), and New Lows expanded to their highest level in 2023 on 3/13/23 (red circle) to 335.
New Lows rose slightly last week, closing at 21 (purple circle), remaining in the lowest risk zone below 25. It would be encouraging for further gains if New Lows remained in the lowest risk zone below 25.
On the other hand, two closes above 150 New Lows would imply an increased risk of a short-term pullback.
Learn more about the significance of New Lows in my book, Journey to Wealth, published on Amazon. If you would like a preview, get a free chapter here.
Figure 9: Daily New York Stock Exchange (NYSE) New Highs
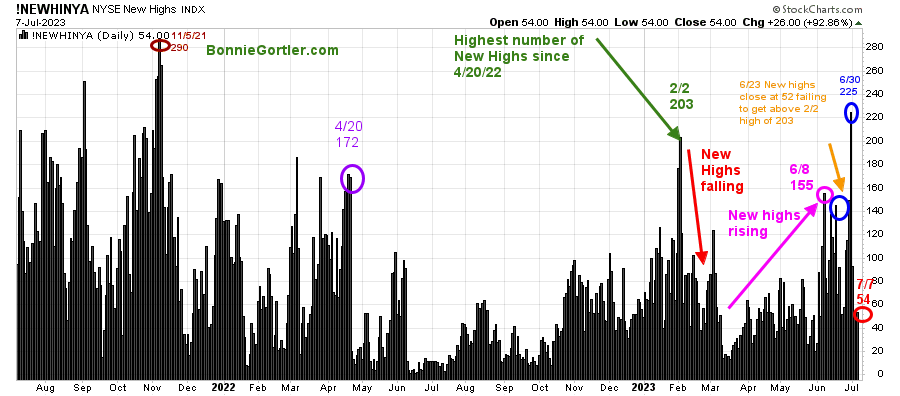
070723 NYSE New Highs Daily
Source: Stockcharts.com
New highs began to rise in early June. However, they did not reach the February high of 203 and began to fall. The previous week New Highs reached the best level of 2023 at 225, higher than 203 made on 4/20/22, but did not get above 290 made on 11/5/21, closing at 54 last week. Keep watching if New Highs expand or contract for a clue if more gains in the short term or a pullback will occur.
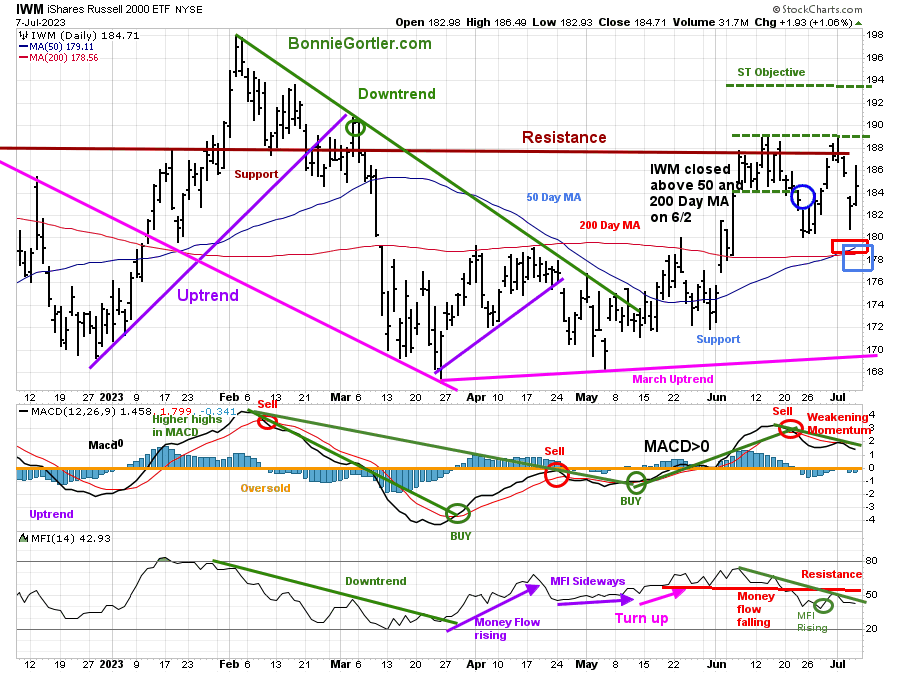
Figure 10: Daily iShares Russell 2000 (IWM) Price (Top) and 12-26-9 MACD (Middle and Money Flow (Bottom)
070723 IWM Daily
Source: Stockcharts.com
The top chart is the daily iShares Russell 2000 Index ETF (IWM), the benchmark for small-cap stocks, with a 50-Day Moving Average (MA) (blue line) and 200-Day Moving Average (MA) (red line) that traders watch and use to define trends.
IWM fell -1.37%, closing at 184.71, under key resistance at 188.00, where IWM broke down in March but above the 200-Day MA (red rectangle) and the 50-Day MA (blue rectangle).
The short-term objective remains at 193.00. Support is at 184.00, 177.00, and 169.00.
MACD (middle chart) remains on a sell, above 0, and falling. Weekly MACD (chart not shown) remains on a buy.
Money Flow (lower chart) had turned up but is now in a downtrend, closing below resistance.
In Sum:
A close above resistance at 188.00 would imply a rally towards 193.00 and potentially much higher as valuations of Small-Cap stocks are historically cheap vs. Large Cap stocks. On the other hand, a close below 177.00 would suggest a test of the March low.
Short-term momentum is weakening.
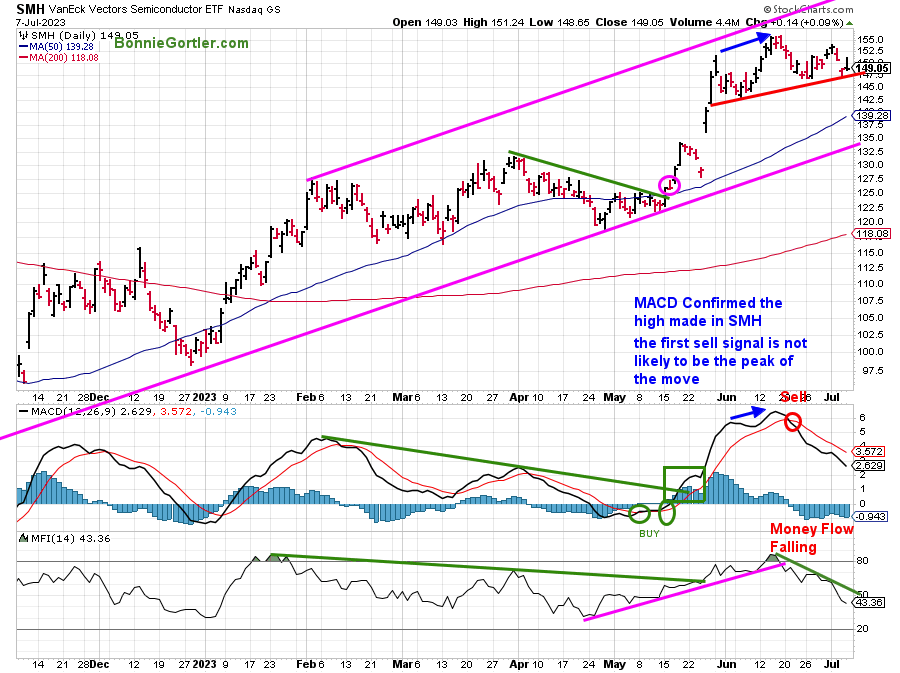
Figure 11: Daily Vaneck Vectors Semiconductors (SMH) Price (Top) and 12-26-9 MACD (Middle) and Money Flow (Bottom)
070723 SMH Daily
Source: Stockcharts.com
The top chart shows the Daily Semiconductors (SMH) ETF, concentrated mainly in US-based Mega-Cap Semiconductors companies. SMH tends to be a lead indicator for the market when investors are willing to take on increased risk and the opposite when the market is falling.
Semiconductors (SMH) were weak, down -2.10% last week, closing just above the uptrend from the end of May (red line). SMH upside objective between 160.00 and 165.00 remains possible.
MACD (middle chart) remains on a sell on falling momentum.
Money Flow (lower chart) broke its uptrend from June (pink line) and fell, now oversold below 20 or rising and above the downtrend from June (green line) above 50.
Be alert to potential weakness if SMH falls below support at 145.00, leading to further weakness towards 140.00 and 135.00.
With daily momentum patterns not as favorable, the risk has increased of the short-term pullback continuing in Semiconductors.
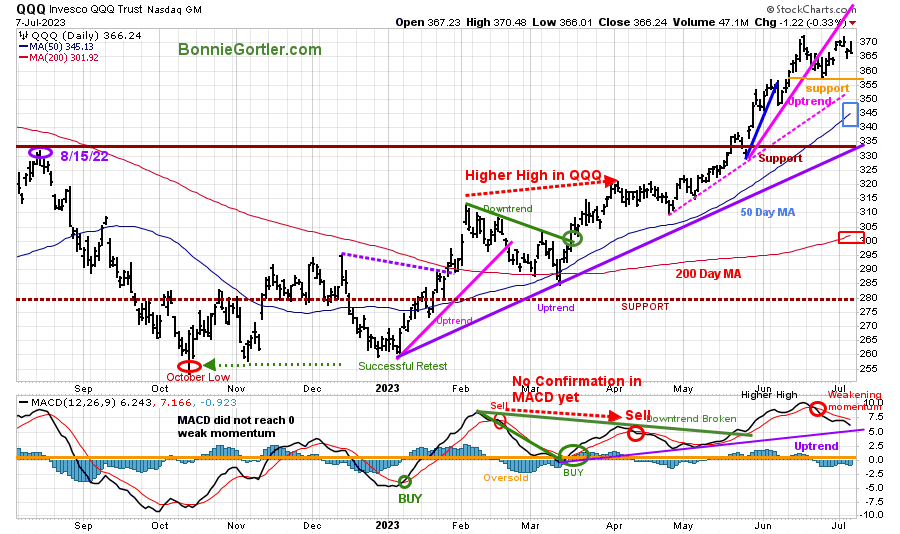
Figure 12: Daily Invesco QQQ Trust (QQQ) Price (Top) and 12-26-9 MACD (Middle) and Money Flow (Bottom)
070723 QQQ Daily
Source: Stockcharts.com
The chart shows the daily Invesco QQQ, an exchange-traded fund based on the Nasdaq 100 Index. QQQ made a low in October 2022 (red circle), followed by a successful retest of the low in early January 2023 and the start of a strong uptrend.
QQQ broke the May uptrend (pink line) but recovered quickly. QQQ did not give up much ground last week, falling only -0.86% closing at 366.24, under resistance at 370.00, above the rising 50-Day Moving Average (blue rectangle) and the 200-Day Moving Average (red rectangle).
The bottom chart is MACD (12, 26, 9), which remains on a sell, with weakening momentum.
Support is at 355.00, 345.00, 335.00. with an upside objective of 380.00.
The short and intermediate trend remains up. However, daily momentum shows clear signs of weakening, implying risk is increasing in the short term of further downside to test 355.00 support.
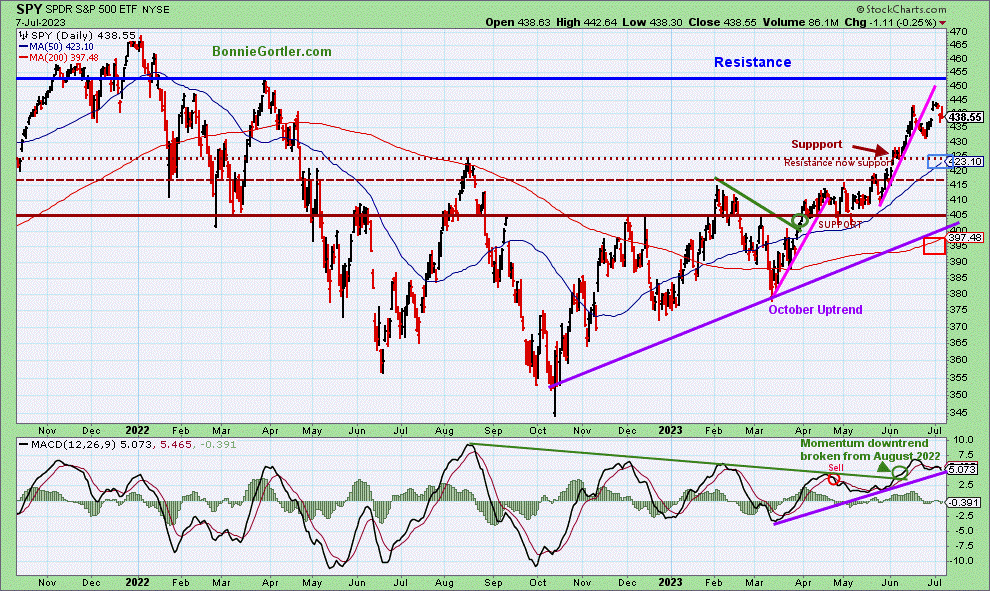
Figure 13: The S&P 500 Index (SPY) Daily (Top) and 12-26-9 MACD (Bottom)
070723 SPY Daily
Source: Stockcharts.com
The S&P 500 (SPY) remains in an uptrend since October 2022.
SPY fell -1.07%, closing at 438.55, below the previous resistance at 440.00, but above the 50-Day Moving Average (blue rectangle) and the 200-Day Moving Average (red rectangle), a sign of underlying strength.
MACD (bottom chart) remains on a sell with weakening momentum.
Resistance is 452.00 and 460.00. Support is at 425.00, 415.00, 405.00, and 395.00.
The short and intermediate trends remain up, with higher upside objectives towards 452.00 and 460.00. However, momentum has weakened, increasing the risk of a short-term pullback unless SPY closes for two days above 452.00.
Buying Opportunity in MidCaps?
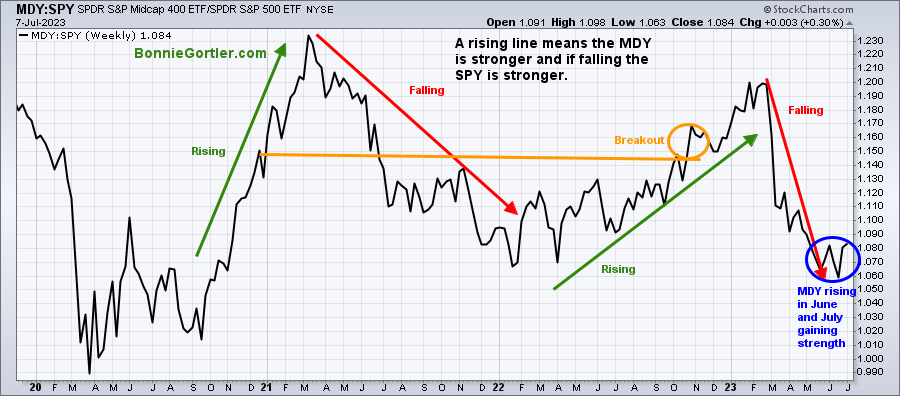
Figure 14: SPDR Midcap 400 (MDY)/ SPDR S&P 500 (SPY) Weekly Relative Strength Ratio
070723 MDY SPY Weekly Relative Strength Ratio
Source: Stockcharts.com
The top part of the chart is the weekly SPDR Midcap 400 (MDY)/ SPDR S&P 500 (SPY) Relative Strength Index Ratio (MDY/SPY). A rising line means the MDY is stronger; if falling, the SPY is stronger.
Notice MDY is rising and gaining strength in June and July.
Keep an eye out if MDY outperforms the SPY, which would be positive, or on the other hand, if MDY underperforms the SPY, which would be considered short-term negative.
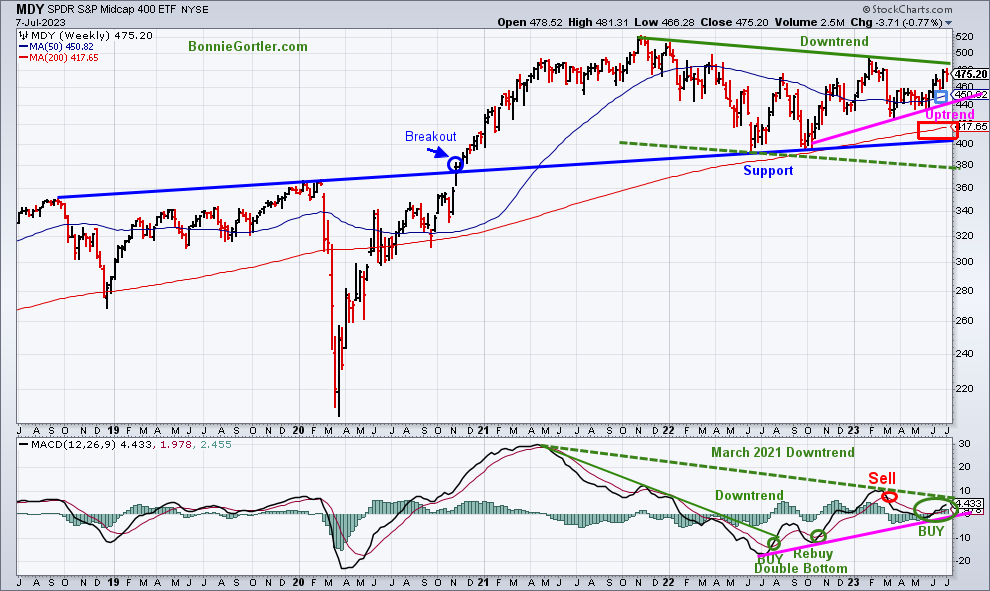
Figure 15: SPDR S&P Midcap 400 (MDY) Weekly (Top) and 12-26-9 MACD (Bottom)
070723 MDY Weekly
Source: Stockcharts.com
The top chart shows the SPDR S&P Midcap 400 (MDY in a )weekly downtrend. MDY pulled back retracing its breakout (blue circle) in 2022. In October 2023, MDY bottomed, forming an uptrend (pink line), and is now close to breaking the downtrend chart since October 2021 (green line.)
MACD (lower chart) is on a buy (green circle) and continues to rise, and is close to breaking downside momentum from March 2022. As long as the uptrend remains intact, MDY appears ready to break the downtrend and give a higher objective of 530.00 and potentially higher.
Summing Up:
The major averages pulled back last week, but no significant damage with support levels holding. The short and intermediate-price trends remain up, although daily momentum patterns are weakening. Volatility may increase with inflation data and the start of the second-quarter earnings release. As long as price support levels remain intact, with an improvement in market breadth in the near term, look for another rally attempt toward upside objectives.
Remember to manage your risk, and your wealth will grow.
Let’s talk investing. You are invited to set up your Free 30-minute Wealth and Well-Being Strategy session by clicking here or emailing me at Bonnie@BonnieGortler.com. I would love to schedule a call and connect with you.
Disclaimer: Although the information is made with a sincere effort for accuracy, it is not guaranteed that the information provided is a statement of fact. Nor can we guarantee the results of following any of the recommendations made herein. Readers are encouraged to meet with their own advisors to consider the suitability of investments for their own particular situations and for determination of their own risk levels. Past performance does not guarantee any future results.


Create more wealth in your life
with these simple strategies.
As an added bonus you will also
receive BG’s Updates and Ezine

Discover how to quickly create more well-being in your life with these simple strategies.
As an added bonus you will also
receive BG’s Updates and Ezine

As an added bonus you will receive BG’s Updates and Ezine

All work listed on BonnieGortler.com is licensed under a Creative Commons Attribution - Noncommercial - No Derivative Works 3.0 Unported License.


Free Report:
Grow and Sustain Your Wealth
Discover how to grow your money with these easy, simple steps.

