

10 Simple Tips for Financial Well-Being
07/01/2026
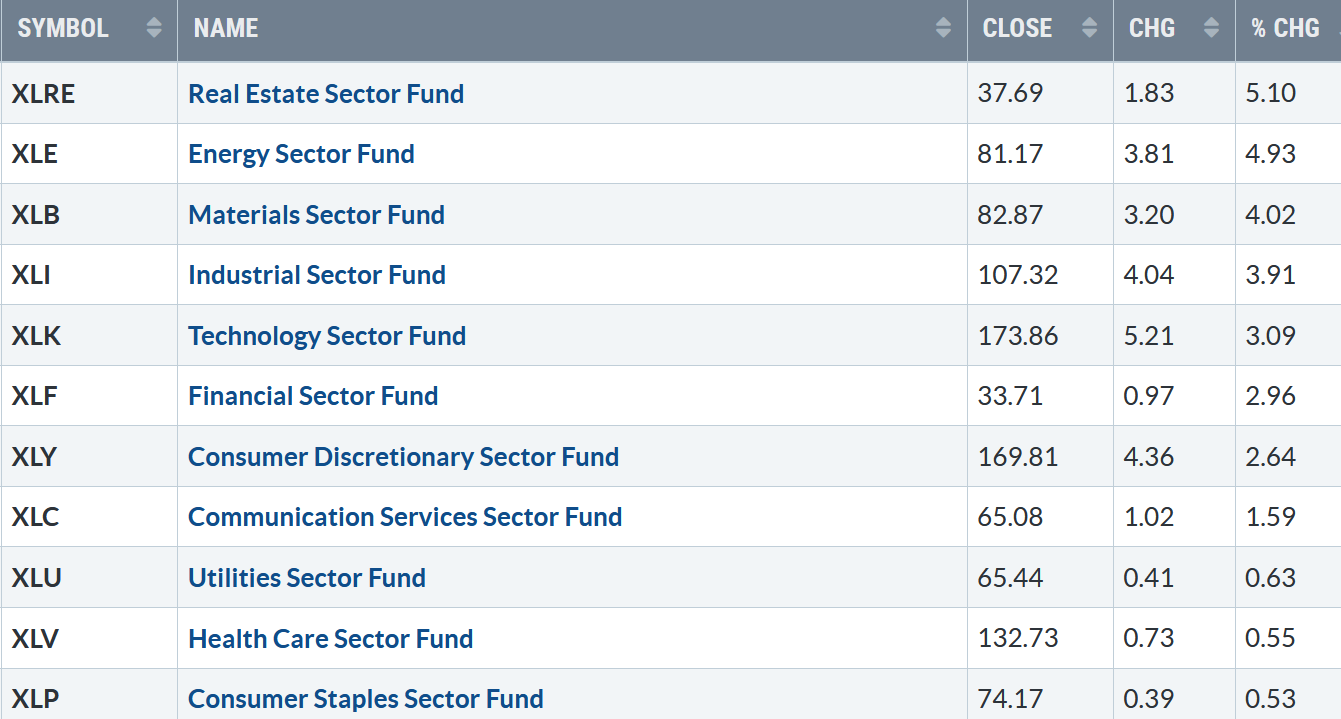
All eleven S&P SPDR sectors ended higher for the week ending the second quarter. Real Estate (XLRE) and Energy (XLE) were leaders, while Health Care (XLV) and Consumer Staples were the weakest (XLP). The SPDR S&P 500 ETF Trust (SPY) was up +2.32%.
S&P SPDR Sector ETFs Performance Summary 6/23/23-6/30/23
063023 SPDR Sectors
Source: Stockcharts.com
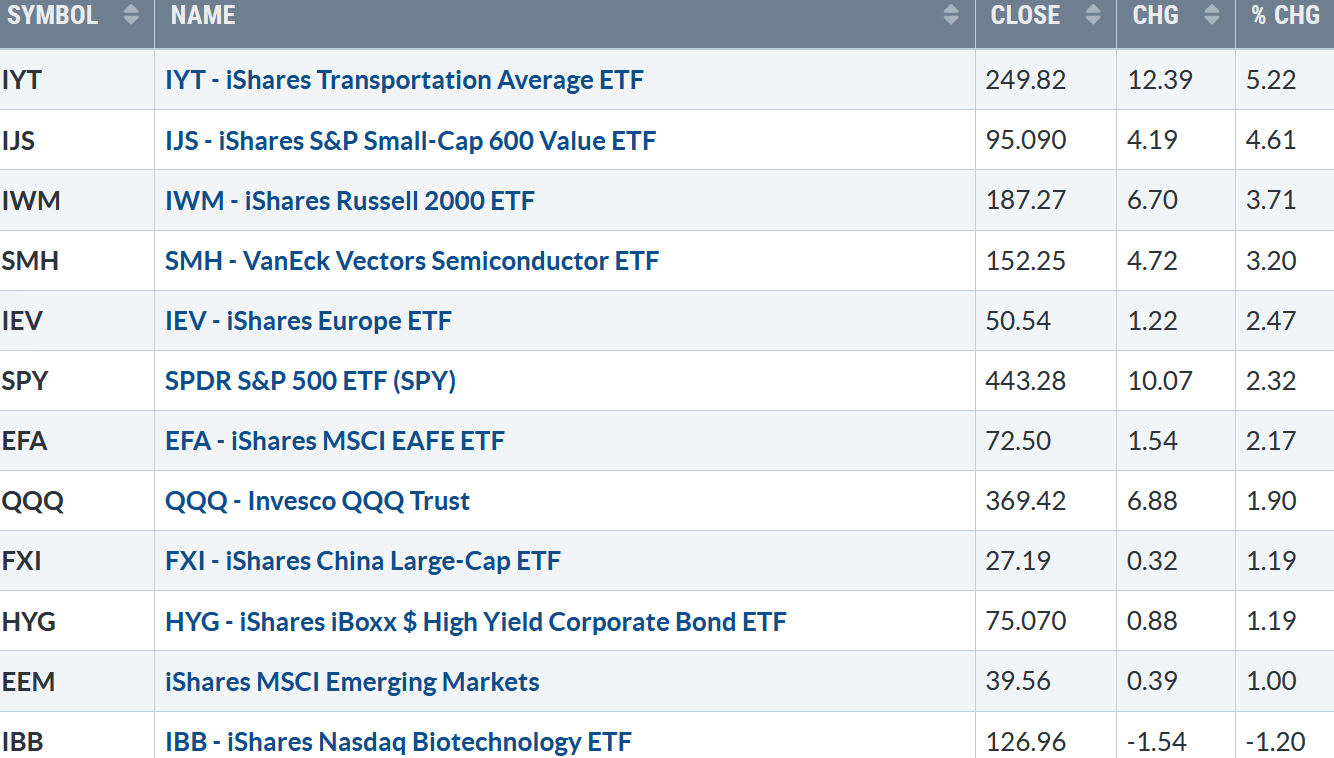
Figure 2: Bonnie’s ETFs Watch List Performance Summary 6/23/23-6/30/23
063023 Week ETFs
Source: Stockcharts.com
Transports, Small Cap Value, and Small Cap Growth and Semiconductors led the market higher while Biotechnology lagged.
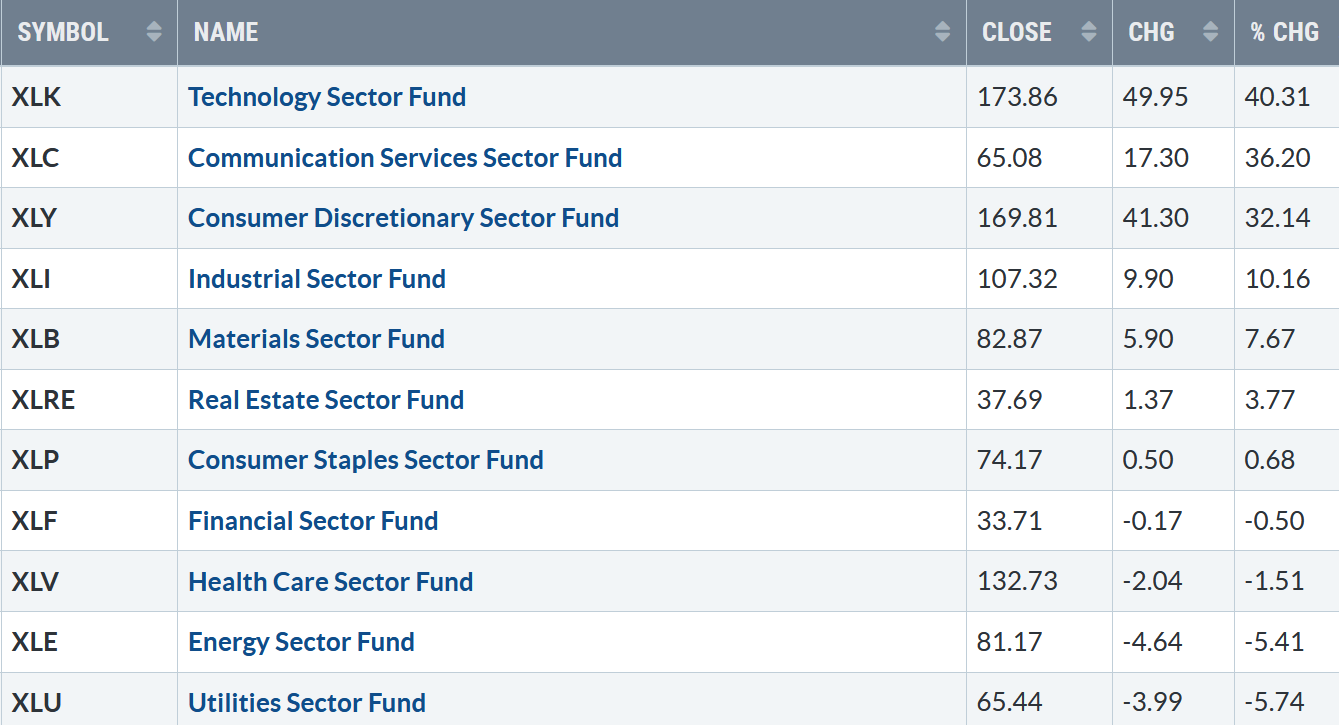
Figure 3: S&P SPDR Sector ETFs January – June Performance Summary 2023
063023 YTD SPDR Sectors Performance
Source: Stockcharts.com
Technology, Communication Services, and Consumer Discretionary were the strongest sectors for the year, while Financials, Healthcare, Energy, and Utilities were the weakest. Be alert for a potential shift from the leading sectors to the underperforming sectors as the year progresses.
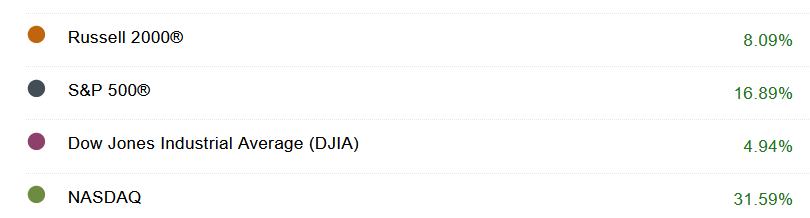
Figure 4: Market Indices January – June Performance Summary 2023
063023 YTD Performance Indices l
Source: Schwab YTD 2023 Performance
All indices were up in 2023, with the Nasdaq and S&P 500 leading the way. Nasdaq had its best first six months performance since 1983.
Figure 5: iShares Transportation Average (IYT) Price (Top) and 12-26-9 MACD (Bottom)
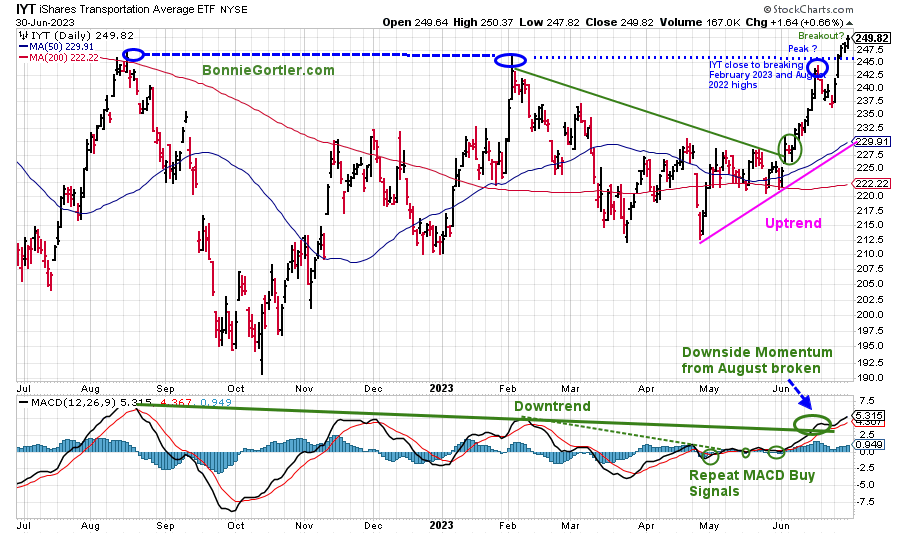
Source: Stockcharts.com
The Transportation Average (IYT) broke out in early June (green circle) after consolidating in May and June near the 50-Day and 200-Day Moving Averages, gaining strength but stalling under the August 2022 and February 2023 highs.
The IYT April uptrend remains in effect. IYT gained +5.22% last week, led by the airline stocks, to exceed the 2022 and 2023 peaks (blue circles).
MACD (bottom chart) remains on a buy gaining strength after the momentum downtrend from August 2022 broke (green line).
Based on Dow Theory, Transports and the Dow Jones Industrials rising together is positive. If IYT remains the market leader as it was last week, it tends to lead to continued strength in the overall market.
Overhead Resistance Remains
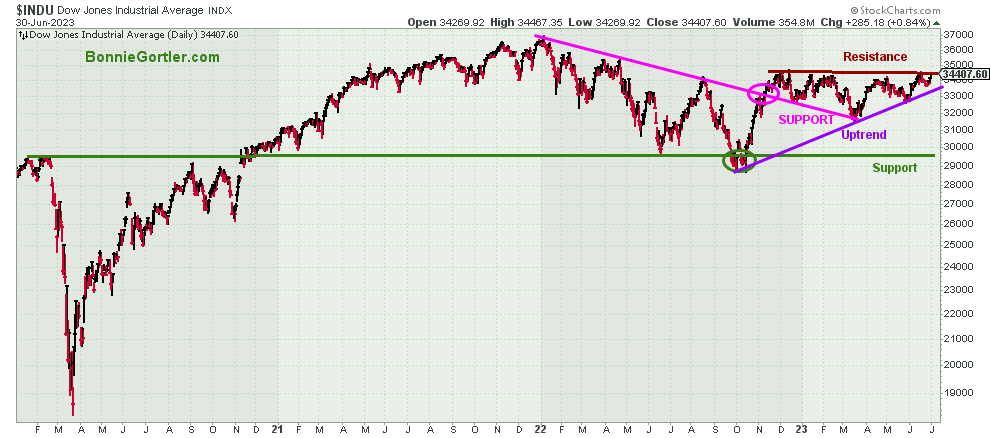
Figure 6: Dow Jones Industrial Average
063023 Dow Jones Industrial Daily
Source: Stockcharts.com
The Dow Jones Industrial Average was strong, gaining +2.02%, closing at 34407.60, close to breaking out.
The October uptrend remains in effect. Dow stocks have underperformed in 2023. However, the recent tape action is improving, a potential buying opportunity when the Dow closes above resistance, and investors begin rotating out of Technology.
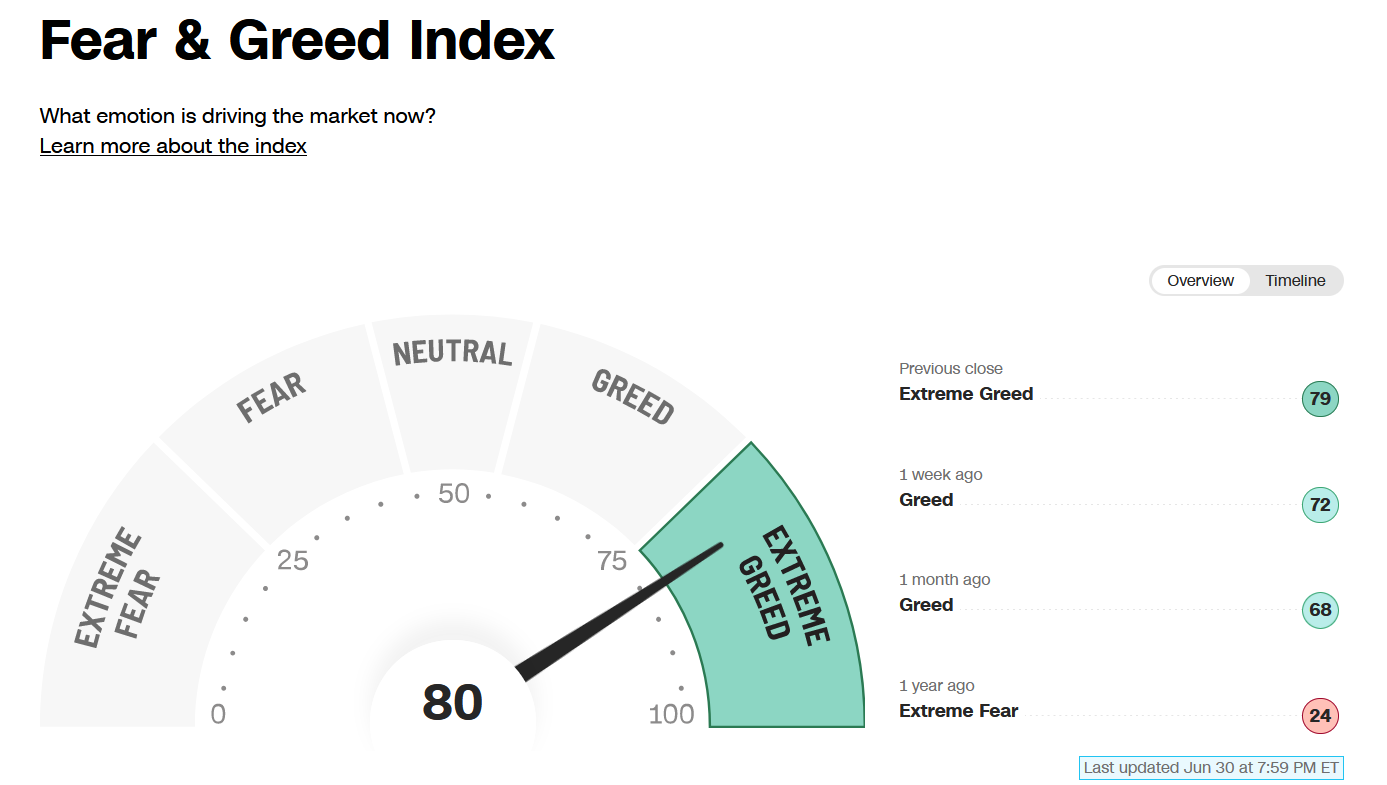
Figure 7: Fear & Greed Index
063023 Fear and Greed Index
Source: Stockcharts.com
Investor sentiment based on the Fear and Greed Index (a contrarian index) measures the market’s mood, which rose from Greed at 74 to Extreme Greed at 80 last week, which is bears watching as risk is increasing of a short-term pullback.
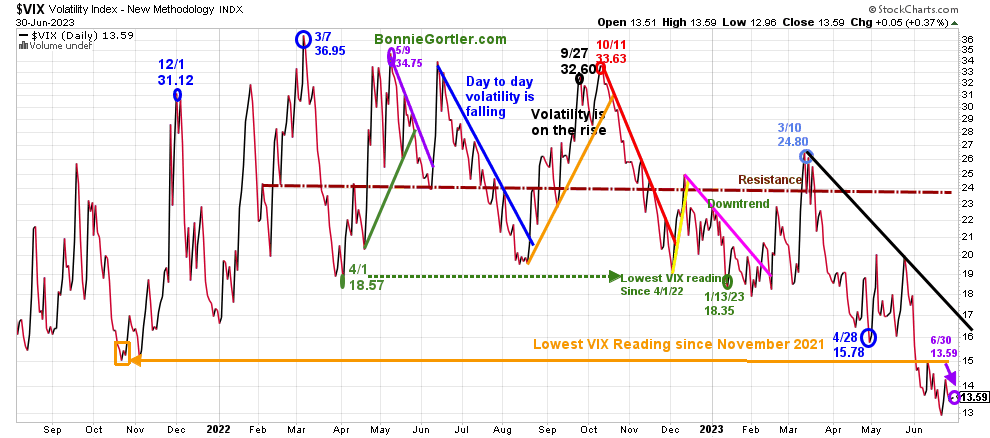
Figure 8: CBOE Volatility Index VIX
063023 VIX Daily
Source: Stockcharts.com
The CBOE Volatility Index (VIX), a measure of fear, traded above 20.00 for most of 2022, with a high at 36.95 on 3/7 (blue circle). A new VIX low did not occur until 1/13/23 at 18.35 (green circle). Volatility Index (VIX) peaked in October 2022 and has trended lower since March 2023.
VIX rose slightly last week, closing at 13.59 (purple circle), trading near January 2020 levels. Intraday volatility will likely remain low as we move into July and August. However, if VIX closes above 20.00, look for volatility to increase towards 24.00 and potentially higher.
Figure 9: UST 10YR Bond Yields Daily
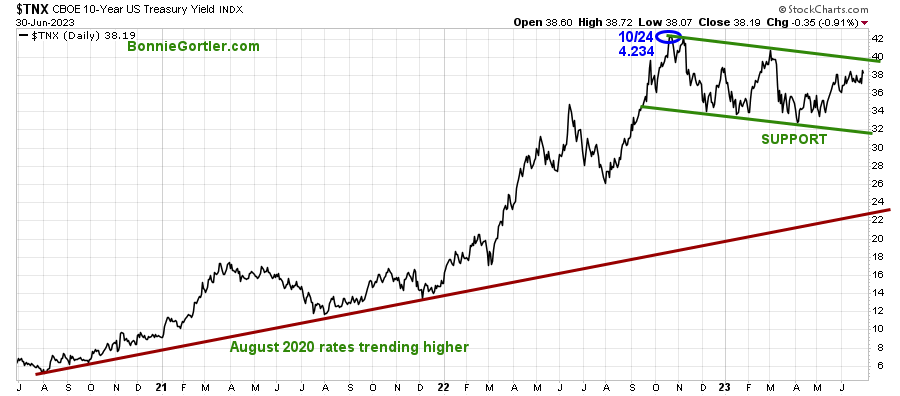
063023 UST 10 Yr Bond Yields Daily
Source: Stockcharts.com
The 10-Year U.S. Treasury yields rose last week, closing at 3.819%. Support remains at 3.20%, with resistance at 4.00%. Yields rising above 4.00% could quickly damper the recent rally.
The major market averages were higher last week. The Dow and S&P 500 had their third positive quarter in a row. The Dow rose +2.02%, the S&P 500 gained +2.35%, up five of the previous six weeks, and the Nasdaq gained +3.36%, up nine of its last ten weeks. The Russell 2000 Index was up the most, gaining +3.68%.
Do you want to go deeper into charting?
Learn more today in the comfort of your home with my Free 33-minute Training, Charting Strategies to Cut Risk and Trade with the Trend. Sign up here
Figure 10: Value Line Arithmetic Average
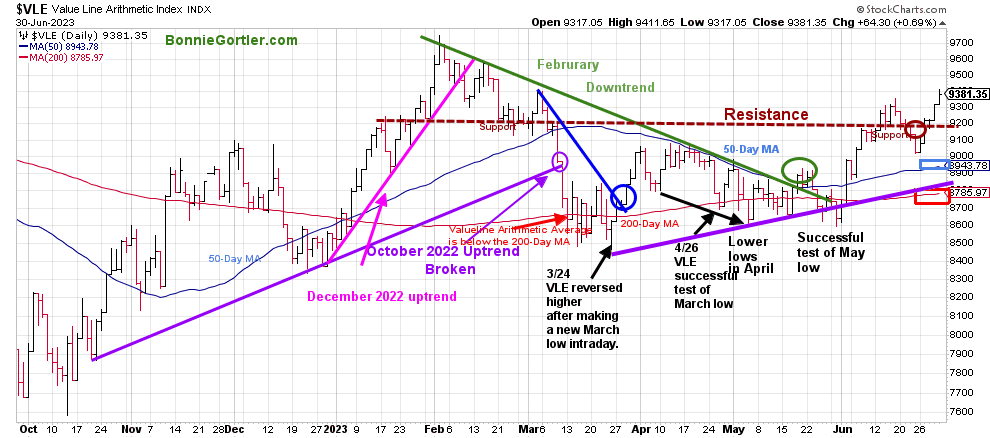
063023 VLE Daily
Source: Stockcharts.com
The Value Line Arithmetic Index ($VLE) is a mix of approximately 1700 stocks. VLE broke the October 2022 uptrend in early March, headed lower, and on 3/24, bottomed and reversed higher. In April and May, there were successful tests of the low.
After penetrating key resistance at 9200 and no follow-through in early June, VLE ended June strong taking out the June highs, gaining +3.92% as the rally broadened last week. Its positive VLE remains above the 50-Day MA (blue rectangle) and the 200-Day MA (red rectangle), with the uptrend remaining intact from March (purple line).
Resistance is at 9500 and 9700. Support is at 9200, 8900, and 8750. A close below 8750 would break the uptrend and be a warning of a potential decline toward the March lows.
Market breadth strengthed
Weekly market breadth was positive on the New York Stock Exchange Index (NYSE) and for the Nasdaq. The NYSE had 2487 advances and 637 declines, with 293 new highs and 94 new lows. There were 2958 advances and 1916 declines on the Nasdaq, with 307 new highs and 365 new lows.
Weekly New Lows contracting with New Highs expanding would be favorable. On the other hand, weakening market breadth with an increase in New Lows and fewer New highs on the Nasdaq and NYSE would be negative.
Do you want to go more in-depth with charts, I invite you to join my FB group Wealth Through Market Charts.
Figure 11: NYSE Cumulative Advance-Decline Line and New York Stock Exchange Index (Below)
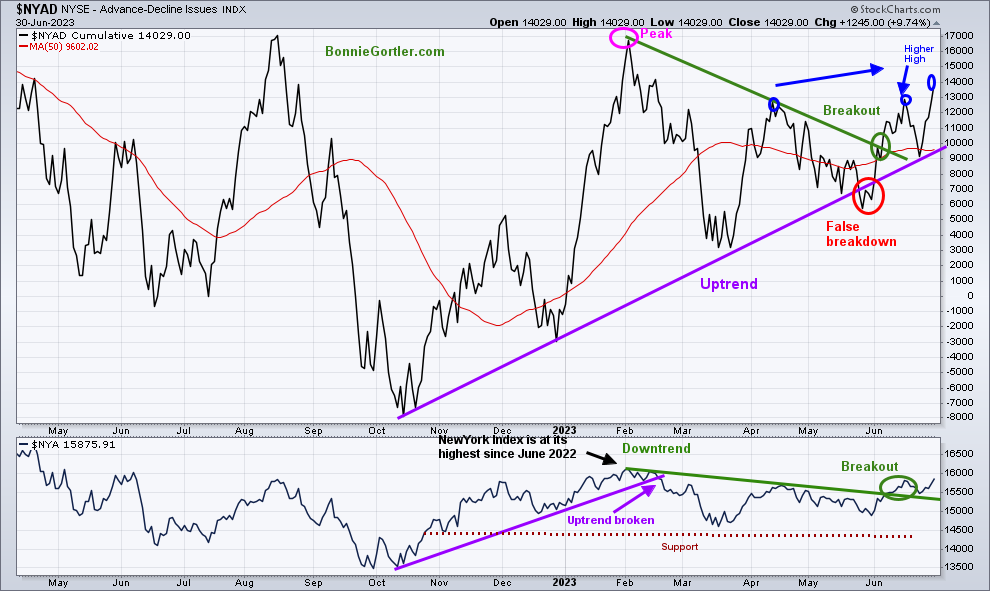
06303 Daily NYSE Cumulative Advance-Decline Line and NYSE
Source: Stockcharts.com
The top chart is the Cumulative Advance-Decline Line (AD Line) of the NYSE, a breadth indicator based on the number of advancing stocks minus the number of declining stocks. The NYSE AD Line peaked in February 2023 (pink circle top chart) and weakened through March.
The uptrend in the NYSE Advance-Decline Line (top chart) from October (purple line) had a false breakdown (red circle) in May. However, breadth improved in June, breaking the AD-Line’s downtrend from February (green line), initially not taking out February’s highs (pink circle). However, the AD line made a higher high penetrating April and early June highs (blue circles) last week. It appears a successful test of the breakout has occurred.
The New York Index (lower chart) has confirmed the AD line breakout of the downtrend (green line) and retraced the breakout, now rising again, implying more room to the upside is likely.
Let’s talk investing. You are invited to set up your Free 30-minute Wealth and Well-Being Strategy session by clicking here or emailing me at Bonnie@BonnieGortler.com. I would love to schedule a call and connect with you.
Nasdaq breadth remains below resistance.
Figure 12: Nasdaq Advance Decline Line Daily (Top) and Nasdaq (Bottom)
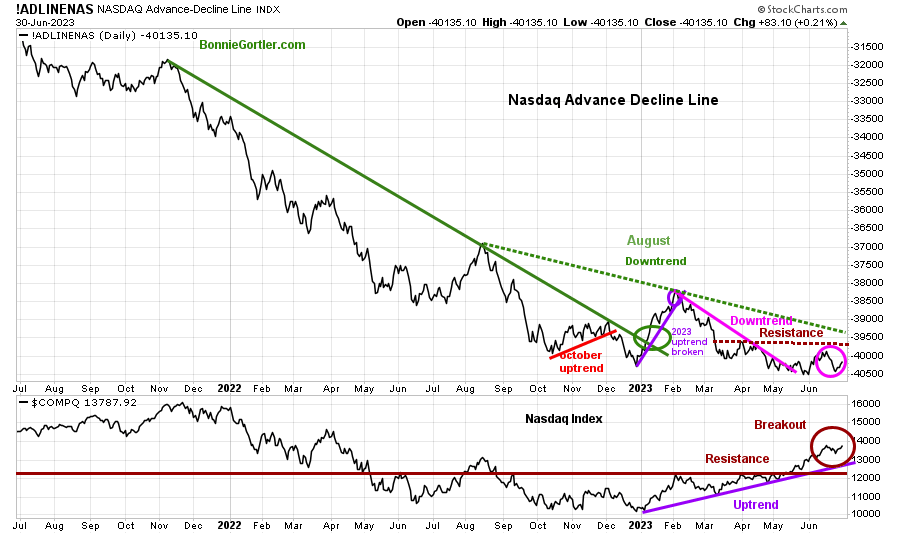
063023 Daily Nasdaq Cumulative Advance-Decline Line and Nasdaq
Source: Stockcharts.com
The chart is the Nasdaq Daily Advance-Decline Line, a technical indicator that plots the difference between the number of advancing and declining stocks.
In January, the October 2022 downtrend was broken (solid green line). However, the improvement in the market breadth was short-lived, with the Nasdaq Advance-Decline line deteriorating in February 2023.
Nasdaq rose, and the AD-Line turned up last week but remained below resistance. To confirm more stocks will participate in the advance, the AD-Line needs to get through resistance (brown dotted line) and then breaks the August downtrend (green dotted line).
Learn more about charting in my free Masterclass, Charting Strategies to Cut Risk and Trade with the Trend. Sign up here.
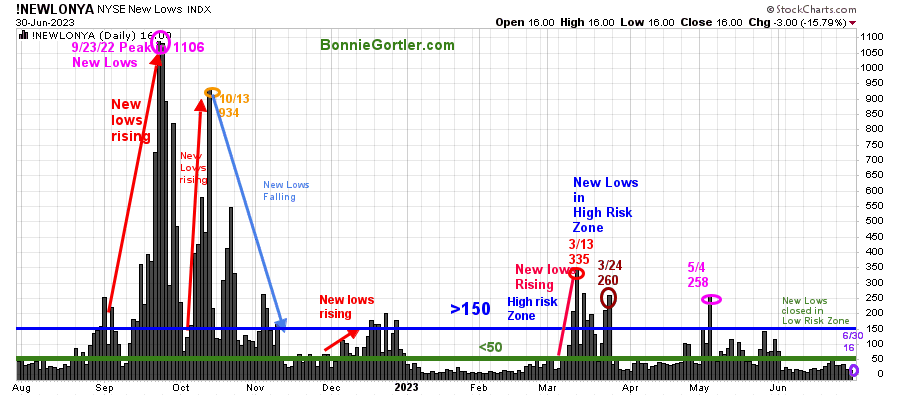
Figure 13: Daily New York Stock Exchange (NYSE) New Lows
063023 NYSE New Lows Daily
Source: Stockcharts.com
Watching New Lows on the New York Stock Exchange is a simple technical tool that helps awareness of the immediate trend’s direction. New lows warned of a potential sharp pullback, high volatility, and “panic selling” for most of 2022, closing above 150. The peak reading was 9/23/22 when New Lows made a new high of 1106 (pink circle), and New Lows expanded to their highest level in 2023 on 3/13/23 (red circle) to 335.
New Lows fell week, closing at 16 (purple circle), and fell to the lowest-risk zone below 25. It would be positive if New Lows remained in the lowest risk zone below 25.
On the other hand, two closes above 150 New Lows would imply an increased risk of a short-term pullback.
Learn more about the significance of New Lows in my book, Journey to Wealth, published on Amazon. If you would like a preview, get a free chapter here.
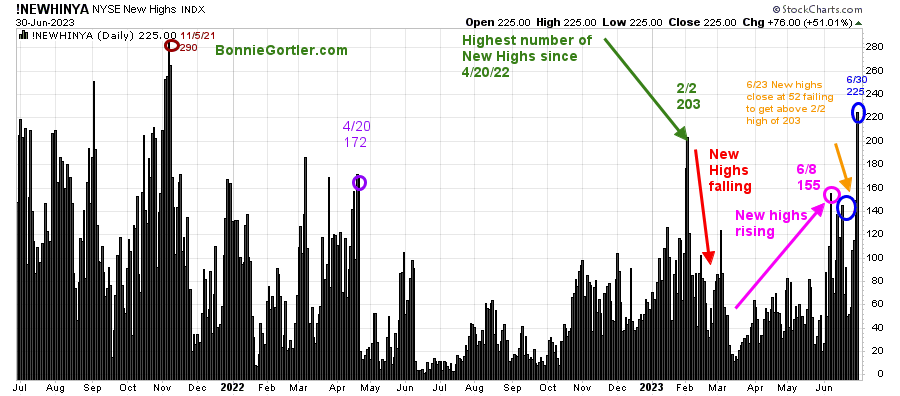
Figure 14: Daily New York Stock Exchange (NYSE) New Highs
63023 NYSE New Highs Daily
Source: Stockcharts.com
New highs began to rise in early June. However, during the rally, they did not reach the February high of 203 and began to fall. Last week New Highs closed at the best level of 2023 at 225, higher than 203 made on 4/20/22. It would be positive to see an increase of New Highs to more than 290 made on 11/5/21 and continue to expand.
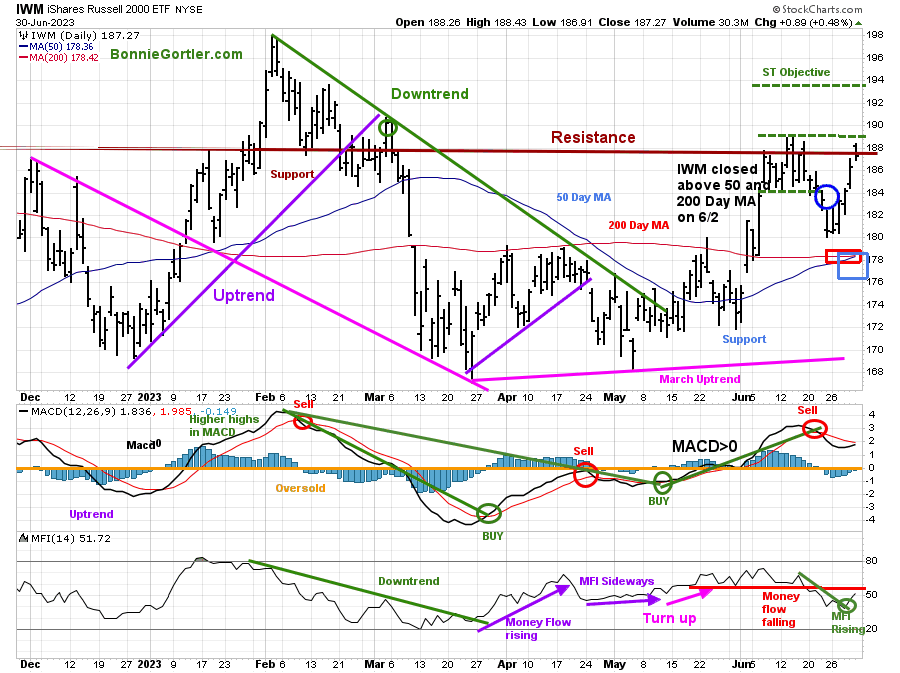
Figure 15: Daily iShares Russell 2000 (IWM) Price (Top) and 12-26-9 MACD (Middle and Money Flow (Bottom)
063023 IWM Daily
Source: Stockcharts.com
The top chart is the daily iShares Russell 2000 Index ETF (IWM), the benchmark for small-cap stocks, with a 50-Day Moving Average (MA) (blue line) and 200-Day Moving Average (MA) (red line) that traders watch and use to define trends.
IWM outperformed the major averages last week, up +3.71%, closing at 187.27, above the previous resistance at 184.00, and slightly under key resistance at 188.00. IWM remains above the 200-Day MA (red rectangle) and the 50-Day MA (blue rectangle).
Key resistance is at 188.00, where IWM broke down in March. IWM’s short-term objective remains at 193.00. Support is at 184.00, 177.00, and 169.00.
MACD (middle chart) remains on a sell, above 0, and rising. Weekly MACD (chart not shown) remains on a buy.
Money Flow (lower chart) has turned up and closed above 50, which is encouraging.
In Sum:
IWM acted better in early June, then weakened but was strong last week. A close above resistance at 188.00 would imply a rally towards 193.00, potentially much higher as valuations of Small-Cap stocks are historically cheap vs. Large Cap stocks. On the other hand, a close below 177.00 would suggest a test of the March low.
Short-term momentum is weakening.
063023 SMH Daily
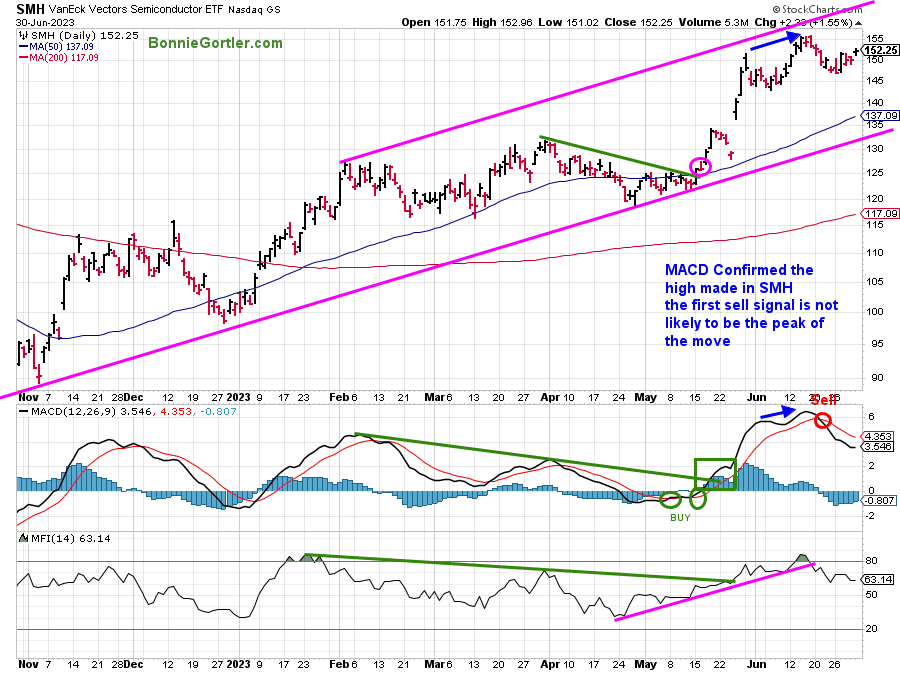
Figure 16: Daily Vaneck Vectors Semiconductors (SMH) Price (Top) and 12-26-9 MACD (Middle) and Money Flow (Bottom)
Source: Stockcharts.com
The top chart shows the Daily Semiconductors (SMH) ETF, concentrated mainly in US-based Mega-Cap Semiconductors companies. SMH tends to be a lead indicator for the market when investors are willing to take on increased risk and the opposite when the market is falling.
Semiconductors (SMH) were up +3.20% last week, but momentum has waned as SMH has consolidated since its sharp gains.
MACD (middle chart) remains on a sell.
Money Flow (lower chart) broke its uptrend From June (pink line) and now hovering above 50.
SMH’s first upside objective at 155.00 was hit. With the channel slope rising and the 50 and 200-Day MA rising, it was no surprise SMH rallied last week with the upside objective of 160 still possible. Be alert to potential weakness if SMH falls below support at 145.00, which could lead to further weakness towards 140.00, 135.00, and 130.00.
With daily momentum patterns not as favorable, the risk has increased of a short-term pullback.
Figure 17: Daily Invesco QQQ Trust (QQQ) Price (Top) and 12-26-9 MACD (Middle) and Money Flow (Bottom)
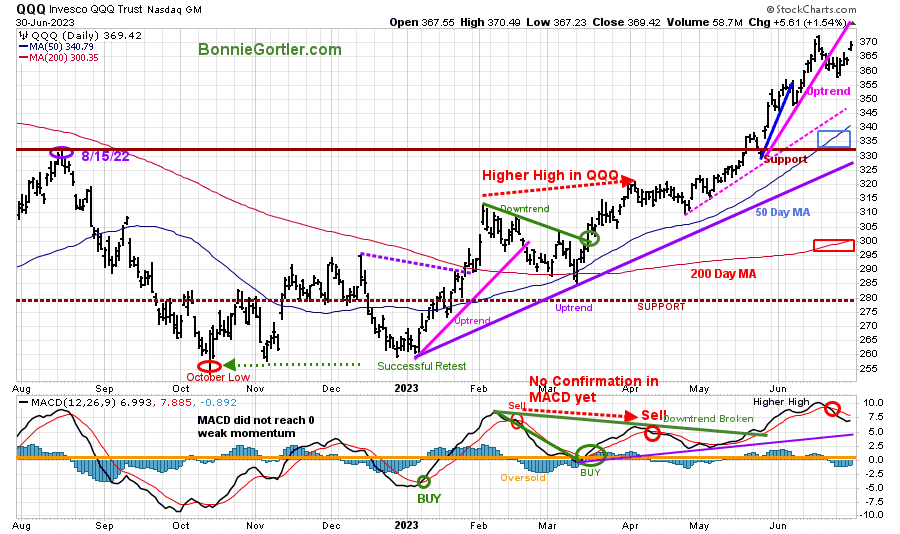
063023 QQQ Daily
Source: Stockcharts.com
The chart shows the daily Invesco QQQ, an exchange-traded fund based on the Nasdaq 100 Index. QQQ made a low in October 2022 (red circle), followed by a successful retest of the low in early January 2023 and the start of a strong uptrend.
QQQ broke the May uptrend (pink line) but recovered quickly to gain +1.90% last week, closing at 369.42, slightly under resistance at 370.00. QQQ remains above the rising 50-Day Moving Average (blue rectangle) and the 200-Day Moving Average (red rectangle).
The bottom chart is MACD (12, 26, 9), a measure of momentum remains on a sell. After MACD confirmed the QQQ high, momentum is weakening despite last week’s gains.
Support is at 360.00, 340.00, 335.00. with an upside objective of 380.00.
The short and intermediate trend remains up. However, momentum shows clear signs of weakening, implying risk is increasing in the short term.
Figure 18: The S&P 500 Index (SPY) Daily (Top) and 12-26-9 MACD (Bottom)
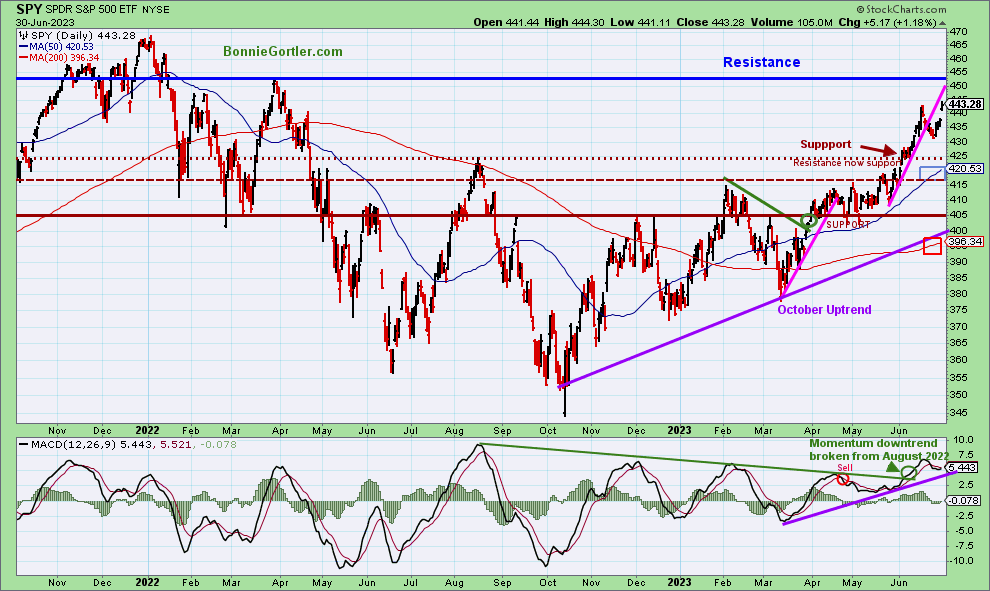
063023 SPY Daily
Source: Stockcharts.com
The S&P 500 (SPY) remains in an uptrend since October 2022.
SPY rose +2.32%, closing at 443.28, above resistance at 440.00, and above the 50-Day Moving Average (blue rectangle) and the 200-Day Moving Average (red rectangle), a sign of underlying strength.
MACD (bottom chart) remains on a sell with weakening momentum.
Resistance is 452.00 and 460.00. Support is at 440.00, 425.00, 415.00, 405.00, and 395.00.
SPY rebounded after ending its winning streak the previous week. The short and intermediate trends remain up, with higher upside objectives towards 452.00 and 460.00. However, momentum has weakened, increasing the risk of a pullback if the rally falters.
Summing Up:
The Nasdaq led the advance with its best first 6-month performance since 1983. Market breadth improved as the rally broadened to more sectors other than Technology last week. Short and intermediate price trends remain up, but daily momentum patterns are not as favorable, showing clear signs of weakening, implying the risk of a pullback is increasing. Be alert for a potential change in leadership, a shift from Technology, Semiconductors, and Consumer Discretionary stocks that have had substantial gains in 2023 to the underperforming sectors in the second half of the year as the year progresses.
Remember to manage your risk, and your wealth will grow.
Let’s talk investing. You are invited to set up your Free 30-minute Wealth and Well-Being Strategy session by clicking here or emailing me at Bonnie@BonnieGortler.com. I would love to schedule a call and connect with you.
Disclaimer: Although the information is made with a sincere effort for accuracy, it is not guaranteed that the information provided is a statement of fact. Nor can we guarantee the results of following any of the recommendations made herein. Readers are encouraged to meet with their own advisors to consider the suitability of investments for their own particular situations and for determination of their own risk levels. Past performance does not guarantee any future results.


Create more wealth in your life
with these simple strategies.
As an added bonus you will also
receive BG’s Updates and Ezine

Discover how to quickly create more well-being in your life with these simple strategies.
As an added bonus you will also
receive BG’s Updates and Ezine

As an added bonus you will receive BG’s Updates and Ezine

All work listed on BonnieGortler.com is licensed under a Creative Commons Attribution - Noncommercial - No Derivative Works 3.0 Unported License.


Free Report:
Grow and Sustain Your Wealth
Discover how to grow your money with these easy, simple steps.

