

10 Simple Tips for Financial Well-Being
07/01/2026
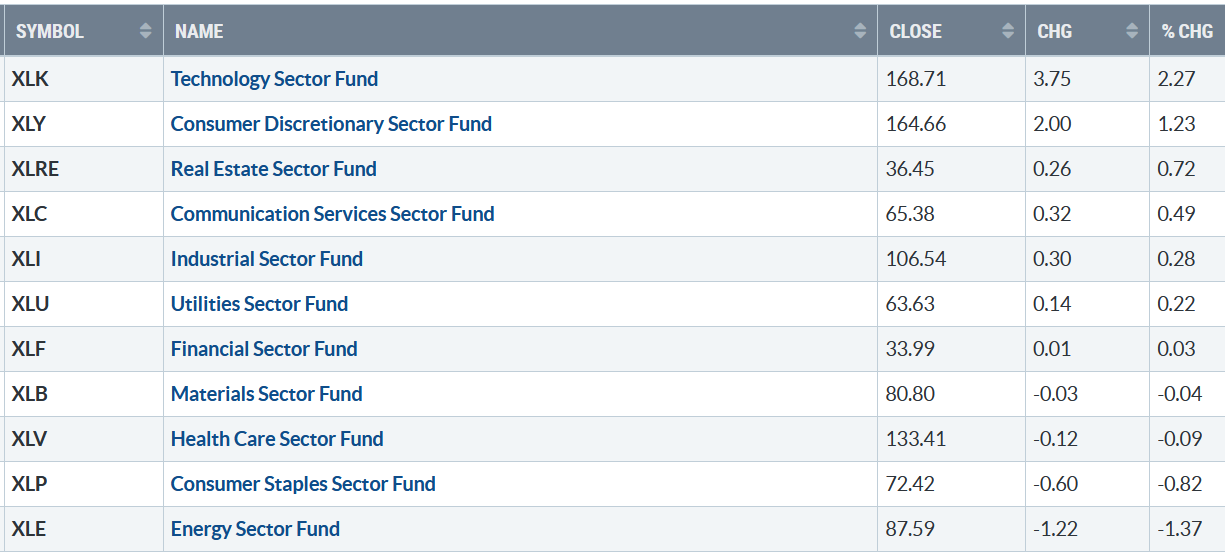
The market had increased volatility last week, with seven of eleven S&P SPDR sectors finishing higher. Technology (XLK) and Consumer Discretionary (XLY) were the leading sectors, while Consumer Staples (XLP) and Energy (XLE) were the weakest. The SPDR S&P 500 ETF Trust (SPY) was up +0.79%.
S&P SPDR Sector ETFs Performance Summary 8/18/23-8/25/23
082523 SPDR Sectors
Source: Stockcharts.com
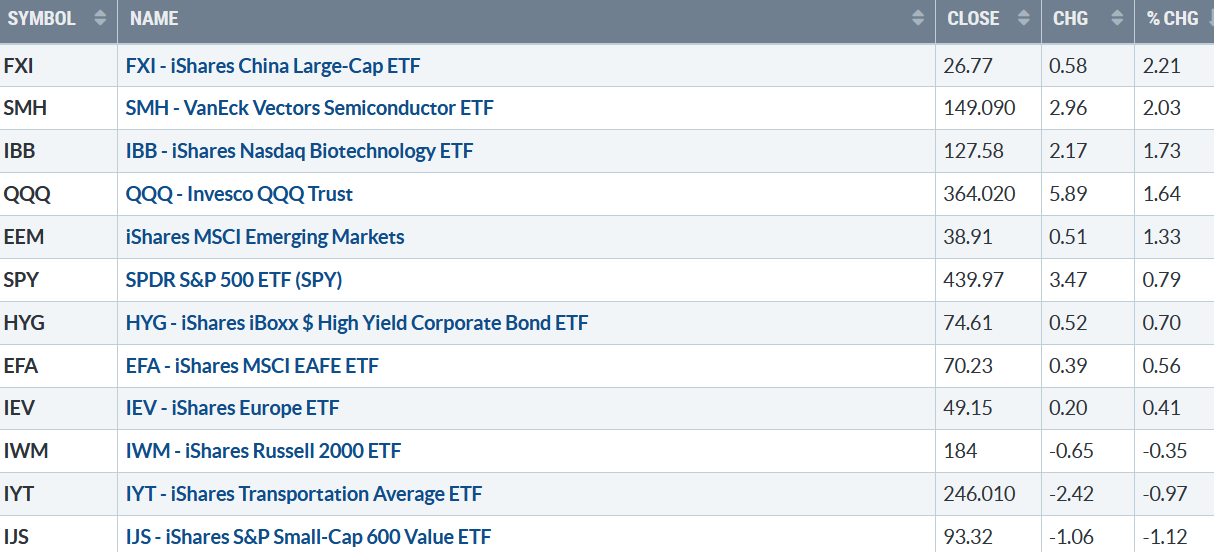
Figure 2: Bonnie’s ETFs Watch List Performance Summary 8/18/23-8/25/23
082523 Week ETFs
Source: Stockcharts.com
China, Semiconductors, and Biotechnology were leaders, while Transports, Small Cap Value, and Growth were laggards.
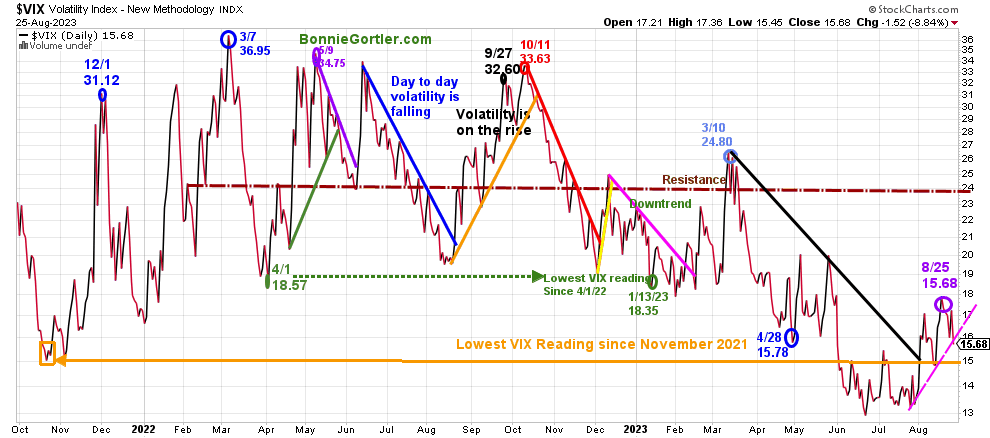
Figure 3: CBOE Volatility Index VIX
08253 VIX Daily
Source: Stockcharts.com
The CBOE Volatility Index (VIX), a measure of fear, traded above 20.00 for most of 2022, with a high at 36.95 on 3/7 (blue circle). A new VIX low did not occur until 1/13/23 at 18.35 (green circle) after peaking in October 2022 at 33.63 (red circle).
VIX stopped rising and declined last week, closing at 15.68 (purple circle). A close below 15.00 would break the uptrend from July (pink line), which would be positive, while a close above 20.00 would imply higher intraday day volatility in the short term.
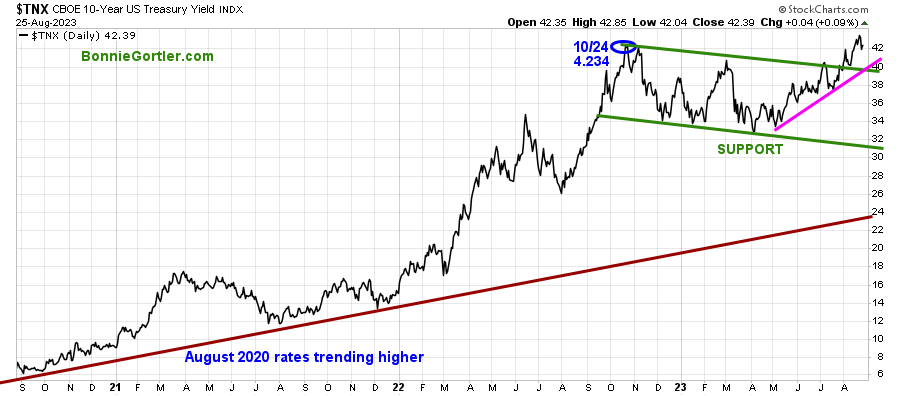
Figure 4: UST 10YR Bond Yields Daily
082523 UST 10 Yr Bond Yields Daily
Source: Stockcharts.com
The 10-year U.S. Treasury yields have been trending higher, fell last week, closing above the channel at 4.239%. Support is 4.00.%. A close above 4.50% would likely lead to an extension of the recent short-term correction in equities. However, rates declining below the May uptrend (pink line)below 3.80% towards 3.60% would be positive for equities.
Last week, the major market averages were mixed. The Dow dropped -0.45%, S&P 500 rose +0.82 %, the Nasdaq gained +2.26%, the strongest market average, while the Russell 2000 Index fell slightly -0.31%.
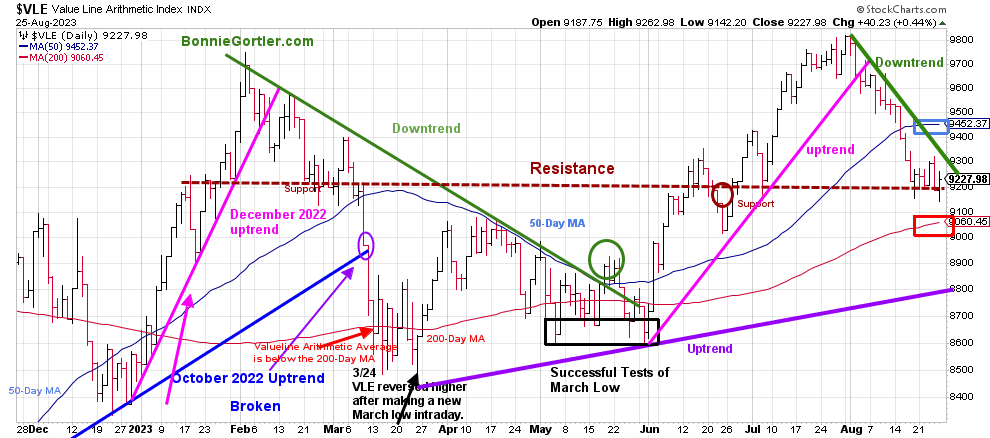
Figure 5: Value Line Arithmetic Average
082523 VLE Daily
Source: Stockcharts.com
The Value Line Arithmetic Index ($VLE) is a mix of approximately 1700 stocks. VLE broke the October 2022 uptrend in early March (blue line), reversed higher, and in April, May, and June had successful tests of the low.
VLE short-term downtrend from July remains in effect. VLE fell -0.25%, remaining below the 50-day MA (blue rectangle), a sign of underlying weakness. However, VLE closed above the 200-day MA (red rectangle), with the uptrend remaining intact from March (purple line).
Resistance is at 9300, 9500, and 9700. Support is at 9100 and 8800. Two closes below 8800 would break the March uptrend and be a warning of a potential decline toward the March lows and potentially more.
Do you want to go deeper into charting? Learn more in the comfort of your home today with my Free 33-minute Training, Charting Strategies to Cut Risk and Trade with the Trend. Sign up here
Weekly market breadth was negative on the New York Stock Exchange Index (NYSE) and for the Nasdaq. The NYSE had 1464 advances and 1584declines, with 105 new highs and 195 new lows. There were 2216 advances and 2588 declines on the Nasdaq, with 158 new highs and 551 new lows.
It’s a negative sign and more of a challenge to make money with were more New Lows than New Highs on the NYSE, implying fewer stocks are gaining strength. Without New Lows contracting and New Highs, increasing gains going forward will be contained.
If you want to go more in-depth with charts, I invite you to join my FB group Wealth Through Market Charts.
Nasdaq breadth remains troublesome.
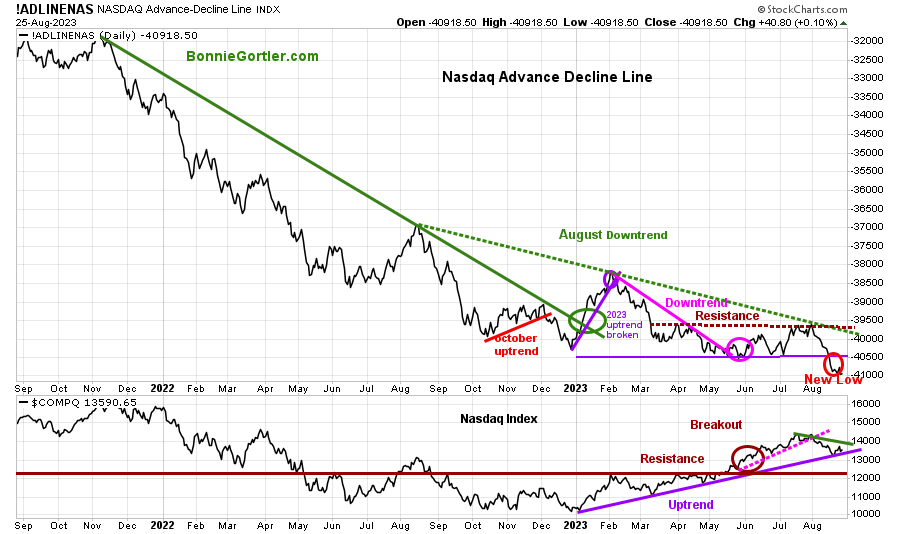
Figure 6: Nasdaq Advance Decline Line Daily (Top) and Nasdaq (Bottom)
0825823 Daily Nasdaq Cumulative Advance-Decline Line
Source: Stockcharts.com
The top chart is the Nasdaq Daily Advance-Decline Line, a technical indicator that plots the difference between the number of advancing and declining stocks. In January 2023, the October 2022 downtrend was broken (solid green line) but quickly reversed lower in February 2023, when most of the stock participation was the large Mega Cap Stocks.
The Nasdaq Index (bottom chart) rose early in 2023, leading the way, but failed to get above the August downtrend (green dotted line), and in August, the AD-Line broke support (purple dotted line) and made a new low.
Nasdaq (lower chart) remains in a short-term downward trend from July, but for now, the 2023 uptrend remains in effect, which is positive. Time will tell if the price uptrend can hold or it will break down, joining the Nasdaq Advance Decline Line.
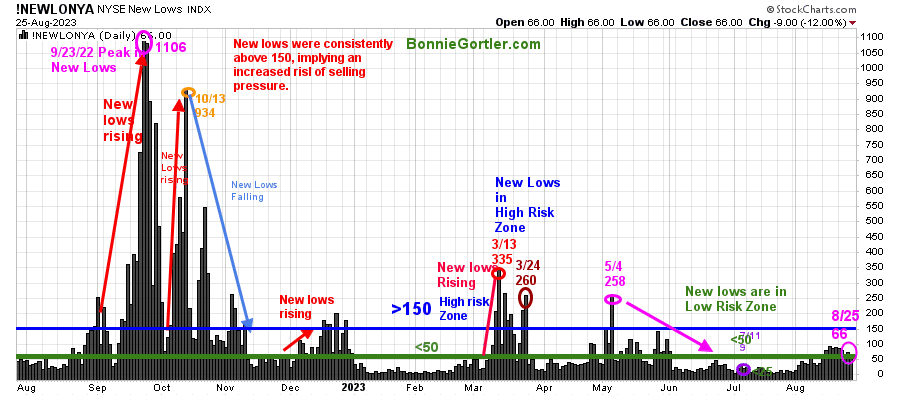
Figure 7: Daily New York Stock Exchange (NYSE) New Lows
082523 NYSE New Lows Daily
Source: Stockcharts.com
Watching New Lows on the New York Stock Exchange is a simple technical tool that helps awareness of the immediate trend’s direction. New lows warned of a potential sharp pullback, high volatility, and “panic selling” for most of 2022, closing above 150. The peak reading was 9/23/22 when New Lows made a new high of 1106 (pink circle), and New Lows expanded to their highest level in 2023 on 3/13/23 (red circle) to 335.
New Lows are rising, closing at 62 (purple circle), in a low-risk zone for now. It would be encouraging for a short-term rally to be sustainable if New Lows fell to the lowest risk zone below 25.
On the other hand, two closes above 150 New Lows would imply an increased risk of downside pressure in equities that could accelerate.
Learn more about the significance of New Lows in my book, Journey to Wealth, published on Amazon. If you would like a preview, get a free chapter here.
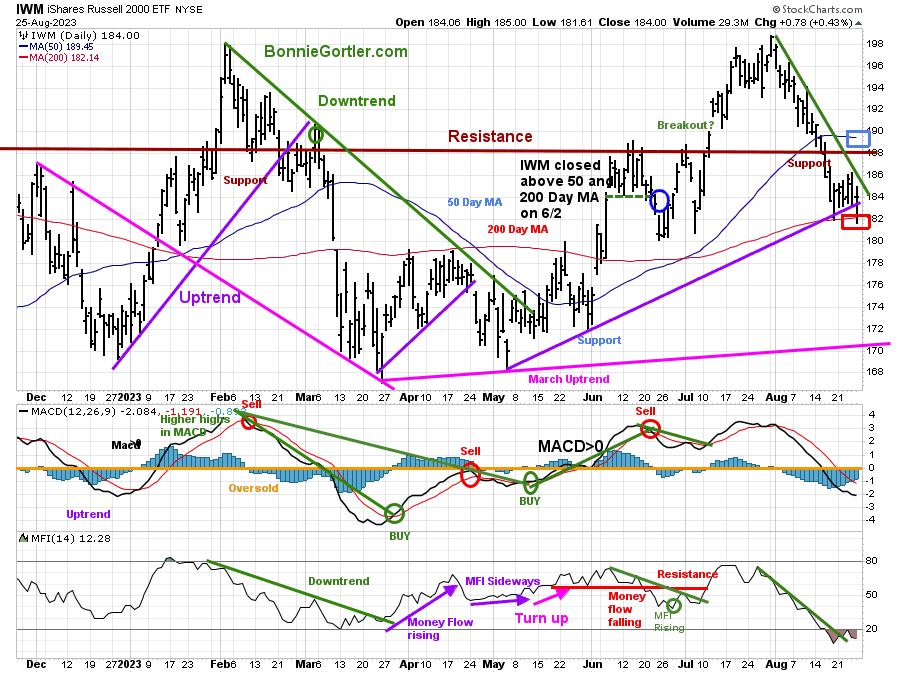
Figure 8: Daily iShares Russell 2000 (IWM) Price (Top) and 12-26-9 MACD (Middle and Money Flow (Bottom)
082523 IWM Daily
Source: Stockcharts.com
The top chart is the daily iShares Russell 2000 Index ETF (IWM), the benchmark for small-cap stocks, with a 50-Day Moving Average (MA) (blue line) and 200-Day Moving Average (MA) (red line) that traders watch and use to define trends.
IWM fell -0.35%, closing at 184.00, remaining below the 50-Day MA (blue rectangle) and below key resistance at 188.00, where IWM broke down in March. IWM recovered after falling below the 200-Day MA (red rectangle) to close above.
Support is at 182.00, 177.00, and 171.00.
MACD (middle chart) remains on a sell, below 0, and falling.
Money Flow (lower chart) trended down since July, but it’s positive it has turned up from an oversold condition, implying money is starting to flow into small caps. Time will tell if money will continue flowing into Small Caps and start new short-term buying as valuations of Small-Cap stocks are historically cheap vs. Large Cap stocks.
Short-term downside momentum is waning.
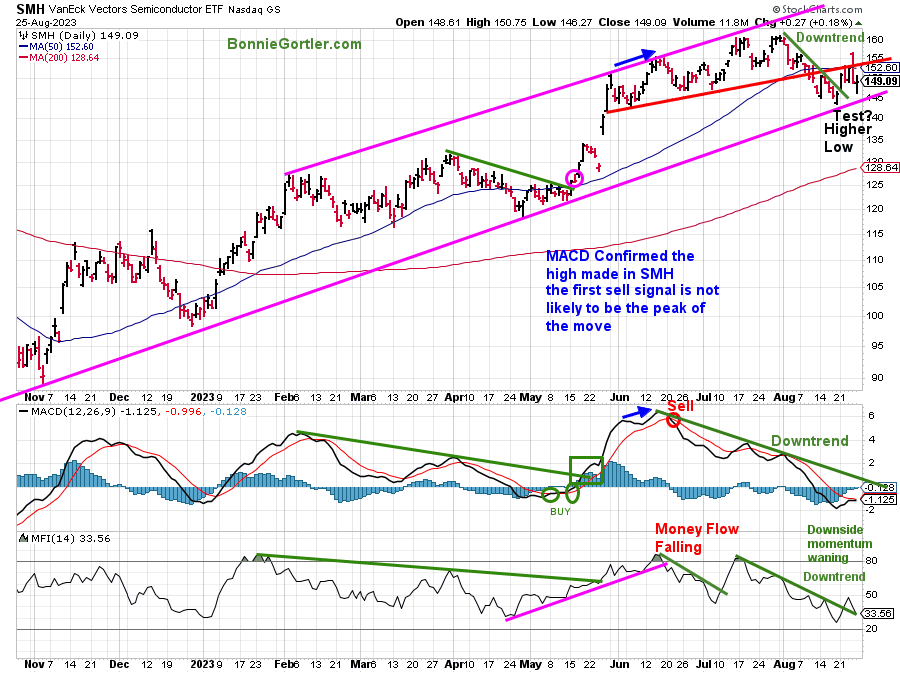
Figure 9: Daily Vaneck Vectors Semiconductors (SMH) Price (Top) and 12-26-9 MACD (Middle) and Money Flow (Bottom)
082523 SMH Daily
Source: Stockcharts.com
The top chart shows the Daily Semiconductors (SMH) ETF, concentrated mainly in US-based Mega-Cap Semiconductors companies. SMH tends to be a lead indicator for the market when investors are willing to take on increased risk and the opposite when the market is falling.
Semiconductors (SMH)showed strength last week, up +2.03%, remaining in an uptrend from November 2022 (bottom pink line). Support is at 140.00, and resistance is at 156.00 and 160.00.
MACD (middle chart) remains on a sell but will likely give a fresh buy signal on any near-term strength.
Money Flow (lower chart) broke its uptrend from July (green line) but is falling a gain. A turn-up above 50 would be favorable.
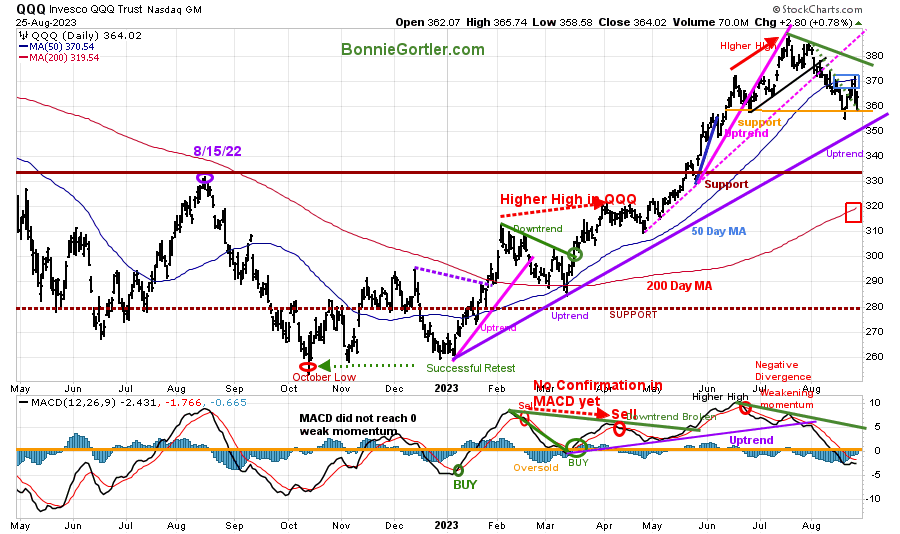
Figure 10: Daily Invesco QQQ Trust (QQQ) Price (Top) and 12-26-9 MACD (Middle) and Money Flow (Bottom)
082523 QQQ Daily
Source: Stockcharts.com
The chart shows the daily Invesco QQQ, an exchange-traded fund based on the Nasdaq 100 Index. QQQ made a low in October 2022 (red circle), followed by a successful retest of the low in early January 2023 and the start of a strong uptrend.
QQQ remains in an uptrend for 2023 but has trended down since July’s peak. QQQ rose last week up +1.64%, closing under resistance at 370.00, at 364.02, and below the 50-Day Moving Average (blue rectangle) but above the 200-Day Moving Average (red rectangle).
The bottom chart is MACD (12, 26, 9), which remains on a sell but is now in a favorable position to generate a buy.
Support is at 350.00 and 335.00. with resistance at 380.00 and 390.00.
Downside momentum is no longer accelerating, implying that the recent decline is likely ending sooner rather than later.
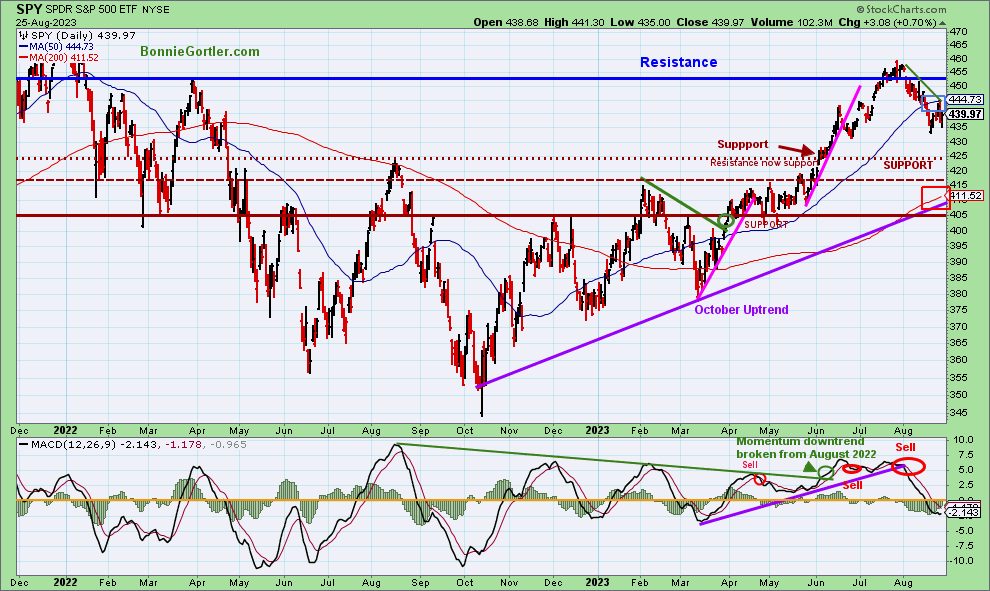
Figure 11: The S&P 500 Index (SPY) Daily (Top) and 12-26-9 MACD (Bottom)
082523 SPY Daily
Source: Stockcharts.com
The S&P 500 (SPY) remains in an uptrend since October 2022.
SPY rose +0.79%, closing at 439.97, below the 50-Day Moving Average (blue rectangle) but above the 200-Day Moving Average (red rectangle).
MACD (bottom chart) remains on a sell below 0 and can generate a buy if SPY stops falling and turns up.
Resistance is 444.00, 452.00, and 460.00. Support is at 425.00, 415.00, and 405.00,.
The S&P has been trending down since July but now shows signs that the recent decline may be coming to an end.
Summing Up:
The major averages have all moved lower in August. The short-term is no longer extended. Market sentiment is improving as investors are no longer showing extreme greed but now show fear. Short-term momentum oscillators are no longer accelerating downward and are in a position from where tradeable rallies occur. As long as support levels remain intact in the near term, expect a reversal to the upside, breaking the recent August downtrends to begin sooner rather than later. Remember to manage your risk, and your wealth will grow.
Let’s talk investing. You are invited to set up your Free 30-minute Wealth and Well-Being Strategy session by clicking here or emailing me at Bonnie@BonnieGortler.com. I would love to schedule a call and connect with you.
Disclaimer: Although the information is made with a sincere effort for accuracy, it is not guaranteed that the information provided is a statement of fact. Nor can we guarantee the results of following any of the recommendations made herein. Readers are encouraged to meet with their own advisors to consider the suitability of investments for their own particular situations and for determination of their own risk levels. Past performance does not guarantee any future results.


Create more wealth in your life
with these simple strategies.
As an added bonus you will also
receive BG’s Updates and Ezine

Discover how to quickly create more well-being in your life with these simple strategies.
As an added bonus you will also
receive BG’s Updates and Ezine

As an added bonus you will receive BG’s Updates and Ezine

All work listed on BonnieGortler.com is licensed under a Creative Commons Attribution - Noncommercial - No Derivative Works 3.0 Unported License.


Free Report:
Grow and Sustain Your Wealth
Discover how to grow your money with these easy, simple steps.

