

10 Simple Tips for Financial Well-Being
07/01/2026
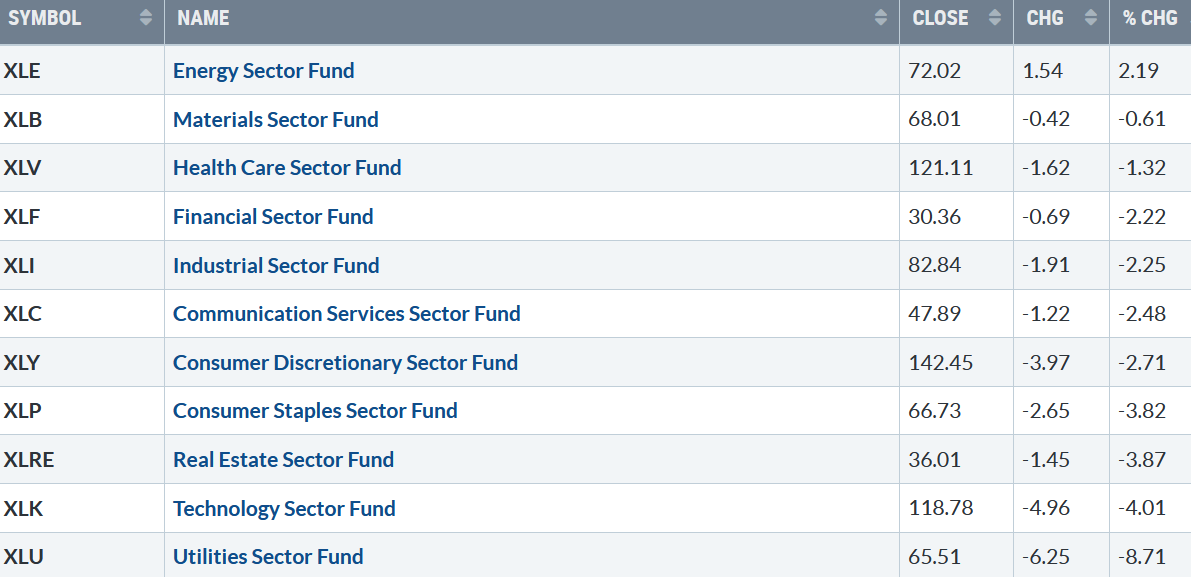
The third quarter ends with the worst September for stocks in twenty years. Dow, S&P 500, Nasdaq, and ten of eleven S&P SPDR sectors were down. Energy (XLE) was the strongest sector, while Technology (XLK) and Utilities (XLU) were the worst sectors. The SPDR S&P 500 ETF Trust (SPY) fell -2.93%, continuing lower the last three weeks.
S&P SPDR Sector ETFs Performance Summary
9/23/22 – 9/30/22
093022 Sectors Week
Source: Stockcharts.com
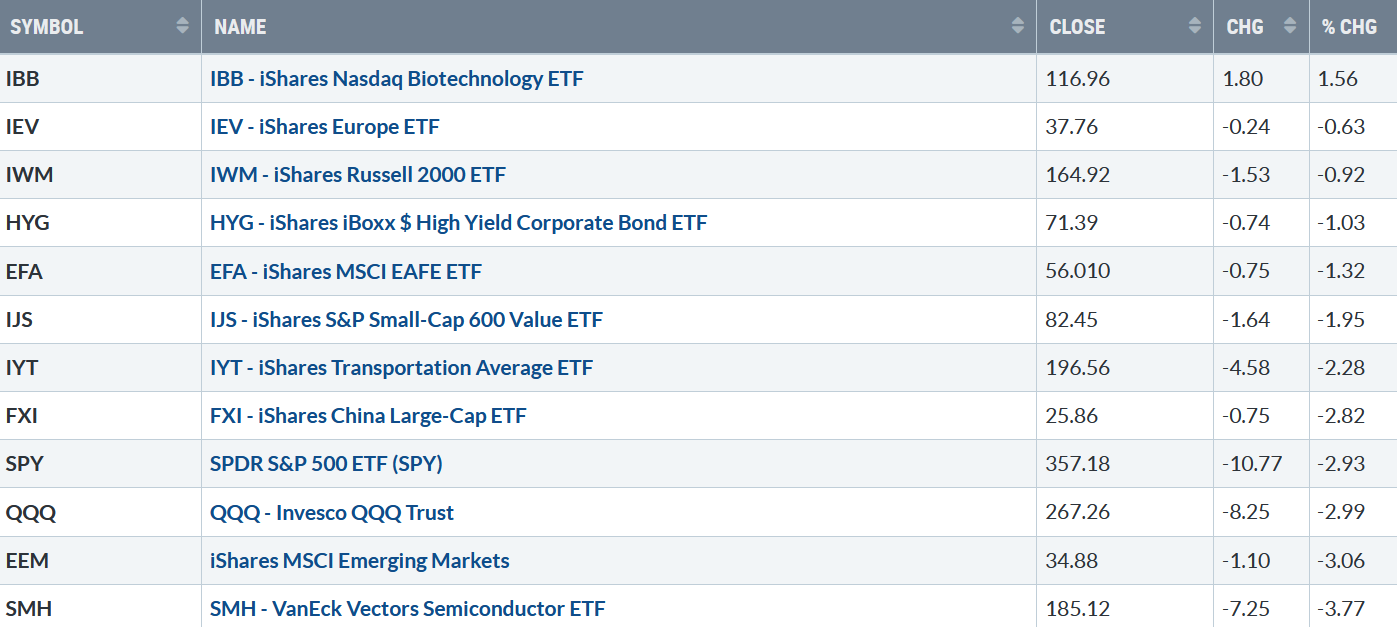
Figure 2: Bonnie’s Mix of ETFs
Performance Summary 9/23/22 – 9/30/22
093022 Week ETFs
Source: Stockcharts.com
Fear amongst investors increased as investors and institutions continued to dump stocks, led by Semiconductors, Emerging Markets, and Technology ETFs falling more than the S&P 500.
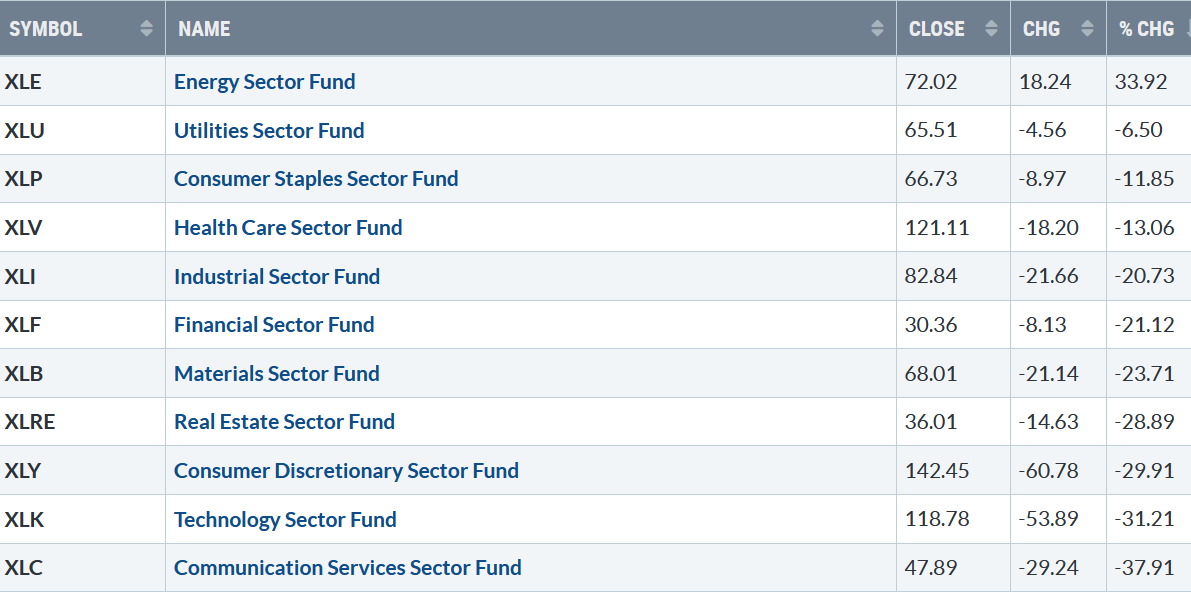
Figure 3:S&P SPDR Sector ETFs YTD Performance Summary
12/31/21– 9/30/22
093022 Sectors YTD
Source: Stockcharts.com
2022 is one of the worst and most challenging years for investors, with ten of eleven S&P SPDR sectors down sharply. Only Energy (XLE) showed gains for the year. Communication Services Sector (XLC) and Technology (XLK) are the worst sectors, while the SPDR S&P 500 ETF Trust (SPY) fell -23.93%.
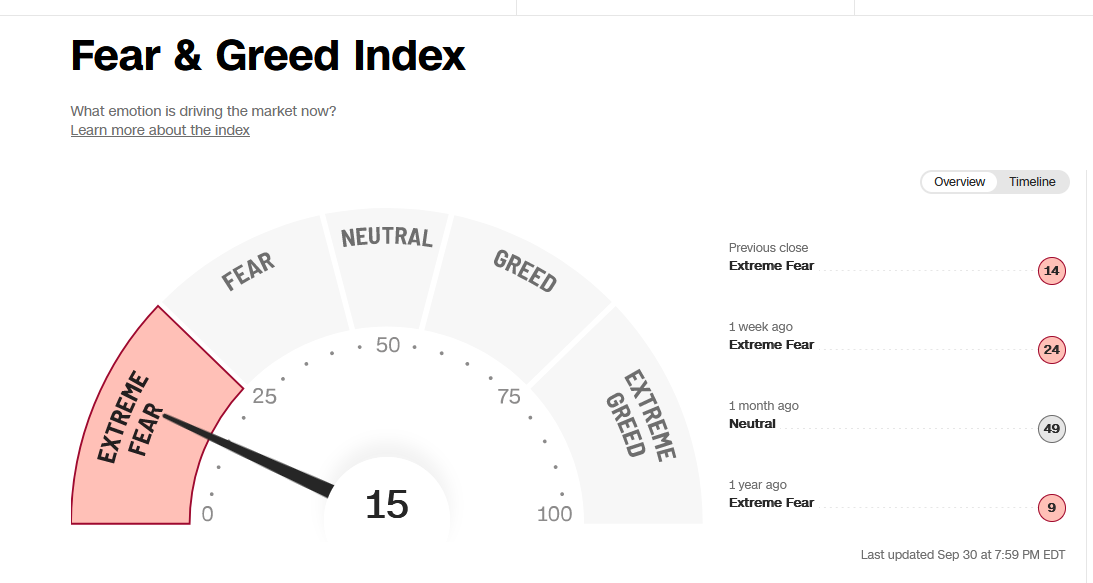
Figure 4: Fear and Greed Index
093022 Fear and Greed Index
Source: Cnn.com
Market sentiment based on the CNBC Fear and Greed Index (a contrary indicator) closed at 15, showing extreme fear falling from 49 only one month ago.
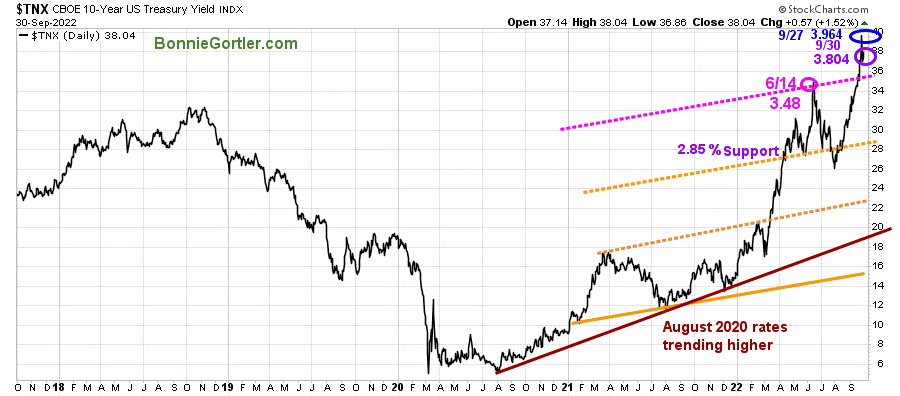
Figure 5: UST 10YR Bond Yields Daily
093022 UST 10 Yr Bond Yields Daily
Source: Stockcharts.com
The 10-Year U.S. Treasury yields rose, closing at 3.804% last week, backing off the high of 3.964%, but remaining above the upper channel.
Yields could consolidate soon, but interest rates continue rising at the fastest pace not seen in decades.
The major averages closed near their lows of the week. The Dow was down -2.92%, S&P 500 down -2.91%, and the Nasdaq down -2.69%. The Russell 2000 Index held up better than the major averages, only falling -0.89%, while the Value Line Arithmetic Index (a mix of approximately 1700 stocks dropped by -1.90%.
Weekly market breadth remains negative on the New York Stock Exchange Index (NYSE) and Nasdaq. The NYSE had 1184 advances and 2336 declines, with 52 new highs and 1575 new lows. There were 2173 advances and 3142 declines on the Nasdaq, with 146 new highs and 1767 new lows.
Continued negative market breadth warrants a cautious outlook.
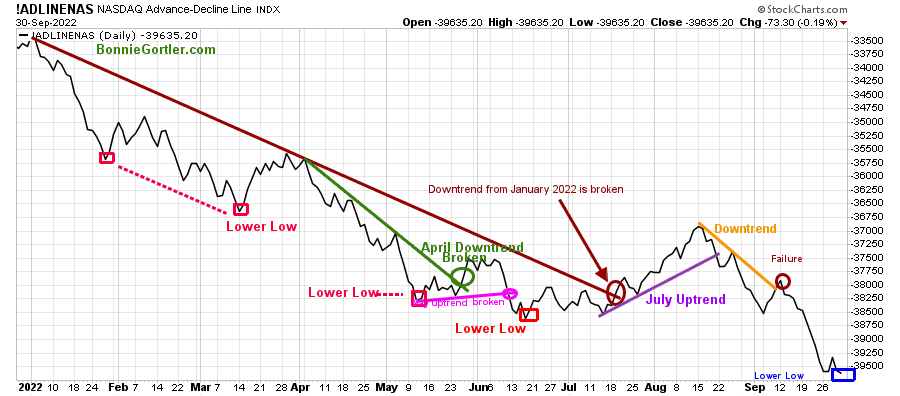
Figure 6: Nasdaq Advance-Decline Line (Daily) 2022
093022 Nasdaq Daily Ad-Line
Source: Stockcharts.com
It’s concerning Nasdaq continues to make lower lows except for brief short-term rallies.
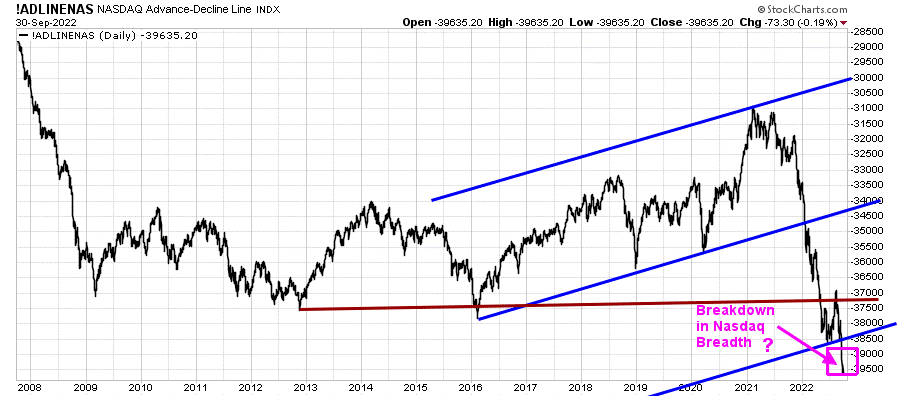
Figure 7: Nasdaq Advance-Decline Line (Daily) Longer-term View
093022 Nasdaq Daily AD-Line Longer Term View
Source: Stockcharts.com
A longer-term view on a daily basis shows Nasdaq breadth with the potential of a significant breakdown (pink rectangle).
Time will tell how severe the weakness in breadth really is.
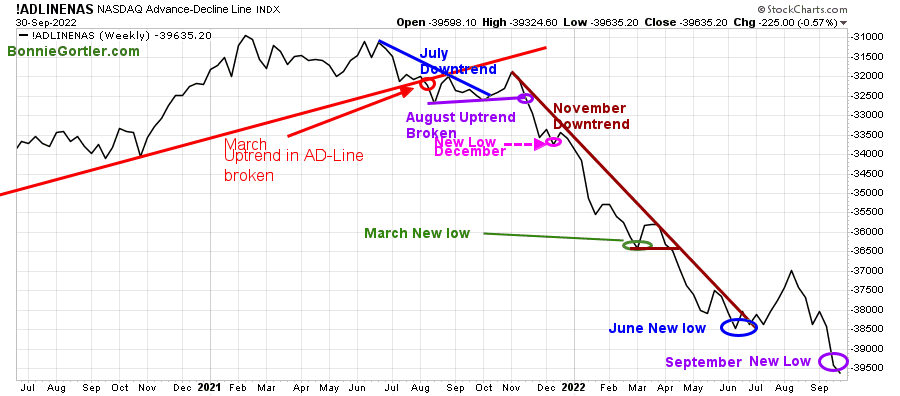
Figure 8: Nasdaq Advance-Decline Line (Weekly)
093022 Nasdaq Weekly Ad-Line
Source: Stockcharts.com
The March uptrend in the weekly Nasdaq Ad-Line was broken in July 2021 (red line), and then Nasdaq breadth weakened.
In July 2022, market breadth improved, starting an uptrend in the AD-Line, but short-lived, and in August, market breadth weakened further, followed by new lows in September.
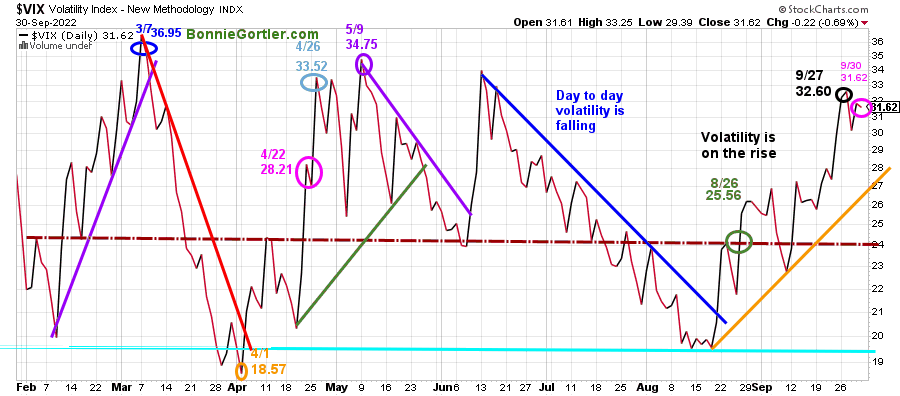
Figure 9: CBOE Volatility Index VIX
0930 VIX Daily
Source: Stockcharts.com
The CBOE Volatility Index (VIX), a measure of fear, has been trading above 20.00 for most of 2022. In late January, VIX made a high at 36.95 on 3/7 (blue circle), followed by a pullback to a low on 4/1 at 18.57. VIX approached the low in August but has trended higher since.
VIX rose last week, closing at 31.62 (pink circle), closing below the peak of 32.60 on 9/27.
Expect intra-day volatility to remain high as long as VIX closes above the uptrend at 27.00 (orange line). The following support is 24.00 (brown dotted line), which has been acting both as resistance and support.
Potentially VIX could go to 60 or higher if the selling accelerates.
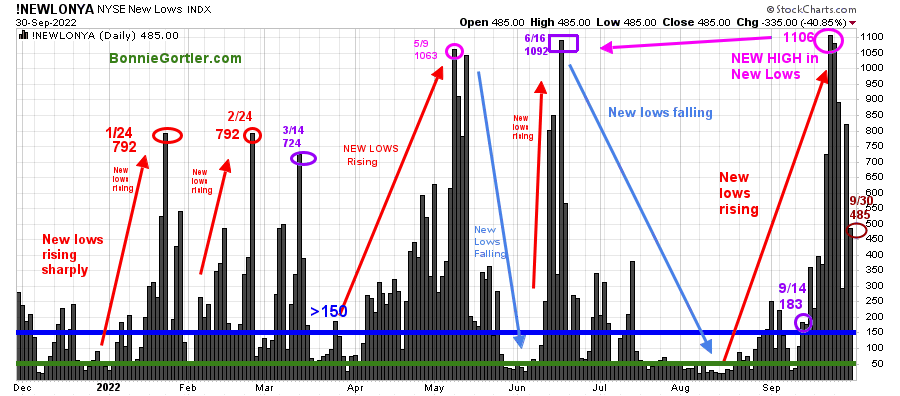
Figure 10: Daily New York Stock Exchange (NYSE) New Lows
093022 NYSE New Lows
Source: Stockcharts.com
Watching New lows on the New York Stock Exchange is a simple technical tool that helps awareness of the immediate trend’s direction.
New lows warned of a potential sharp pullback, high volatility, and “panic selling” for most of 2022, closing above 150. As the market started to move lower in January 2022, New Lows rose sharply, peaking at 792 on 1/24 and again on 2/24 (red circles), implying an increased risk of further selling pressure. Investors in early May unloaded stocks, and New Lows expanded to 1063 on 5/9 (pink circle), then on 6/16 (purple rectangle), and to a new high of 1092.
Learn more about the significance of New Lows in my book, Journey to Wealth, published on Amazon. Here is an excerpt when new lows are above 150, the market is negative, higher risk, and selling is taking place. Sometimes it could be severe, and sometimes on a very nasty day, you can have “panic selling,” and big wild swings (high volatility) to the downside may occur. If you would like a preview, get a free chapter here.
After New Lows contracted in June and July, New lows began to increase in mid-August, rising above 150 (blue horizontal line), the high-risk zone. As a result, the broad market weakened.
Despite the market averages falling last week, New Lows on the New York Stock Exchange Index (NYSE) closed at 485 (brown circle), well below the peak of 1106 on 9/23 (pink circle).
It’s an encouraging sign new lows have contracted. However, New Lows remain in the high-risk zone, above 150.
Caution is recommended until New Lows contracts and falls below 150.
Want a 15-minute chat with me about your investments? Just email me at Bonnie@Bonniegortler.com to set it up.
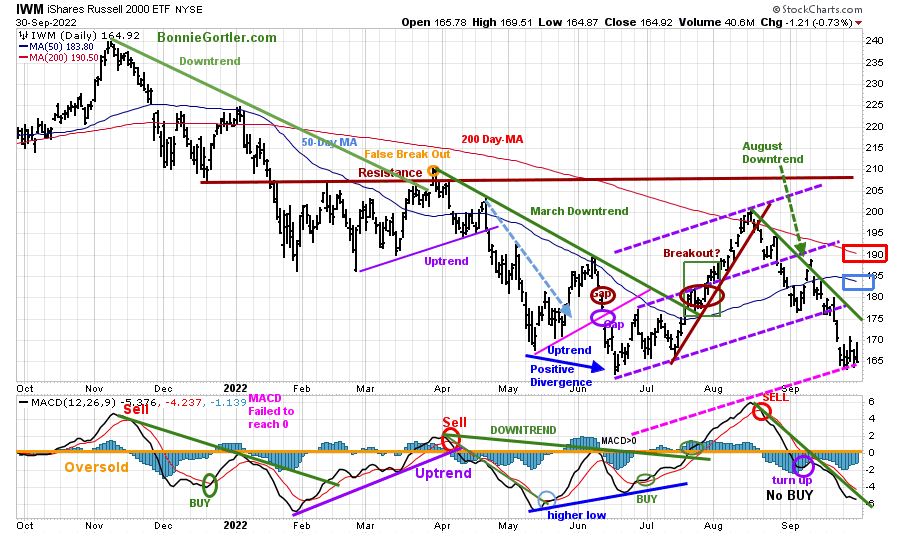
Figure 11: Daily iShares Russell 2000 (IWM) Price (Top) and 12-26-9 MACD (Bottom)
093022 IWM Daily
Source: Stockcharts.com
The top portion of the chart is the daily iShares Russell 2000 Index ETF (IWM), the benchmark for small-cap stocks, with a 50-Day Moving Average (MA) (blue line) and 200-Day Moving Average (MA) that traders watch and use to define trends.
At the end of March, IWM failed to break out above resistance at 210.00 (orange circle) and turned lower with few rallies since the June bottom that have been unsustainable.
IWM stalled below the mid-channel in early September (middle purple dotted line) at 190.00. Last week IWM closed at 164.92, down only -0.92%, closing slightly under support at 165.00 but below Its 50-Day Moving Average (blue rectangle) and the 200-Day Moving Average (red rectangle), a sign of underlying weakness.
Short-term resistance is 173.00, 180.00, and 195.00. Support is at 163.00, and a close below 163.00 would imply more downside toward 150.00.
MACD (middle chart) remains on a sell after a brief turn-up in early September but continues to fall, implying downside momentum is not complete.
In sum, the short term is still negative unless there is at least a turn-up in MACD with a close above 173.00.
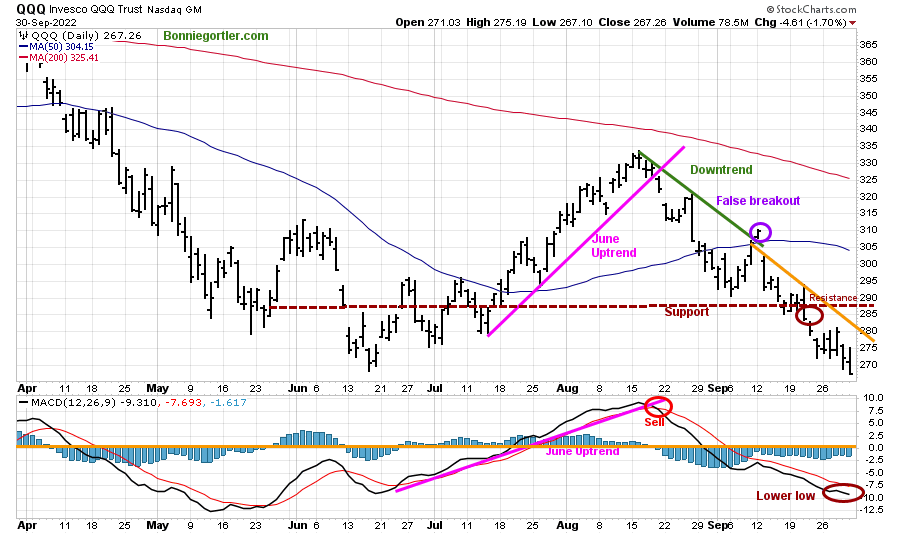
Figure 12: Daily Invesco QQQ Trust (QQQ) Price (Top) and 12-26-9 MACD (Bottom)
093022 QQQ Daily
Source: Stockcharts.com
The chart shows the daily Invesco QQQ, an exchange-traded fund based on the Nasdaq 100 Index. The two top holdings in QQQ are Apple (AAPL) and Microsoft, with over 20.00%. Both stocks have fallen significantly and impacted the direction of QQQ.
QQQ fell -2.99%, closing at 267.26, continuing in a downtrend after a false break out of the August downtrend (green line).
QQQ broke support at 270.00 to end the week. The next support is 265.00, with a downside target of 250.00. Resistance is at 281.00, 285.00, 295.00, and 300.00.
The bottom chart is MACD (12, 26, 9), a measure of momentum that remains on a sell. It’s a negative sign that momentum continued to weaken, and MACD made a new low, suggesting continued caution in the near term until proven otherwise.
Bottom fishing in the Nasdaq is dangerous until at least QQQ closes above the first resistance at 281.00.
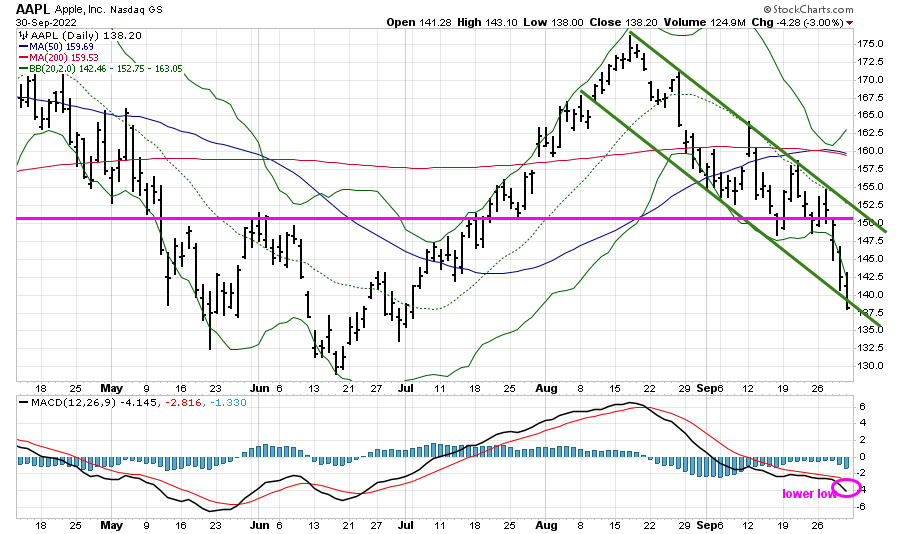
Figure 13: Apple, Inc (AAPL) Price (Top) and 12-26-9 MACD (Middle) and Money Flow (Bottom)
093022 AAPL Daily
Source: Stockcharts.com
Apple (AAPL), the biggest holding in QQQ, succumbed to selling pressure closing at 138.20, down -8.13% for the week, remaining in a downtrend closing below its 50 and 200-Day Moving Average, hitting last week’s short-term downside objective of 142.50, mentioned in last weeks market update 9/23/22 and slightly below the lower channel. A potential test of the June lows is possible.
MACD, a measure of momentum (lower chart), made a lower low, implying weak momentum and further downside unless an immediate turn-up occurs.
Follow up on previous speculative buy.
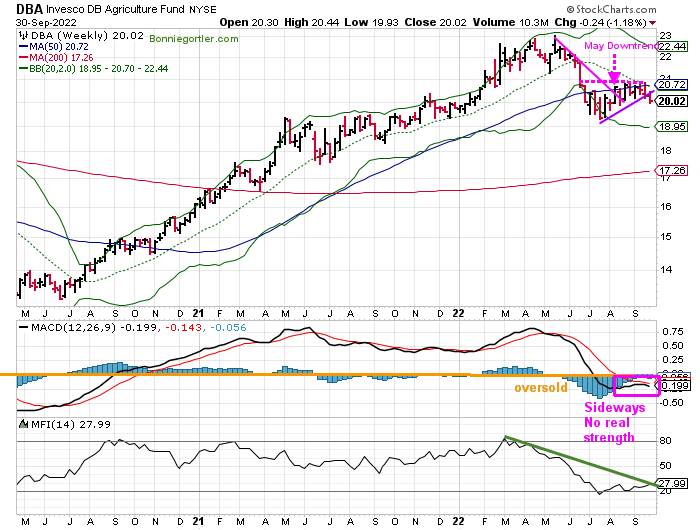
Figure 14: Weekly Invesco Agriculture Fund (DBA) (High Risk) Price (Top) and 12-26-9 MACD (Middle) and Money Flow (Bottom)
093022 DBA Weekly
Source: Stockcharts.com
The Invesco Agricultural Fund (DBA) broke the steep May downtrend (pink line) but stalled and is in a trading range.
DBA fell -1.18 % last week, closing at 20.02, below the July uptrend (purple line)
MACD, a measure of momentum, remains on a sell, moving sideways, with no real strength implying there may be further downside.
Money flow is rising but remains in a downtrend.
For those who did buy, as first mentioned on the 8/12 market update, the sell stop was raised to 19.80 and was hit last week.
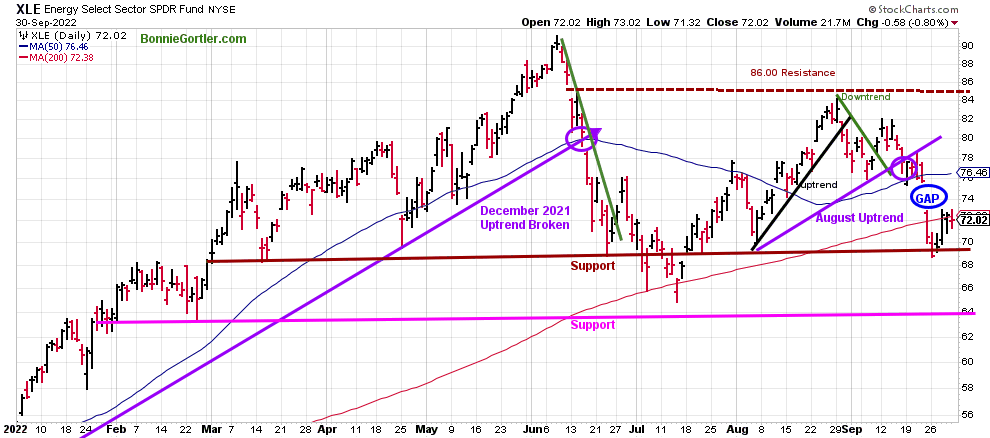
Figure 15: Energy SPDR Daily (XLE)
093022 XLE Daily
Source: Stockcharts.com
Energy (XLE), the strongest sector of 2022, rose in early August, forming an uptrend after its pullback from the June highs.
Last week XLE rose 2.19%, closing at 72.02, slightly below the 200-Day MA.
Resistance is at 73.00, 76.00, and 80.00. Support is slightly below the close at 70.00 (brown line), followed by 64.00 (pink line).
XLE closed near the high of its week, and if the recent low holds, XLE will attempt to fill the gap above between 74.00 and 76.00.
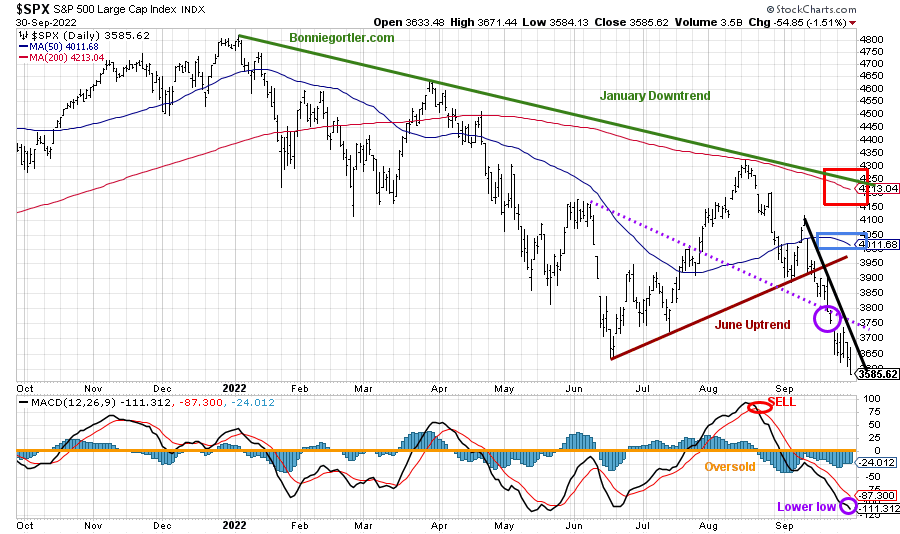
Figure 16: The S&P 500 Index ($SPX) Daily and 12-26-9 MACD (Bottom)
093022 SPX Daily
Source: Stockcharts.com
The S&P 500 (SPX) broke below the critical support at 3800.00 (purple dotted line, and then accelerated lower (purple circle) after breaking the June uptrend (brown line).
SPX closed at a new low for 2022 at 3585.62, down -2.91%, and remains below its 50 – Day Moving Average (blue rectangle) and the 200-Day Moving Average (red rectangle).
MACD, lower chart, remains oversold, below 0, and falling. MACD failed to give a buy after turning up; instead, MACD made a new low, implying downside momentum has not slowed.
The risk of a further correction is high until SPX has enough strength to break the short-term downtrend (black line) and then close above 3750.00.
Follow-Up – Silver
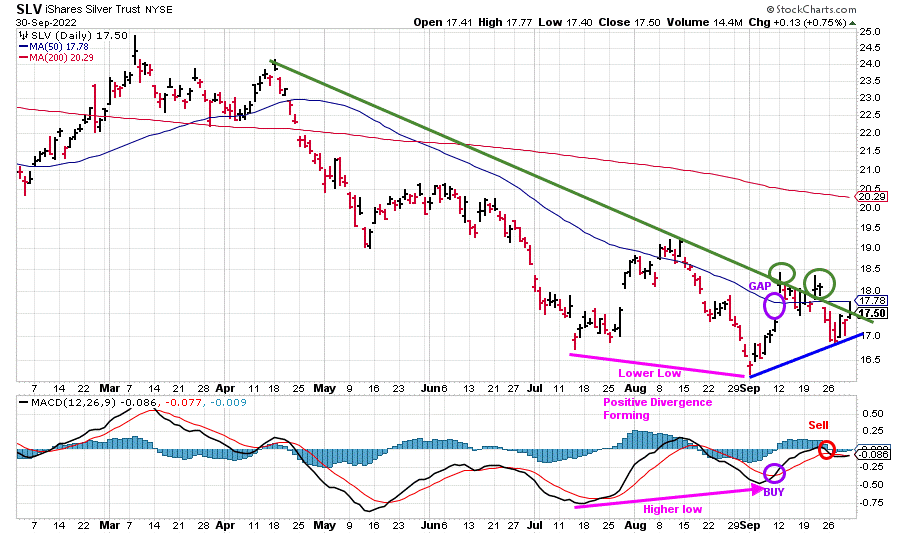
Figure 17: I Shares Silver Trust (SLV) and 12-26-9 MACD (Bottom)
093022 SLV Daily
Source: Stockcharts.com
In the Market Update on 9/9/22, I suggested checking out the Silver chart and noticing the Positive Divergence forming – A Lower low in SLV with a higher low in MACD. A MACD Buy will confirm. SLV gave a buy, rallied, tried to break out, but turned down again.
A volatile week, SLV closed at 17.50, up 0.81%.
MACD last week gave a sell. If there is strength this week, SLV will likely generate a buy.
Last week, a sell stop was recommended if SLV closes below 16.87. SLV intraday hit the level on 9/27 but didn’t close below, and SLV also missed on 9/26, closing at 16.89.
If you are still invested and weren’t stopped out, get out of your position if SLV closes below 16.87. Time will tell if Silver can follow through to the upside, and a sustainable rally will occur.
If you are interested in following this chart and other charts during the week, I invite you to join my FB group Wealth Through Market Charts, where I post updated charts intraday throughout the week.
Keep an eye on the strength of global markets.
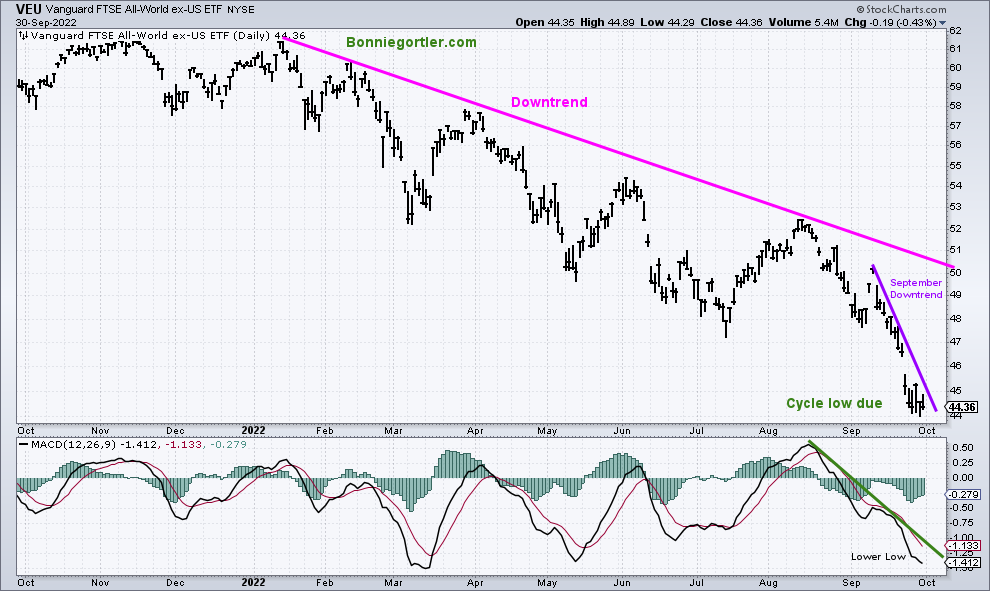
Figure 18: Daily Vanguard FTSE All-World Index ex-US (VEU),12-26-9 MACD (Bottom)
093022 VEU Daily
Vanguard FTSE All-World Index ex-US VEU is developed and emerging non-U.S. equity markets around the world. The 2022 downtrend remains in effect (pink line).
As of Friday’s close, no bottom has formed based on improving momentum or a break in the September short-term downtrend. A close above 45.50 would be a positive sign for the start of a potential rally.
MACD, a measure of momentum, made a lower low last week, implying downside momentum remains.
On the other hand, a potential short-term cycle bottom is due. However, if VEU continues to fall over the next several days, it would imply a cyclical failure has occurred, and the start of October will attract more selling and further downside pressure.
Summing Up:
The bears remain in control. Equities and Bonds are down sharply in 2022. Uncertainty of economic concerns, rising interest rates, falling prices in global and U.S. markets, and continued weakness in technical indicators warrant caution. Technical indicators remain oversold with fear at extreme levels and heavy put buying, but no bounce yet. The risk is high for further downside. Caution is prudent. Be patient until negative market breadth turns positive, and downtrends change to uptrends with a slowing downside momentum.
Remember to manage your risk, and your wealth will grow.
If you liked this article, you will love my Free Grow and Sustain Your Wealth Report. Get it here:
Do you like charts, I invite you to my FB group Wealth Through Market Charts or email me at Bonnie@Bonniegortler.com.
I would love to hear from you. If you have any questions or comments or would like to talk about the market, click here.
Disclaimer: Although the information is made with a sincere effort for accuracy, it is not guaranteed that the information provided is a statement of fact. Nor can we guarantee the results of following any of the recommendations made herein. Readers are encouraged to meet with their own advisors to consider the suitability of investments for their own particular situations and for determination of their own risk levels. Past performance does not guarantee any future results.


Create more wealth in your life
with these simple strategies.
As an added bonus you will also
receive BG’s Updates and Ezine

Discover how to quickly create more well-being in your life with these simple strategies.
As an added bonus you will also
receive BG’s Updates and Ezine

As an added bonus you will receive BG’s Updates and Ezine

All work listed on BonnieGortler.com is licensed under a Creative Commons Attribution - Noncommercial - No Derivative Works 3.0 Unported License.


Free Report:
Grow and Sustain Your Wealth
Discover how to grow your money with these easy, simple steps.

