

10 Simple Tips for Financial Well-Being
07/01/2026
The major averages, Dow, S&P 500, and Nasdaq, closed lower for the week. Four of the 11 S&P sectors for the week ending 1/15/21 finished the week higher. Energy (XLE) and Real Estate (XLRE) was the best sectors gaining +3.21% and +1.91%, respectively. The Communication Services sector (XLRE) was the biggest loser, down -3.26%. The S&P 500 (SPY), in comparison, lost -1.46%.
S&P SPDR SECTOR SUMMARY
Week of 01/15/21
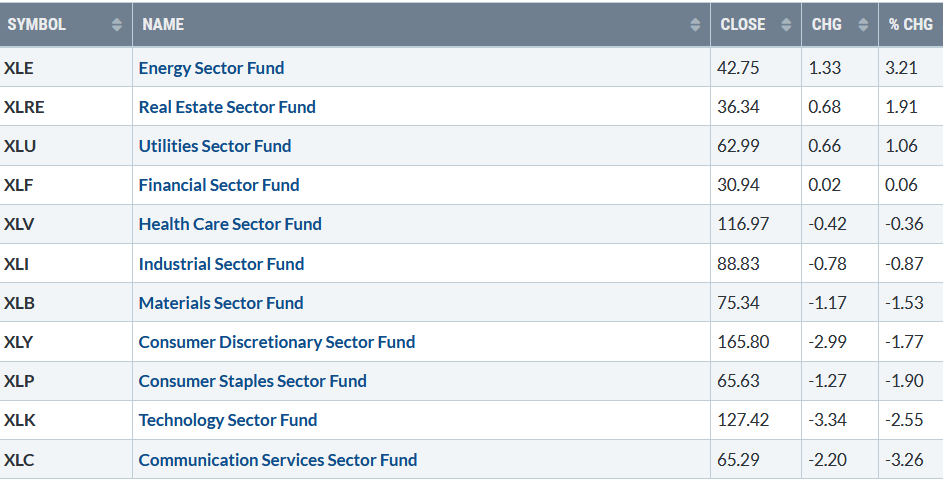
Chart Source: Stockcharts.com week of 01/15/21
Stocks struggled to hold onto their gains after weakness in Technology (XLK) and the Financial Sector (XLF). Financials (XLF) held support above at 29.00, even eking out a small gain for the week. However, (XLF) bears watching since XLF stalled at the upper channel mentioned in my Market Wealth Update Week ending 1/8. More strength in the bank sector would imply higher highs, any weakness would imply a pullback, and more base building is necessary before another rally.
All three major averages, Dow, S&P 500, and the Nasdaq, closed lower. The Russell 2000, the benchmark for small-cap stocks, was the week’s star performer up, +1.51%, although it was down -1.49% on Friday. Further weakness in the Russell 2000 would be short-term negative.
The week’s market breadth on the New York Stock Exchange Index was positive, with 1827 advances and 1402 declines. Daily New Lows on the New York Stock Exchange Index remain low, a bullish sign, implying a continuation of an up-trend is likely, and if there is any selling pressure, it would be limited for now. However, be alert; some sectors are beginning to show signs of weakening momentum, meaning the risk is increasing in the short term. The short-term trend remains up, but expect increased day to day volatility.
What sector to keep an eye on now?
Watch Energy (XLE)
Daily Energy Select Sector SPDR (XLE) Price (Top) and 12-26-9 MACD (Bottom)
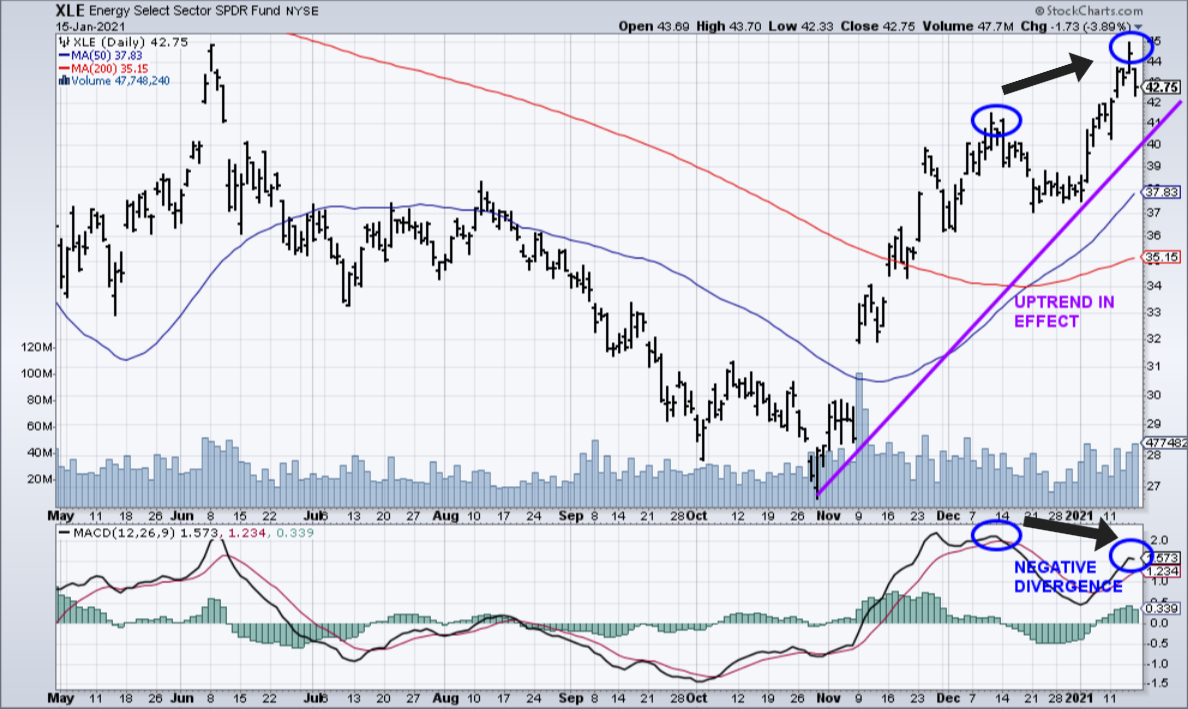
The top part chart shows the daily Energy Select Sector SPDR (XLE),1 an exchange-traded fund that includes securities of companies in oil, gas, and consumable fuels; and energy equipment and services in the S&P 500.
XLE continued to rise last week, making a higher high than December, reaching its highest level since the June 2019 high after being the worst-performing sector last year. For now, XLE is in an uptrend and closed above its 50-Day MA (blue line) at 37.83.
If XLE closes below 40.00 breaking its uptrend, a likely support area is the 50-Day Moving Average. A close below 37.83 would imply more weakness to occur, and a test of the 200-Day MA at 35.15 (red line), 17.8% lower than 1/15 close.
The lower portion of the chart is the 12-26-9 Daily MACD, a technical indicator that measures momentum. With the weakness on Friday, MACD turned down, forming a negative divergence, a bearish technical pattern, warning potential weakness could occur as soon as this week.
In Sum:
Due to the negative divergence and high beta risk in energy, no new buying is recommended. Now is an excellent time to review your portfolio and take some profits in energy stocks. If Financials are also weak, this will imply risk is increasing in the short-term. Be alert to a change in the short-term trend. Have a risk management strategy that you are comfortable with reducing your holdings and increasing cash for a better future opportunity.
I would love to hear from you. If you have any questions or comments, click here or Email me at Bonnie@bonniegortler.com.
1The XLE top holdings as of 1/15/21, the top three holdings are Exxon Mobil Corporation 23.76%, Chevron Corporation 21.36%, and ConocoPhillips 4.46% totaling 49.58%. Source: https://www.etf.com/XLE
If you liked this article, you would love my Free report, Grow and Sustain Your Wealth. Please get it here
Disclaimer: Although the information is made with a sincere effort for accuracy, it is not guaranteed that the information provided is a statement of fact. Nor can we guarantee the results of following any of the recommendations made herein. Readers are encouraged to meet with their own advisors to consider the suitability of investments for their own particular situations and for determination of their own risk levels. Past performance does not guarantee any future results.


Create more wealth in your life
with these simple strategies.
As an added bonus you will also
receive BG’s Updates and Ezine

Discover how to quickly create more well-being in your life with these simple strategies.
As an added bonus you will also
receive BG’s Updates and Ezine

As an added bonus you will receive BG’s Updates and Ezine

All work listed on BonnieGortler.com is licensed under a Creative Commons Attribution - Noncommercial - No Derivative Works 3.0 Unported License.


Free Report:
Grow and Sustain Your Wealth
Discover how to grow your money with these easy, simple steps.

