

10 Simple Tips for Financial Well-Being
07/01/2026
The S&P 500 had its best week since July. Five sectors were stronger than SPDR S&P 500 ETF Trust (SPY), up 1.83% the week ending 10/15/21. Materials (XLB) and Real Estate (XLRE) were the strongest sectors, while Health Care (XLV) and Communications (XLC) were the weakest.
S&P SPDR Sector ETFs Performance Summary
Week Ending 10/15/21
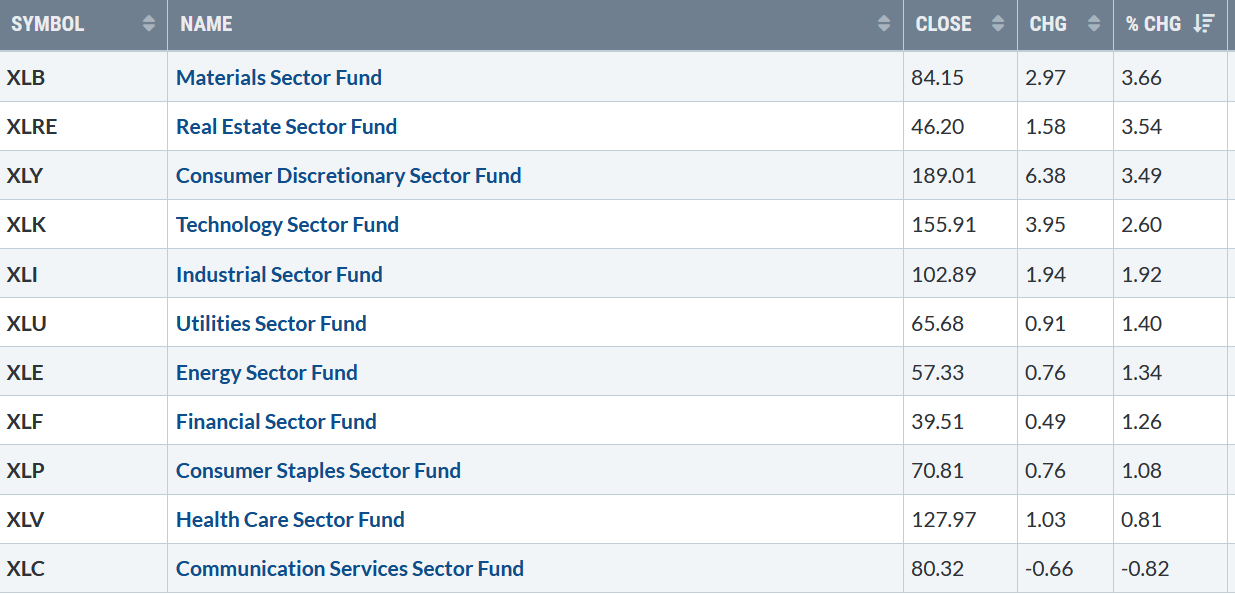
Source: Stockcharts.com
Earnings season started positive, leading the market averages higher. The Dow rose +1.58%, the S&P 500 up +1.82%, and Nasdaq +2.18%. The Russell 2000 Index was slightly weaker than the S&P 500 gaining 1.46%.
It continues to be an encouraging sign for the bulls that the Value Line Arithmetic Average, a mix of approximately 1700 stocks, was strong, gaining 1.80%, and the Dow Jones Transportation Average rose 3.76%.
Market breadth was positive for both the NYSE and Nasdaq. The New York Stock Exchange Index (NYSE) had 2395 advances and 1082 declines. Nasdaq had 2782 advances and 2019 declines.
Continued expansion in market breadth on the Nasdaq and the New York Stock Exchange will propel the market higher.
Figure 1: 10-Year US Treasury Yields
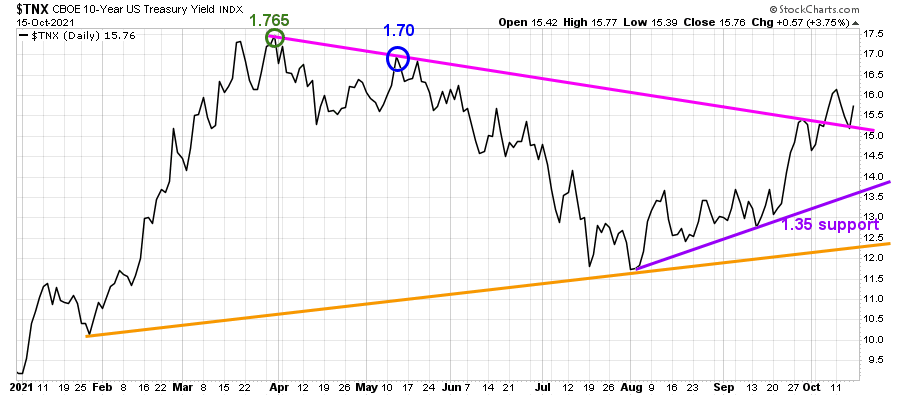
Source: Stockcharts.com
10-Year U.S. Treasury yields fell for the first time in eight weeks, closing at 1.576 %, after testing 1.617%, its highest level since June (Figure 1).
Support is 1.35% (purple line).
Figure 2: Key ETFs to Watch Performance week of 10/8/21 – 10/15/21
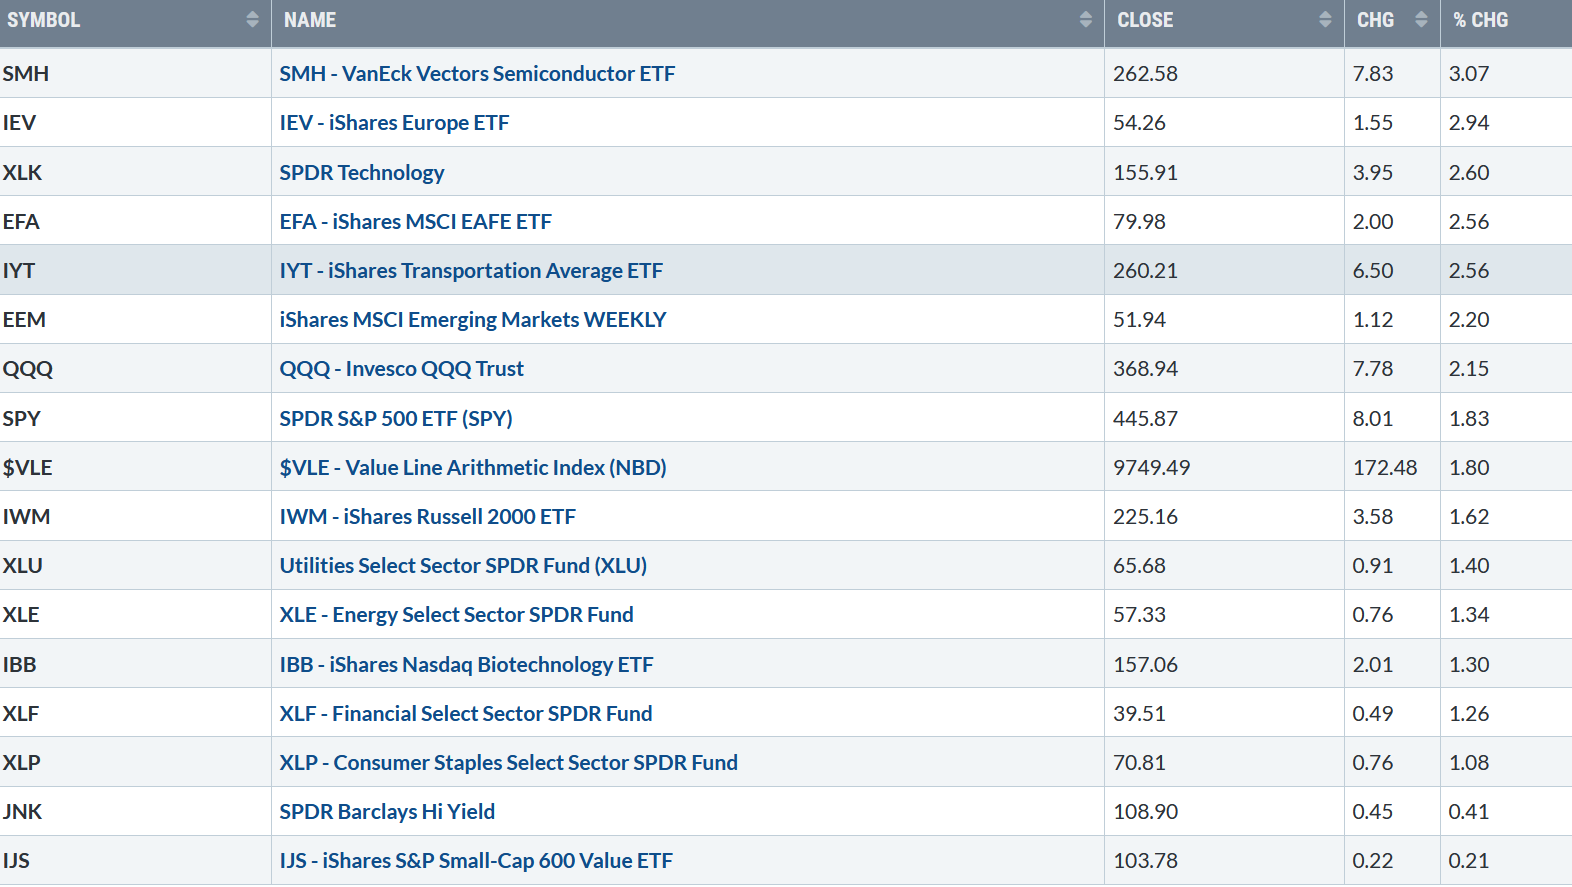
Source: Stockcharts.com
Investors rotated into Semiconductors (SMH) and Europe (IEV), which have been out of favor in recent weeks.
Figure 3: Daily New York Stock Exchange (NYSE) New Lows
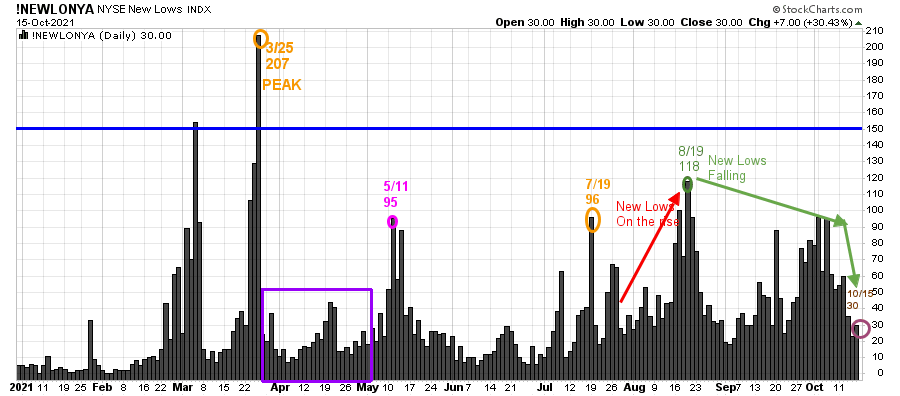
Source: Stockcharts.com
On 3/25/21, the NYSE New Lows peaked at 207 (orange circle) and immediately contracted (purple rectangle), followed by a jump to 95 on 5/11. New lows then contracted from May to 7/19, before rising to 96 (orange circle), peaking at 118 (green circle) on 8/19, then declined.
Watching New lows on the New York Stock Exchange is a simple technical tool that helps awareness about the immediate trend’s direction. Learn more tips in my book, Journey to Wealth. The market is very strong when the New Lows are below 25 (Very Low Risk, and prices tend to rise). When New Lows are between 25 and 50, the risk is low, and prices tend to rise.
New lows closed at 30 on 10/15, continuing to contract in October, remaining below the 8/19 peak (green circle) of 118.
It’s positive that new lows fell to the 25-50 zone where the risk is low, and prices tend to rise.
A significant correction is not likely until new lows rise and close above 150 (blue line).
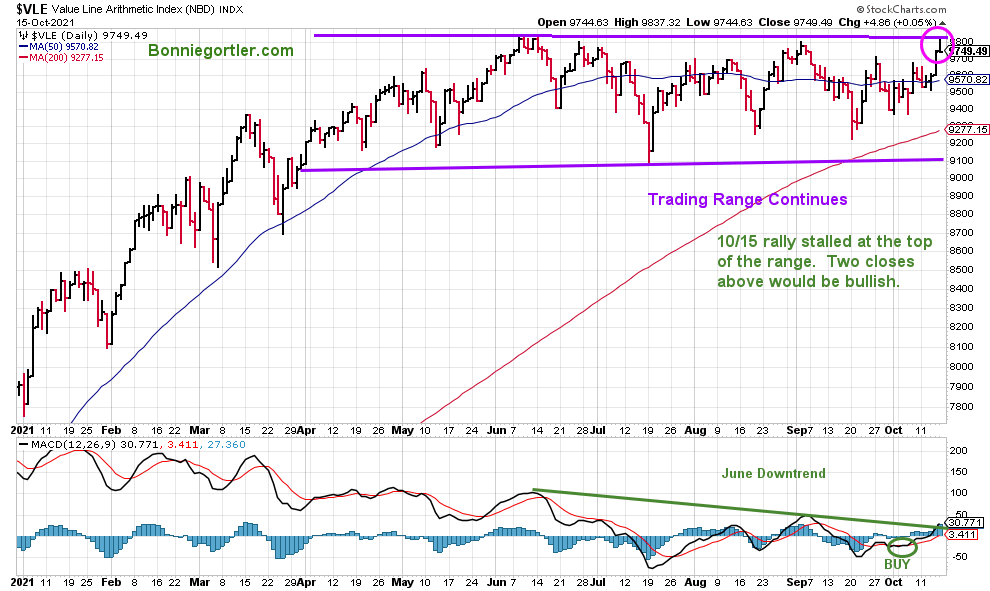
Figure 4: The Value Line Arithmetic Average
101521 Value Line Arithmetic Average
Source: Stockcharts.com
The Value Line Arithmetic Average is a broad index, a mix of approximately 1700 stocks. It remains in a trading range. The direction of the breakout or breakdown will be the clue to the next move. If MACD continues to rise through the June downtrend, then the odds of
the breakout will be to the upside which bodes well for the broad market.
The Value Line Arithmetic Average stalled at the upper channel of its trading range on 10/15 and turned lower (pink circle). Two closes above Friday’s 10/15 high of 9837.42, the top of its trading range, would confirm further gains in the near term.
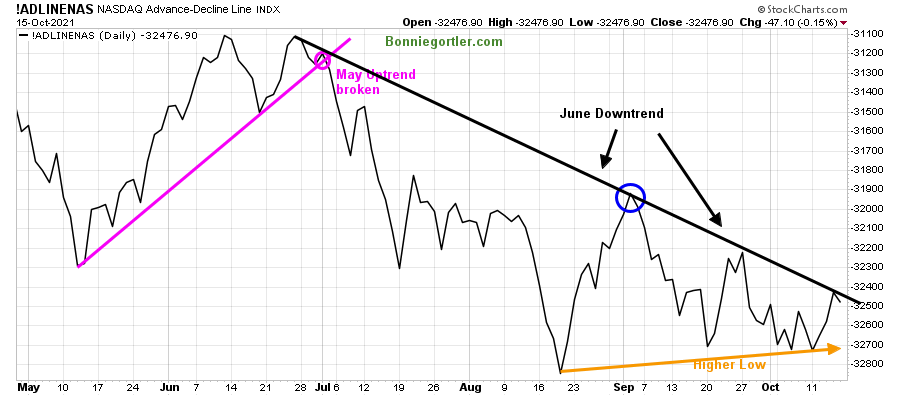
Figure 5: Daily Nasdaq Advance-Decline Line
101521 Nasdaq Daily Ad line
Source: Stockcharts.com
The Daily Nasdaq AD-Line broke down in July (pink line) and trended lower into August after making lower highs in July. The AD-line failed to get through the June downtrend (black line) and turned down in September, making lower highs.
It’s encouraging the higher low from August (orange arrow) held last week. It will be short-term bullish for the Nasdaq if the June downtrend is broken (black line).
The weekly Advance-Decline line trend remains in a downtrend and turned up, making a higher low (chart not shown). However, expanding weekly breadth (more issues up than down), which could take several weeks, is needed to confirm an intermediate bottom (weeks-to-months) has occurred. See Bonnie’s Market Charts section on my website to view the chart.
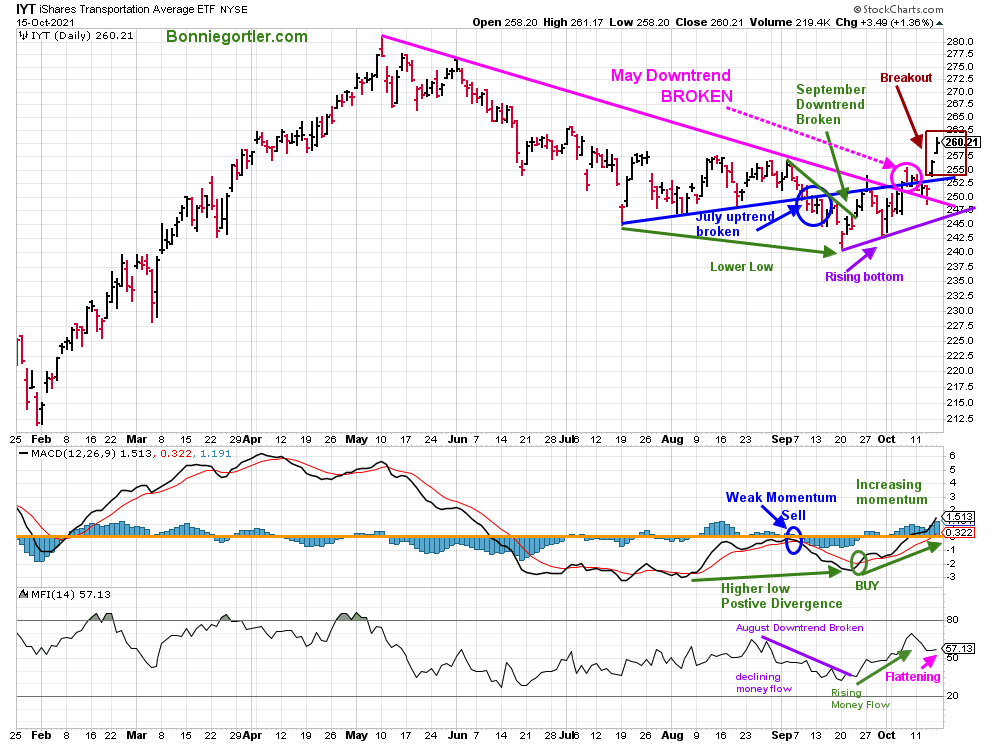
Figure 6: Transportation Average
10/15/21 IYT
Source: Stockcharts.com
Its bullish IYT was one of the strongest sectors for the last two weeks, up 2.56% after gaining +2.11% the previous week, closing at 260.11. After breaking the short-term September downtrend (green line), the Transports (IYT) broke the May downtrend (pink line), successfully testing its September low.
MACD (middle chart) remains on a timely buy with increasing upside momentum, implying more gains ahead.
Short-term resistance is 262.50, followed by 267.50 and 275.00.
Money Flow (lower graph) has improved since September fueling the short-term breakout to the upside. However, Money Flow stopped rising on the breakout of IYT and started flattening. For IYT to get through the first resistance at 262.50, money flow needs to turn up now.
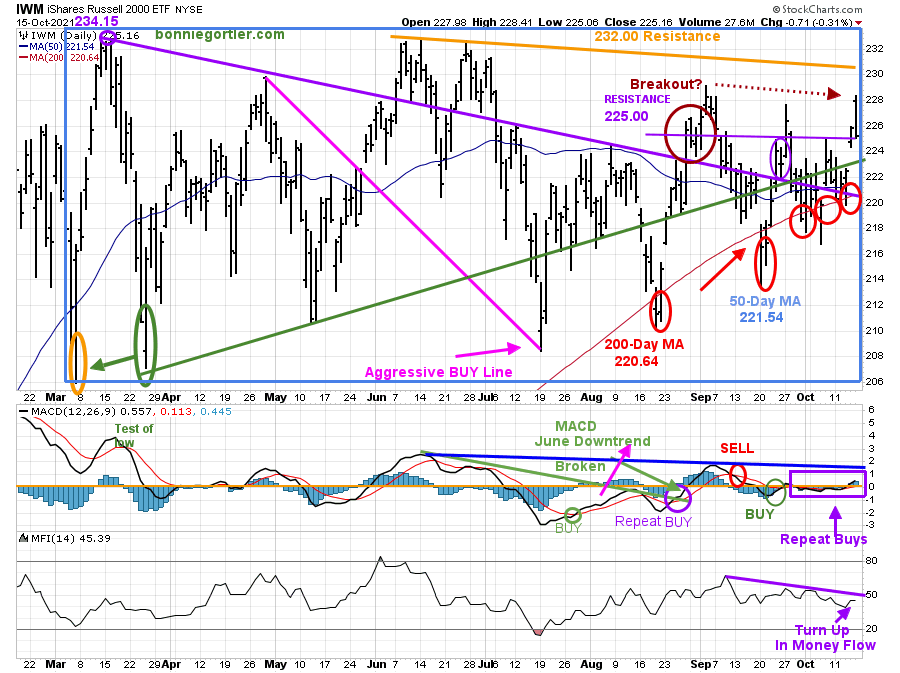
Figure 7: Daily iShares Russell 2000 (IWM) Price (Top) and 12-26-9 MACD (Middle and Money Flow (Bottom)
101521 IWM daily
Source: Stockcharts.com
The top portion of the chart is the daily iShares Russell 2000 Index ETF (IWM), the benchmark for small-cap stocks, with a 50-Day Moving Average (MA) (blue line) and 200-Day Moving Average (MA), that traders watch and use to define trends.
IWM made a low on 3/5, then peaked at 234.15 (purple circle), followed by declines to test the March lows and the March high, in a trading range (blue rectangle).
Last week, IWM fell below the 200-day Moving Average (red circles) and recovered for the fifth time (red circles). The buyers stepped in on 10/13 above the lower support of 218.00. IWM made an effort to breakout (brown dotted arrow), but IWM stalled under 232.00 resistance on 10/15 and closed near its lows above old resistance at 225.00.
The middle chart is MACD (12, 26, 9), a measure of momentum. After breaking the June downtrend, MACD gave repeat buys in August but no meaningful rally. MACD remains on a buy but has had a succession of repeat buys.
What’s different now?
I’m optimistic that MACD and Money Flow will break their downtrends and IWM will challenge their old new high. Daily support is at 224.00 followed by 218.00.
The weekly chart (chart not shown) key support remains at 210.00.
A weekly close below 210.00 would negate my positive outlook and give lower downside objectives. See Bonnie’s Market Charts section on my website to view the chart.
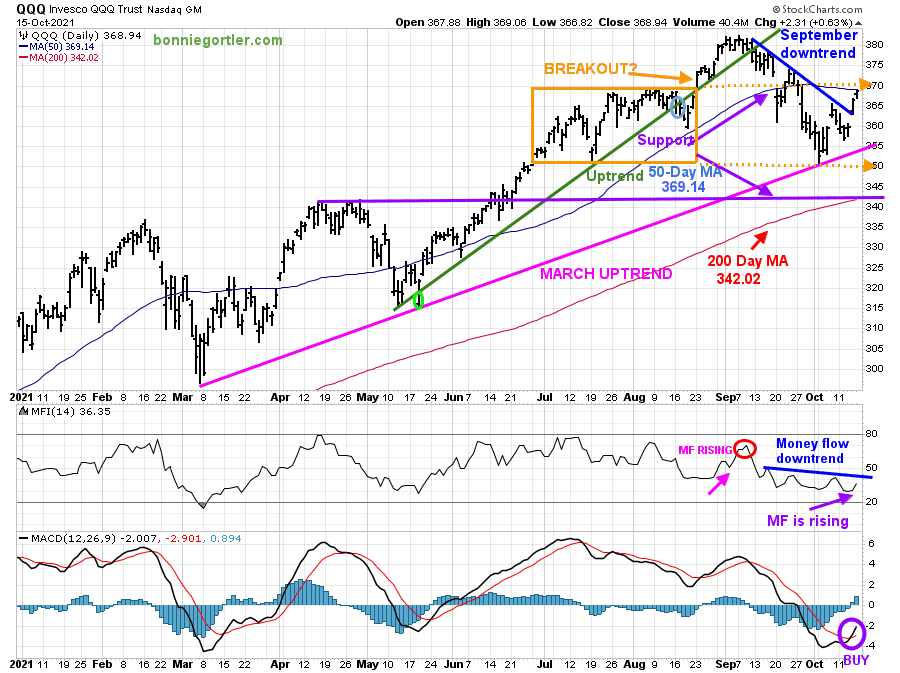
Figure 8: Daily Invesco QQQ Trust Nasdaq (QQQ) Price (Top) Money Flow (Middle) and 12-26-9 MACD (Bottom)
101521 QQQ Daily
Source: Stockcharts.com
The chart shows the daily Invesco QQQ, an exchange-traded fund based on the Nasdaq 100 Index with its 50-Day Moving Average and 200-Day Moving Average.
The March uptrend (top chart) remains intact (pink line). In June, QQQ was in a trading range (orange rectangle) and then broke out to the upside in August but fell below the 370.00 where the QQQ broke out in early September on 10/4/21 testing support at 350.00. QQQ closed at 368.94, up 2.15%, breaking the short-term downtrend from 9/7 (blue line).
Resistance is at 370.00 followed by 380.00 with an upside objective at 390.00
Money Flow peaked in mid-September (red circle) and then trended down. Its positive money flow is now rising (purple arrow) and close to breaking the September downtrend (blue line). Money flow rising implies that investors have started rotating into growth stocks. It will help if 10-Year US Treasury Yields stop climbing in the near term and stabilize.
The lower chart is MACD (12, 26, 9), a measure of momentum. MACD gave a new buy signal, a rising double bottom from an oversold condition where sustainable rallies begin.
Support is at 360.00, followed by 350.00 and 340.00 (purple line). For now, the bulls are in control. A close below 340.00 would negate my optimistic outlook.
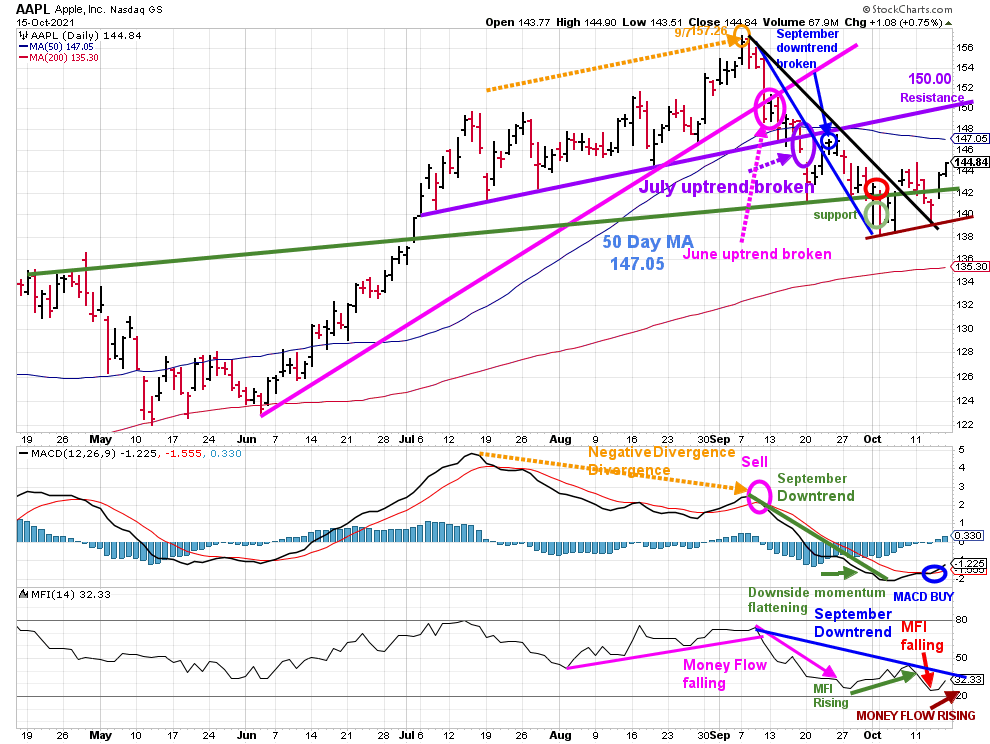
Figure 9: Apple (AAPL) Daily
101521 AAPL Daily
Source: Stockcharts.com
Apple (AAPL) peaked on 9/7/21 at 157.26 (orange circle). AAPL then declined to fall below its June uptrend (pink circle) and below its 50-day Moving Average in September, where it remains in October. AAPL broke its short-term September downtrend (blue line). However, it failed to close above the 50-Day MA or above the July uptrend (purple line) and continued lower.
AAPL continues its better tape action gaining 1.36%, closing at 144.84 near its high of the week, above support at141.00, and above the September downtrend (black line).
MACD (middle chart) generated a new buy (blue circle) on the rising money flow lower chart. I am optimistic that the September downtrend in money flow will continue to rise ahead of earnings announced on 10/28/21.
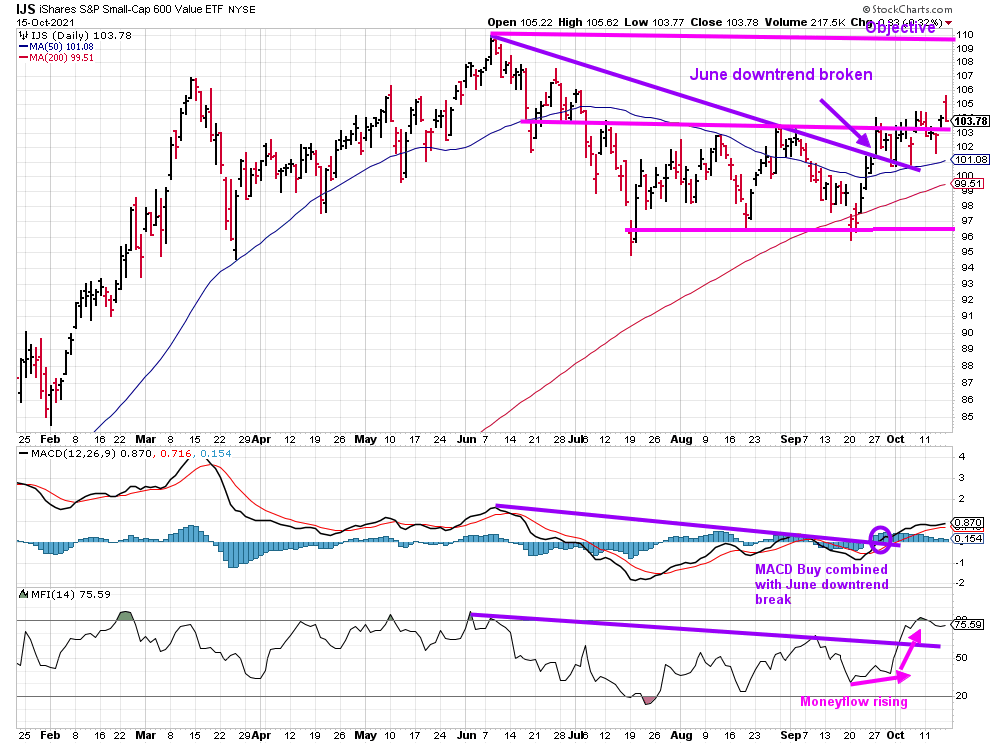
Figure 10: IJS iShares S&P Small-Cap 600 Value
101521 IJS Daily
Source: Stockcharts.com
The iShares S&P Small-Cap 600 Value ETF (IJS) tracks an index of small-cap US stocks that provides exposure to the US small-cap companies that are considered undervalued by the market relative to other companies. The top sectors are Financials Consumer Cyclicals and Industrials.
IJS only rose +0.21%, remaining above the June downtrend and the mid-channel. MACD is on a buy, gaining momentum after breaking the June downtrend. Money flow remains strong, although it has flattened. I remain confident IJS will continue to rise toward their June highs.
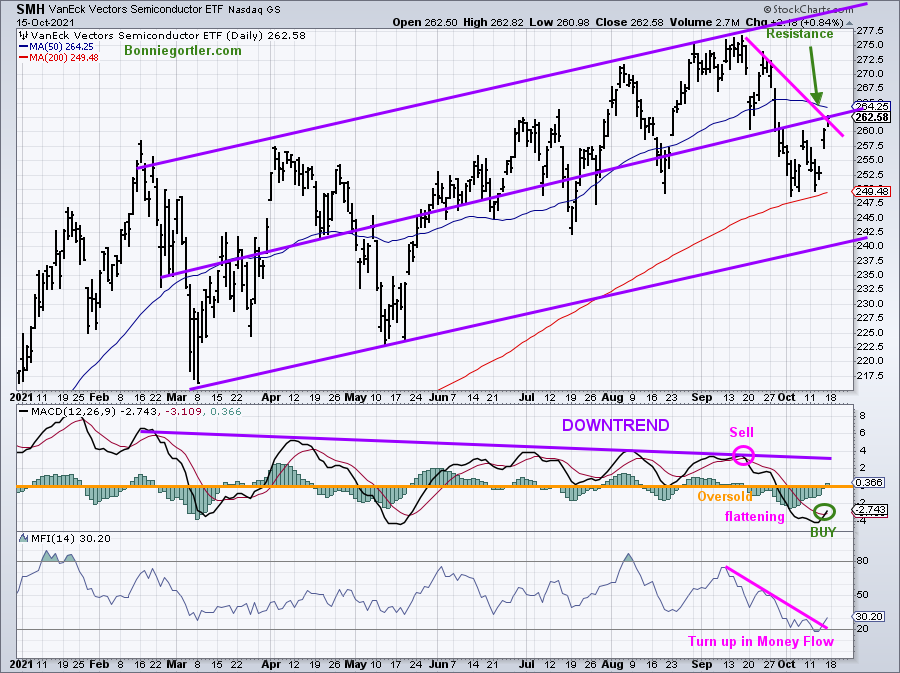
Watch Semiconductors for Leadership to Ignite the Broad Market Higher
Figure 11: Van Eck Semiconductors (SMH) Daily
101521 SMH Daily
Source: Stockcharts.com
SMH is a leading indicator of the technology sector. For a sustainable rally, Semiconductors (SMH) need to:
It’s positive that MACD (middle chart) generated a buy, combined with money flow, breaking the September downtrend.
September Downtrends Broken (Bullish)
Figure 12: ARKK Innovation

101521 21 ARKK
Source: Stockcharts.com
ARKK, an actively managed ETF by Cathie Wood that seeks long-term growth, has broken its September short-term downtrend and generated a MACD buy. Soon to confirm if ARKK moves higher, is the July downtrend broken in MACD, implying further strength is likely.
Figure 13: SPDR S&P 500 (SPY)
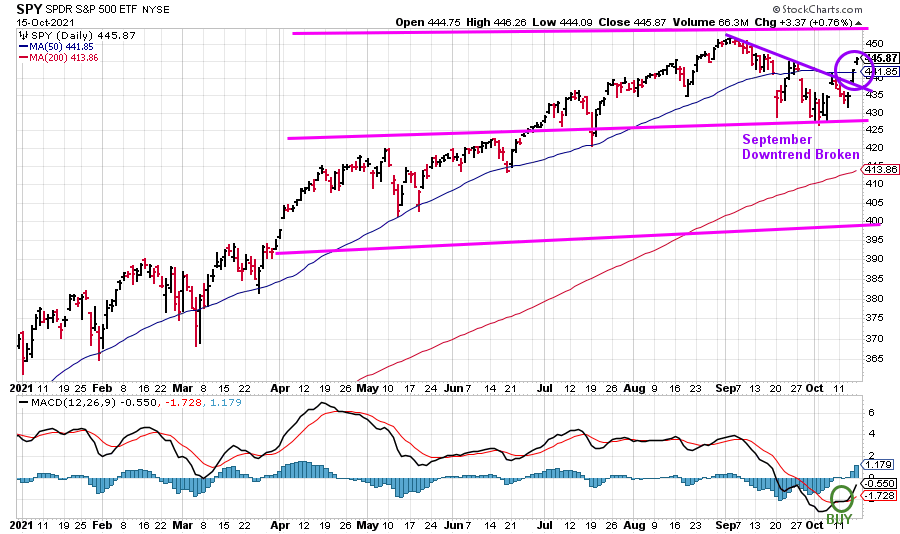
101521 SPY Daily
The S&P 500, with approximately 500 large companies, also has broken the September downtrend and generated a new MACD buy.
Summing Up:
The bulls won the battle over the bears last week. The short-term trend is now up. Momentum indicators such as MACD have improved over the previous few weeks and have generated new buy signals. Many downtrends were penetrated in price last week. Watch for further confirmation with strength from AAPL, ARKK, Semiconductors (SMH) Value Line Arithmetic Average, and the Russell 2000 (IWM) to be the catalysts that propel the market higher as we enter November and December, a historical seasonally strong time of the year. The bulls are in control until proven otherwise.
Remember to manage your risk, and your wealth will grow.
If you liked this article, you will love my Free Charting Master Class. Get it here:
I would love to hear from you. If you have any questions or comments or would like to talk about the market, click here.
Disclaimer: Although the information is made with a sincere effort for accuracy, it is not guaranteed that the information provided is a statement of fact. Nor can we guarantee the results of following any of the recommendations made herein. Readers are encouraged to meet with their own advisors to consider the suitability of investments for their own particular situations and for determination of their own risk levels. Past performance does not guarantee any future results.


Create more wealth in your life
with these simple strategies.
As an added bonus you will also
receive BG’s Updates and Ezine

Discover how to quickly create more well-being in your life with these simple strategies.
As an added bonus you will also
receive BG’s Updates and Ezine

As an added bonus you will receive BG’s Updates and Ezine

All work listed on BonnieGortler.com is licensed under a Creative Commons Attribution - Noncommercial - No Derivative Works 3.0 Unported License.


Free Report:
Grow and Sustain Your Wealth
Discover how to grow your money with these easy, simple steps.

