

10 Simple Tips for Financial Well-Being
07/01/2026
The major averages continue to climb to record highs. Only three sectors were stronger than SPDR S&P 500 ETF Trust (SPY), up 1.35% the week ending 10/29/21. Consumer Discretionary (XLY) and Technology (XLK) were the strongest sectors, while Energy (XLE) and Financials (XLF) were the weakest.
S&P SPDR Sector ETFs Performance Summary
Week Ending 10-22-10/29/21
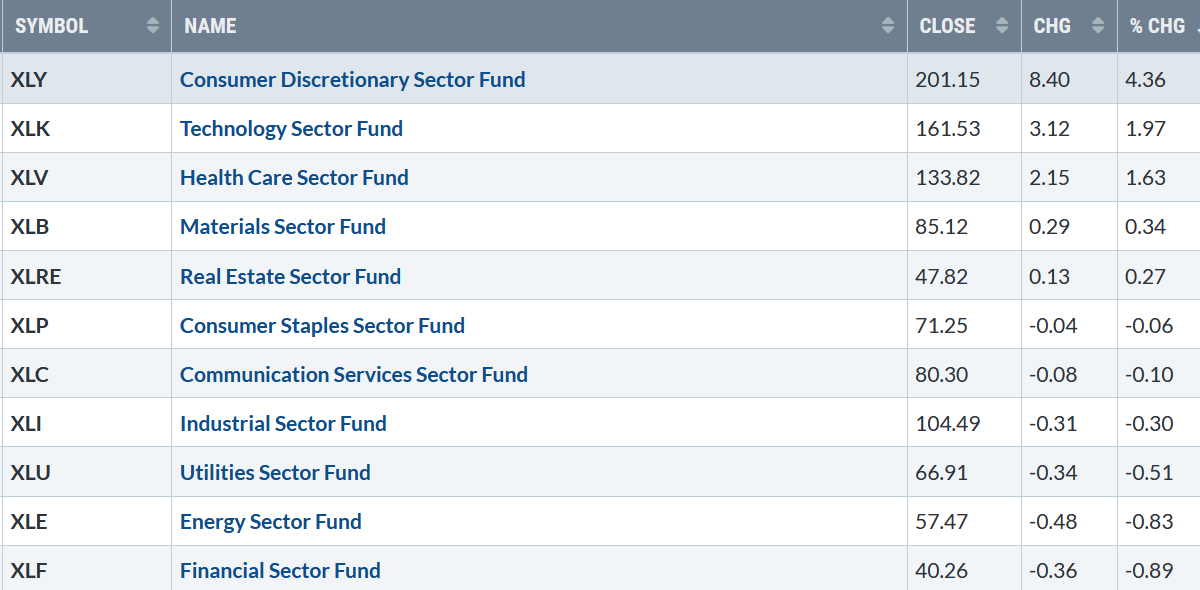
Source: Stockcharts.com
The Dow rose +0.40%, the S&P 500 up +1.33%, and Nasdaq +2.70%. The Russell 2000 Index gained +0.26%, again weaker than the S&P 500.
The Value Line Arithmetic Average, a mix of approximately 1700 stocks, fell -0.67% after penetrating the upper channel, unable to sustain its gains. The Transportation Average rose +0.85%, the third straight week of gains but underperformed both the S&P 500 and Nasdaq as investors rotated into growth stocks.
Weekly market breadth was positive for both the NYSE and Nasdaq. The New York Stock Exchange Index (NYSE) had 1840 advances and 1669 declines. Nasdaq had 2833 advances and 2101 declines.
There was some improvement in weekly Nasdaq breadth. However, the New York Stock Exchange breadth was weaker, and no breadth thrust occurred, confirming higher prices.
Figure 1: 10-Year US Treasury Yields
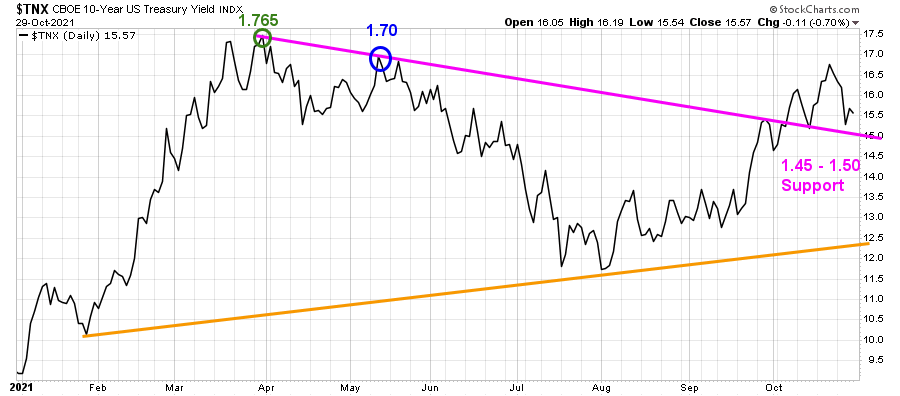
Source: Stockcharts.com
10 -Year U.S. Treasury yields fell last week, closing at 1.557% after hitting a high of 1.691 %, closing below April’s highs (Figure 1), fueling growth stocks higher.
Support remains between 1.45% and 1.50%.
If yields fall, that could fuel the advance. On the other hand, if yields rise quickly and close above the April highs, growth stocks are likely to be under pressure and could dampen the optimism among traders.
Figure 2: 5 Year US Treasury Yields
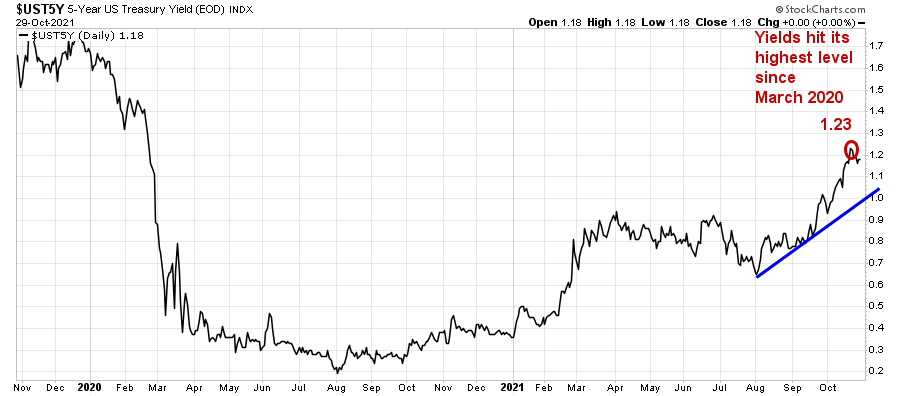
102291 UST 5Y Bond Yields Daily
5 -Year U.S. Treasury yields fell to 1.18% after hitting their highest level since March 2020 of 1.230%.
Figure 3: ETFs Performance 10/22/21 – 10/29/21
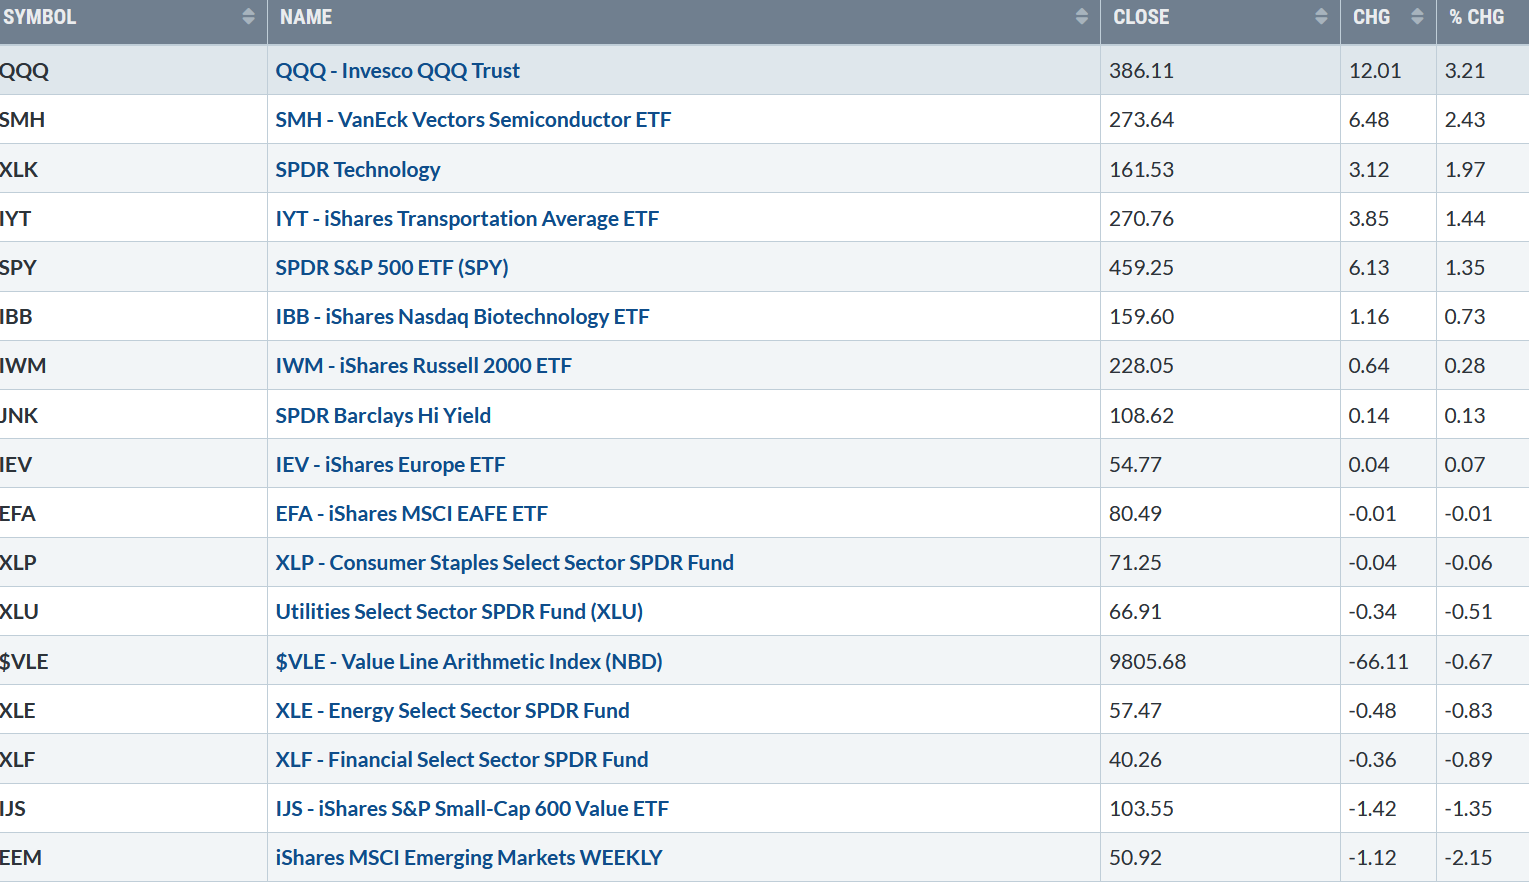
102291 ETFs Weekly Performance
Source: Stockcharts.com
Technology and Semiconductors led last week, while Financials were weak. Emerging Markets and Europe continued to lag the U.S. market.
For October, Transports, Energy, Technology and Semiconductors were leaders, while Small Cap Value, High Yield, and Biotechnology lagged.
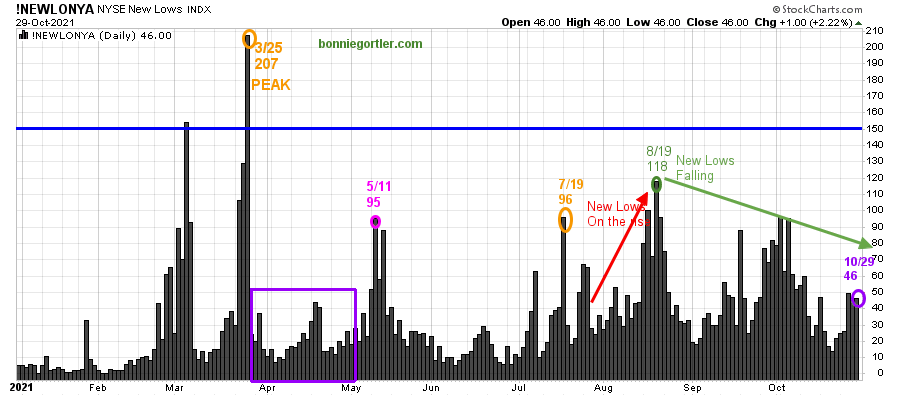
Figure 4: Daily New York Stock Exchange (NYSE) New Lows
102921 NYSE NEW LOWS
Source: Stockcharts.com
On 3/25/21, the NYSE New Lows peaked at 207 (orange circle) and immediately contracted (purple rectangle), followed by a jump to 95 on 5/11. New lows then contracted from May to 7/19, before rising to 96 (orange circle), peaking at 118 (green circle) on 8/19.
Watching New lows on the New York Stock Exchange is a simple technical tool that helps awareness about the immediate trend’s direction.
Learn more in my book, Journey to Wealth. The market is very strong when the New Lows are below 25 (Very Low Risk and prices tend to rise). When New Lows are between 25 and 50, the risk is low, and prices tend to rise.
New lows inched up last week, closing at 46 (purple circle) but remain in a low risk zone where prices tend to rise.
A significant correction is not likely until new lows rise and close above 150 (blue line).
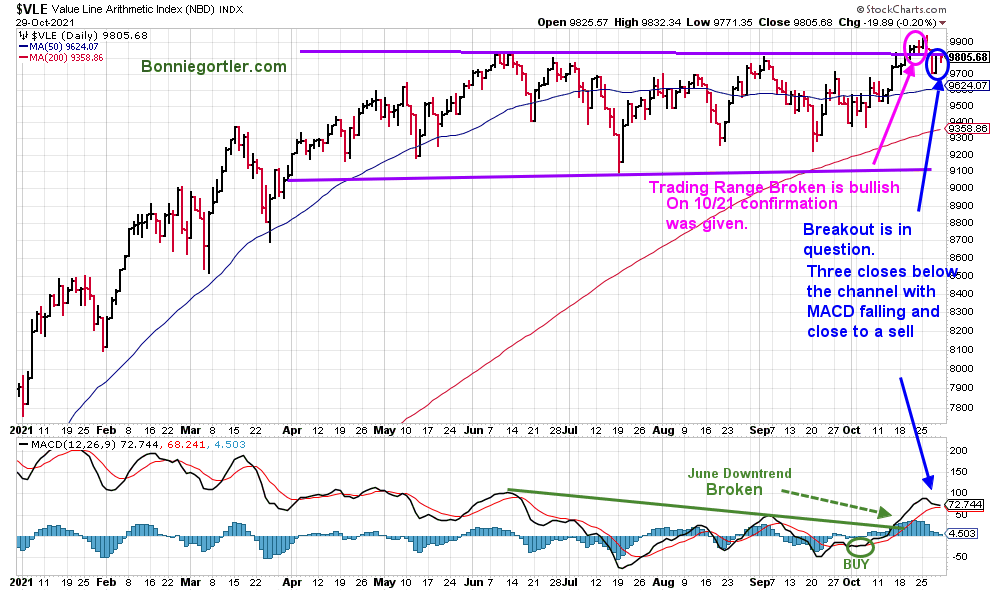
Figure 5: The Value Line Arithmetic Average
102921 Valueline Arithmetic Average
Source: Stockcharts.com
The Value Line Arithmetic Average is a broad index, a mix of approximately 1700 stocks. The Value Line Arithmetic Average had two closes above the trading range, confirming the breakout (pink circle). However, the breakout is now in question as there was no follow through to the upside, and the price turned down for three days.
MACD (lower chart) broke the June downtrend but is now falling and close to a sell.
Further weakness in the Value Line Arithmetic Average and MACD would imply the breakout is false and further gains in the near term are in jeopardy. However, a new high made quickly would be positive.
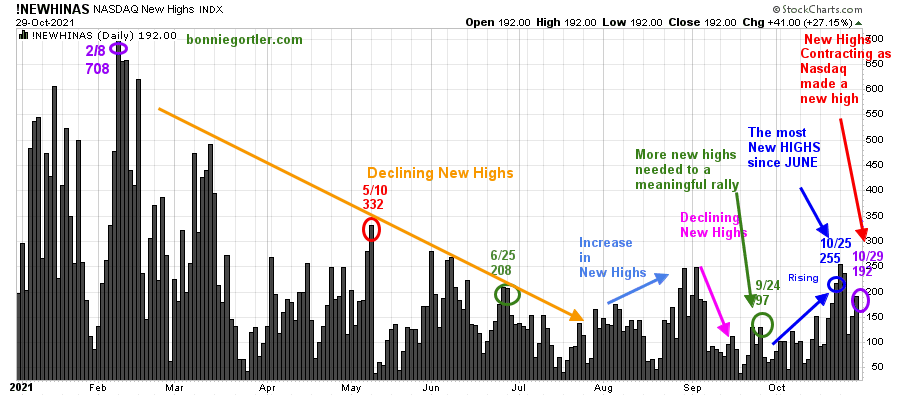
Figure 6: Nasdaq New Highs
102921 Nasdaq New Highs
Source: Stockcharts.com
Nasdaq New Highs hit a peak reading of 708 on 2/8 (purple circle) and then trended lower from February through July.
New Highs reached 255 on 10/25/21, the most since June. However, they have started to contract to close at 192 on 10/29, below the 5/10 high of 332.
Watch closely if new highs expand over the next few weeks. If new highs contract and there are more New Lows than New Highs, the rally may fizzle quickly.
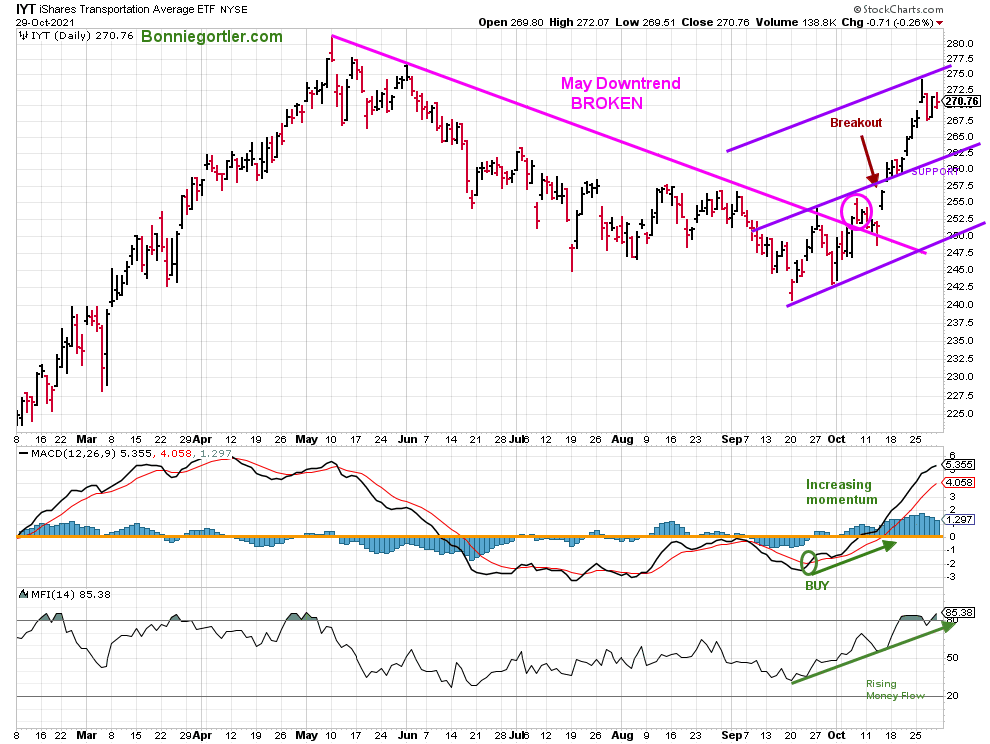
Figure 7: Transportation Average
102921 IYT Daily
Source: Stockcharts.com
The Transports (IYT) closed at 270.76, up 1.44%, continuing higher since breaking the May downtrend (pink line).
IYT reached its targets of 262.50, 267.50 and closed at 270.76, just under 275.00, after making an intraday high of 272.0. The last target of 275.00 mentioned in the Market Wealth Update Week Ending 10/22/21 remains.
Support is 265.00, 262.50, followed by 260.00. A close below 257.50 would negate the 275.00 objectives. On the other hand, two close above 275.00 would give an objective to 287.50 followed by 300.00.
MACD, a measure of momentum, continues to rise, confirming the strength in IYT, implying further gains. Money Flow (lower graph) is strong but extended. As long as money flow continues to rise, then IYT is likely to work its way higher. Watch for when money flow turns down for a clue IYT will begin to weaken.
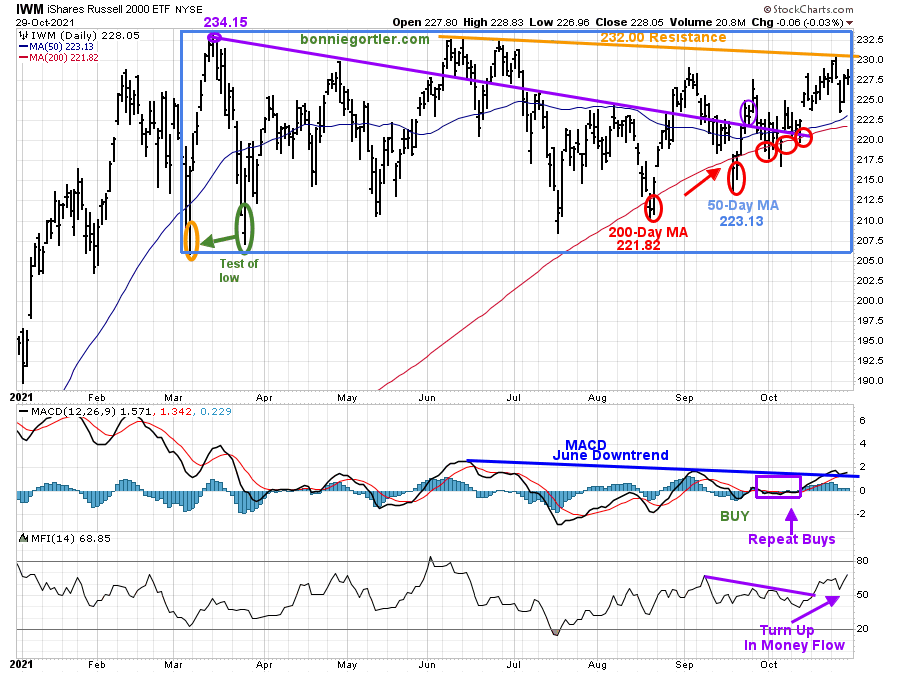
Figure 8: Daily iShares Russell 2000 (IWM) Price (Top) and 12-26-9 MACD (Middle and Money Flow (Bottom)
102291 IWM Daily
Source: Stockcharts.com
The top portion of the chart is the daily iShares Russell 2000 Index ETF (IWM), the benchmark for small-cap stocks, with a 50-Day Moving Average (MA) (blue line) and 200-Day Moving Average (MA), that traders watch and use to define trends.
IWM made a low on 3/5, then peaked at 234.15 (purple circle), followed by declines to test the March lows and the March high. Notice the five penetrations of the 200-Day Moving (red circles) within the trading range (blue rectangle).
IWM closed at 228.05 +0.28%, failed to get above 232.00 resistance, and is underperforming the S&P 500, which is negative.
Support is at 223.00, followed by 221.00 and 218.00.
The middle chart is MACD (12, 26, 9), a measure of momentum. After breaking the early June downtrend, (green line), MACD gave repeat buys in August, September, and October as price stayed in the trading range.
What’s different this week?
The latest week’s action is mixed. The jury remains out whether IWM will penetrate resistance and challenge the old high.
The weekly chart (not shown) support remains at 210.00. A weekly close below 210.00 would give lower downside objectives. See Bonnie’s Market Charts section on my website to view price and relative strength charts.
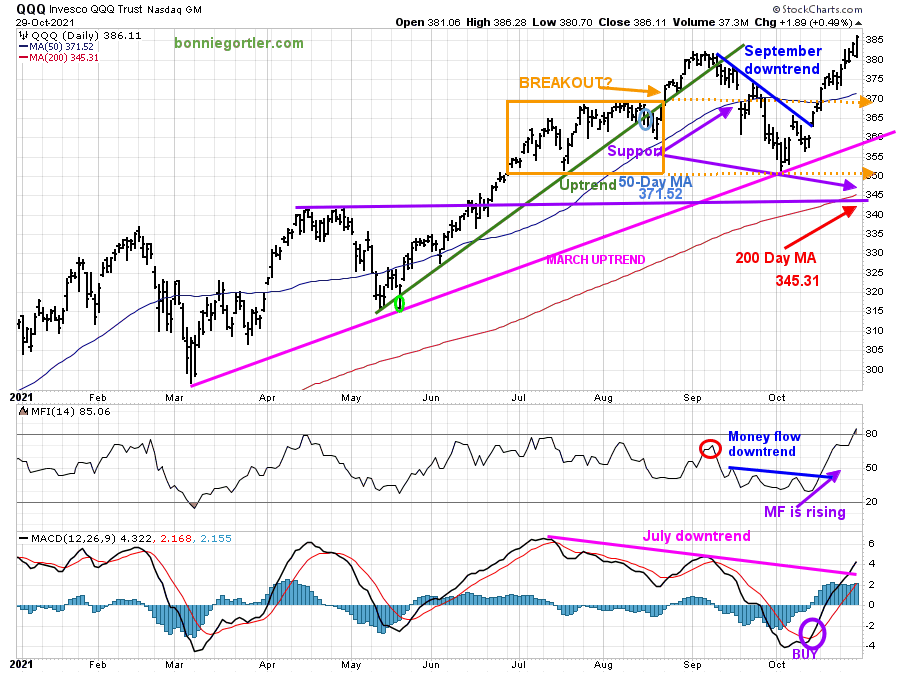
Figure 9: Daily Invesco QQQ Trust Nasdaq (QQQ) Price (Top) Money Flow (Middle) and 12-26-9 MACD (Bottom)
102921 QQQ Daily
Source: Stockcharts.com
The chart shows the daily Invesco QQQ, an exchange-traded fund based on the Nasdaq 100 Index with its 50-Day Moving Average and 200-Day Moving Average.
The March uptrend (top chart) remains intact (pink line).
In June, QQQ was in a trading range (orange rectangle) and then broke out above 370.00 in August, which failed. A decline followed to 350.00 support in late September.
After breaking the short-term downtrend from 10/7 (blue line), QQQ continued to climb, making a new high closing at 386.11 up +3.21% last week.
QQQ penetrated resistance at 380.00 despite hourly negative divergences that formed during the week and disappointing earnings reports by Apple (AAPL) and Amazon (AMZN). The upside objective remains at 390.00.
Money Flow (middle chart) peaked in mid-September (red circle) and then trended down. As investors rotated back into growth stocks, money flow continued to rise (purple arrow), breaking the September downtrend (blue line).
The lower chart is MACD (12, 26, 9), a measure of momentum. MACD gave a timely buy signal, a rising double bottom from an oversold condition where sustainable rallies begin. Its bullish MACD is rising, and the July downtrend was broken.
Short-term support is at 380.00, followed by 370.00. A close below 370.00 would not be a good sign and imply weakness to 357.50 followed by 350.00.
Significant support is at 345.00 (purple line). A close below 345.00 would be very concerning and imply the intermediate trend could be in jeopardy.
ALERT: Potential Negative Divergence Forming in QQQ for the Intermediate-Term combined with Weak Money Flow
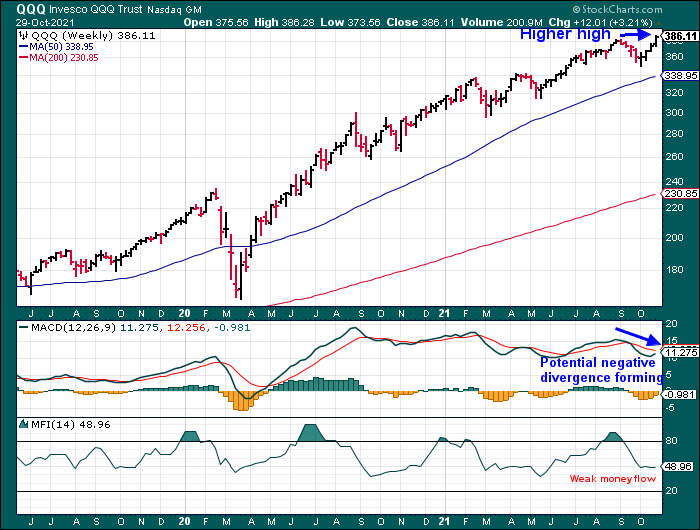
Figure 10: Weekly Invesco QQQ Trust Nasdaq (QQQ) Price (Top) 12-26-9 MACD (Middle) and Money Flow (Bottom)
102291 QQQ Weekly
Source: Stockcharts.com
The daily and weekly QQQ charts are not in alignment and bear-watching.
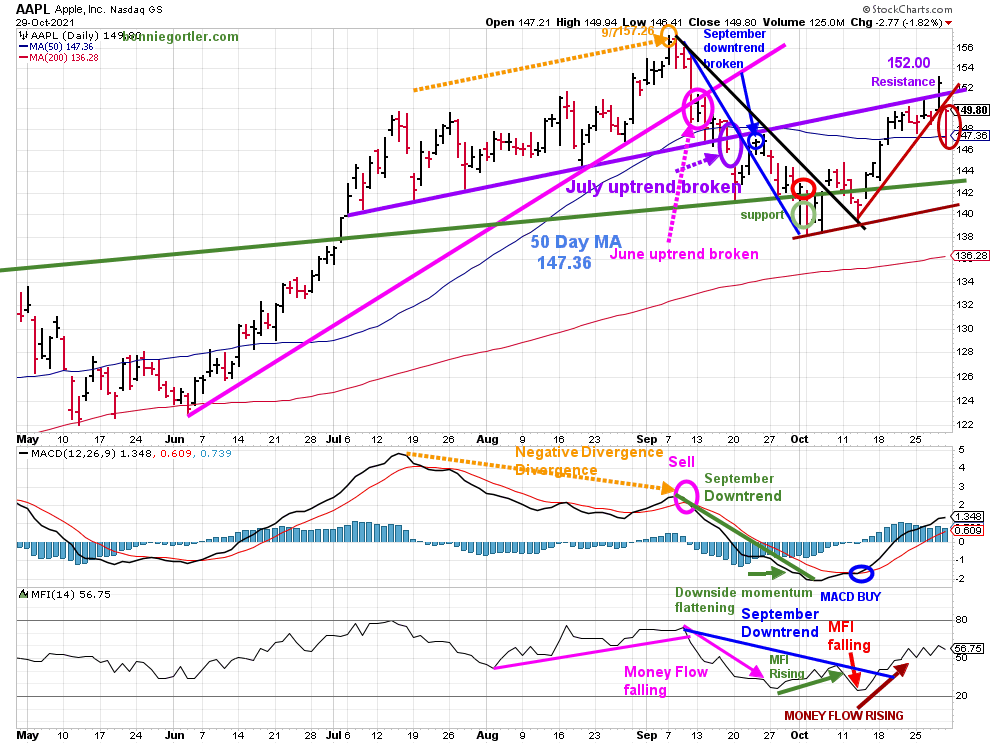
Figure 11: Apple (AAPL) Daily
Source: Stockcharts.com
Apple (AAPL) peaked on 9/7/21 at 157.26 (orange circle). AAPL then declined to fall below its June uptrend (pink circle) and below its 50-day Moving Average in September (purple circle).
AAPL fell on Friday below its 50-Day MA after reporting earnings. AAPL recovered to close at its highs on Friday and above the 50 Day-MA up 0.86% for the week.
MACD (middle chart) remains on a buy (blue circle), but momentum has waned. A turndown would generate a sell.
Money Flow (lower chart) was rising (brown arrow) but now moving sideways.
Support is at 147.00, followed by 143.00 and 140.00. Resistance is 152.00, followed by 157.00.
A close below 140.00 and a MACD sell would be negative.
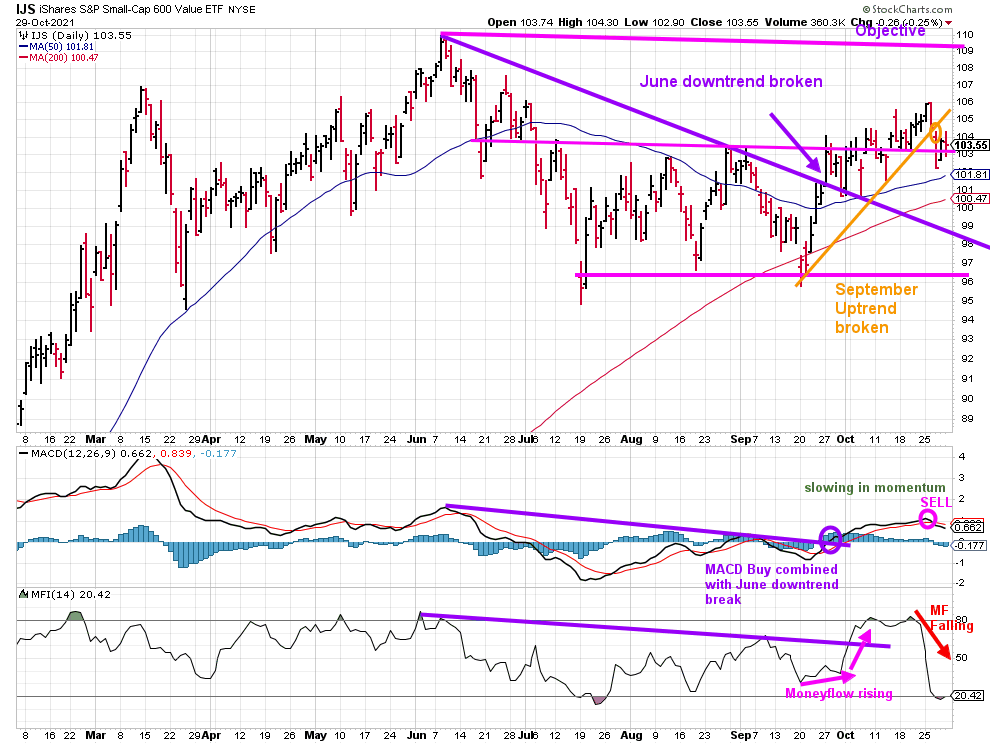
Figure 12: IJS iShares S&P Small-Cap 600 Value
102921 IJS Daily
Source: Stockcharts.com
The iShares S&P Small-Cap 600 Value ETF (IJS) tracks an index of small-cap US stocks that provides exposure to the US small-cap companies that are considered undervalued by the market relative to other companies. The top sectors are Financials Consumer Cyclicals and Industrials.
IJS gave back its previous week’s gains down 1.25%, breaking the September uptrend (orange line).
MACD has generated a sell after breaking the June downtrend but no acceleration in momentum.
Money flow fell sharply quickly. I recommend closing any open positions in IJS.
Watch the strength of Semiconductors for a continuation of the rally or consolidation.
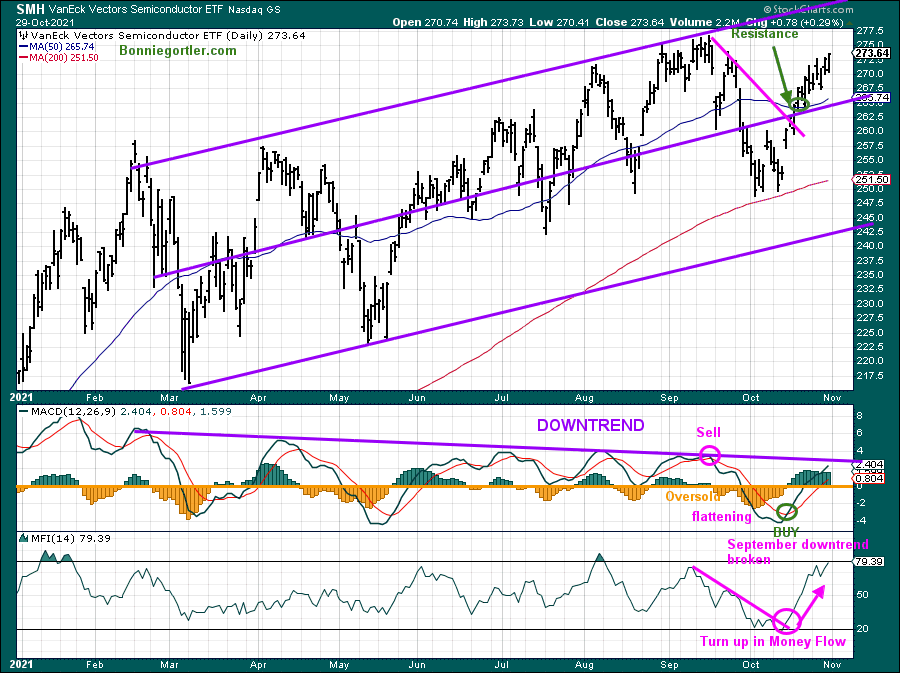
Figure 13: Van Eck Semiconductors (SMH) Daily
102921 SMH Daily
Source: Stockcharts.com
SMH is a leading indicator of the technology sector. In the previous weeks’ update, I wrote for a sustainable rally, Semiconductors (SMH) need to:
All of the above criteria occurred the previous week. Last week SMH led the technology sector higher, up 2.43%.
MACD (middle chart) remains on a timely buy, but momentum has not broken the February downtrend.
Money flow has risen sharply, extended after breaking the September downtrend.
This week it would be bullish if SMH continues to lead, making a new high confirmed by MACD breaking the February downtrend (purple line).
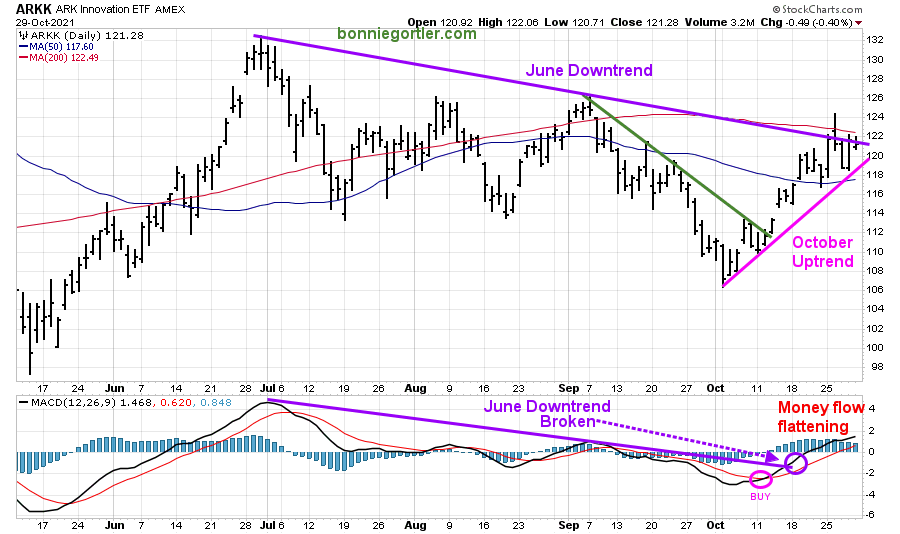
Figure 14: ARKK Innovation
102921 ARK Daily
Source: Stockcharts.com
ARKK, an actively managed ETF by Cathie Wood that seeks long-term growth.
ARKK broke its September short-term downtrend (green line) and rallied. ARKK penetrated the June downtrend and turned down, holding just above the October uptrend (pink line).
Support is at 118.00 followed by 114.00.
MACD is on a buy and has broken the June downtrend.
As long as ARKK closes above 114.00, the bulls will remain in control.
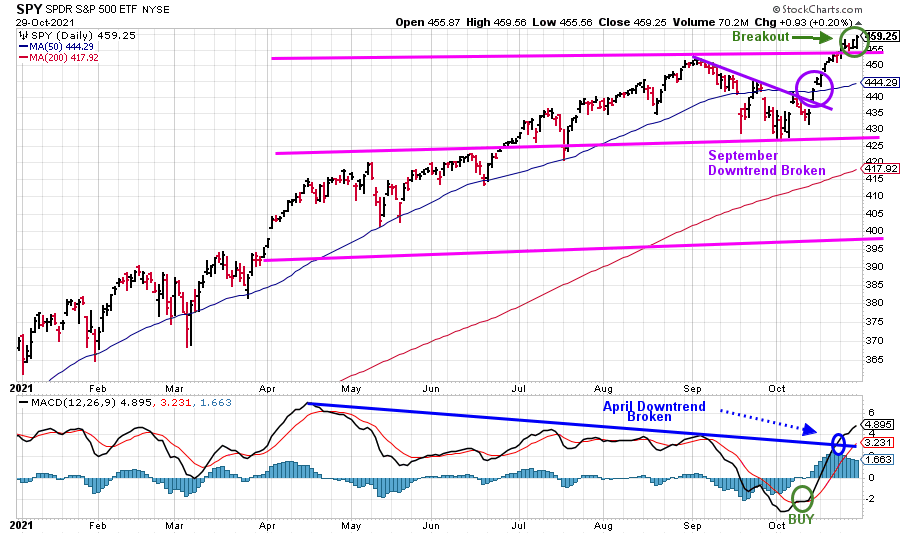
SPDR S&P 500 (SPY) penetrated the upper channel.
New Upside Objectives
Figure 15: SPDR S&P 500 (SPY)
102921 SPY Daily
Source: Stockcharts.com
SPY broke the September downtrend powering to new highs. The S&P 500 (approximately 500 large companies) gave a new upside objective to 480.00.
MACD is on a buy with favorable momentum. Its positive MACD broke the April downtrend and continues to rise, confirming the breakout in SPY.
Summing Up:
The Dow, S&P 500, and Nasdaq closed at record highs. With the recent gains, market sentiment shifted from fear to greed, and short-term technical indicators moved from oversold to overbought, not an immediate sell signal. For now, the tape remains bullish. November and December are a historical seasonally strong time of the year. Nasdaq’s market breadth improved, the NYSE AD line made a new high suggesting the final top has not occurred. However, The Russell 2000 (IWM) is lagging and remains in a trading range. The Valueline Arithmetic Index appeared to have broken out and then weakened. No breadth thrust on the New York Stock Exchange to confirm the major averages highs. Therefore, consolidation may be necessary for the broader market to join the party and lead the averages higher.
Remember to manage your risk, and your wealth will grow.
If you liked this article, you will love my Free Charting Master Class. Get it here:
I would love to hear from you. If you have any questions or comments or would like to talk about the market, click here.
Disclaimer: Although the information is made with a sincere effort for accuracy, it is not guaranteed that the information provided is a statement of fact. Nor can we guarantee the results of following any of the recommendations made herein. Readers are encouraged to meet with their own advisors to consider the suitability of investments for their own particular situations and for determination of their own risk levels. Past performance does not guarantee any future results.


Create more wealth in your life
with these simple strategies.
As an added bonus you will also
receive BG’s Updates and Ezine

Discover how to quickly create more well-being in your life with these simple strategies.
As an added bonus you will also
receive BG’s Updates and Ezine

As an added bonus you will receive BG’s Updates and Ezine

All work listed on BonnieGortler.com is licensed under a Creative Commons Attribution - Noncommercial - No Derivative Works 3.0 Unported License.


Free Report:
Grow and Sustain Your Wealth
Discover how to grow your money with these easy, simple steps.

