

10 Simple Tips for Financial Well-Being
07/01/2026
The tone of the stock market changed last week. Stocks were under heavy selling pressure in a volatile week. Only one of the eleven S&P sectors for the week ending 2/26/21 finished higher. Energy (XLE) gained +4.27% despite closing poorly down -2.37% on Friday. Utilities (XLU) and Consumer Discretionary (XLY) were the weakest sectors losing -4.97% and -4.99 %, respectively. The S&P 500 Index, in comparison, was down -2.48%. The closing bell was a relief for many traders as the Dow closed near session lows on Friday. Even the strongest sectors like banks and energy sold off. Some stocks gave up much of their early gains in the last 10 minutes of trading due to heavy market sell on close orders, option expiration, and end-of-month rebalancing.
S&P SPDR SECTOR ETFs SUMMARY
Week of 2/26/21
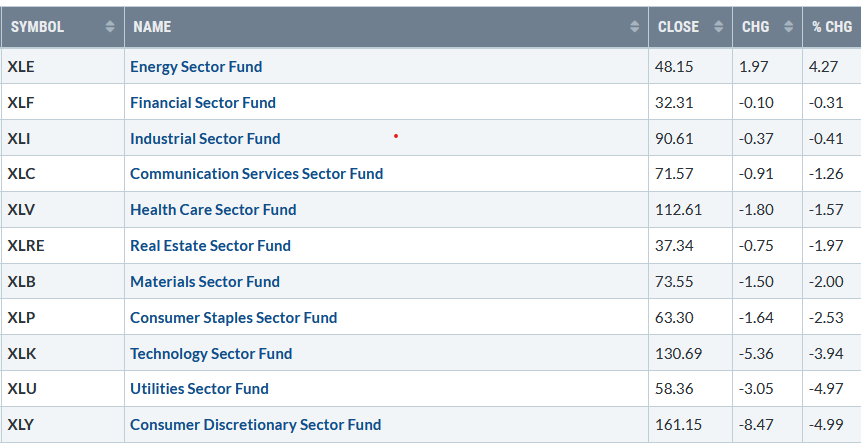
Chart Source: Stockcharts.com
S&P SPDR SECTOR ETFs SUMMARY
Month of February
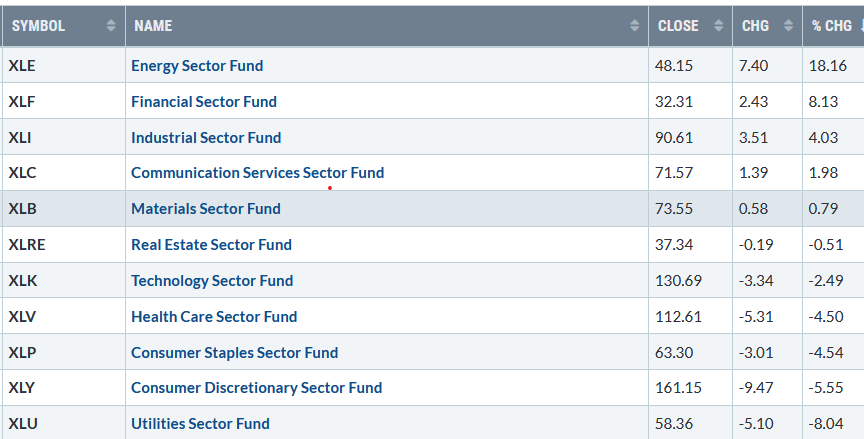 Chart Source: Stockcharts.com
For the month, five of the eleven S&P sectors finished higher with the Energy +18.16% and Financials +8.13% the strongest while Consumer Discretionary (XLY) and Utilities (XLU) were the weakest, down -5.5% and -8.04%, respectively. The Dow, S&P 500, and Nasdaq were all higher for the month. The Dow gained +3.17%, S&P 500 +2.61% and the Nasdaq 0.86%.
Market internals weakened significantly as the week moved on. Traders focused on the 10-year Treasury yields, which rose from 1.34 to 1.60 intraday on 2/25/21, the highest reading in a year, before finally stabilizing and closing at 1.46. The quickness of the yield rising surprised many investors including, economists, analysts who expected the rise, but not until the end of the year, but only in two months. The increase in yields was due to the expectation of higher inflation, options expiration, and portfolios’ rebalancing at the end of the month. All were possible reasons for weakness in stocks, especially growth stocks that were overvalued and had significant gains this year.
The fear-gauge CBOE Volatility Index (VIX) (a contrary indicator) increased again up 26.76%, closing at 27.95 after closing at 22.05 last Friday. As stocks fell, fear rose quickly. It was only a few weeks ago when VIX closed at 19.97 on 2/12/21. This week, it is prudent to watch the 10-year Treasury yields to see if they stabilize or continue to rise.
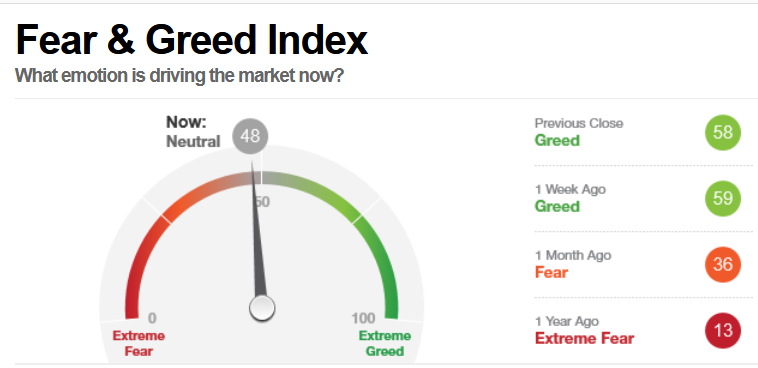
Another measure of investor sentiment is the Fear and Greed Index (a contrary indicator) decreased by 11 points last week to close at a neutral reading of 48. It’s not yet showing high levels of fear from where major bottoms occur. However, it’s a positive sign that investors are more cautious and not showing high levels of greed. If long-term interest rates stop rising and stabilize, a short-term relief rally could be imminent.
CNN Fear and Greed Index
Market internals lost their upside momentum, with last week’s broad decline. Weekly market breadth on the New York Stock Exchange Index was negative, with 1043 advances and 2284 declines. Global markets joined in the slide, falling with the U.S., including the Emerging Markets (EEM), closing near its low in late January. For the week, the Dow lost -1.78%, S&P 500 was down -2.45%, and the Nasdaq lost -4.92%.
Many stocks fell more than the major averages, some three times as much. The S&P 500 and the Nasdaq had their second weekly loss in four weeks while the Dow had its first loss after three up weeks. The Russell 2000, the benchmark for small-cap stocks, a leader of the advance, was down -2.90%, closing below support mentioned on last week’s market wealth update 021921.
“Know what you own, and know why you own it.” – By Peter Lynch
Where do we go from here? Keep an eye on the Russell 2000 Index (IWM) And Nasdaq 100 (QQQ)
Figure 1: Daily iShares Russell 2000 (IWM) Price (Top) and 12-26-9 MACD (Bottom)
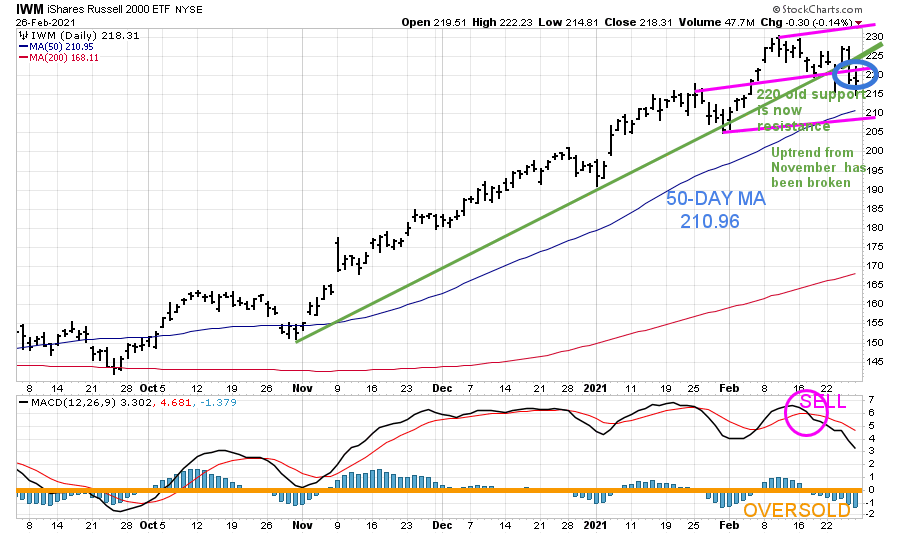
Chart Source: Stockcharts.com
The top portion of the chart is the Daily iShares Russell 2000 Index ETF (IWM)1 with a 50-Day Moving Average (blue line) and 200-Day Moving Average (red line) that traders watch and use to define trends.
On Friday 02/26/21, the IWM closed at 218.31 (blue circle) below its uptrend line for two days, for the first time since last November (green line). IWM closed below support of 220.00, implying the short-term trend is now down. On the other hand, the weekly uptrend (chart not shown) remains in effect until a weekly close below 210.00.
The next support is at the 50-Day Moving Average of 210.96 (blue line), coinciding near the lower channel objective (pink line) at approximately 209.00, a critical key area of support that needs to hold.
The bottom half of the chart is MACD (12, 26, 9), a measure of momentum. MACD remains on a sell (pink circle), at its lowest reading since November. MACD is not yet oversold (orange line) below 0, where a reset and safer entry would be. If IWM falls below 209.00, expect more selling pressure to occur. If IWM can show enough strength early next week to get back above 220.00, which is now resistance, look for the rally to resume and potentially test the old highs.
Figure 2: Weekly iShares Russell 2000 (IWM)
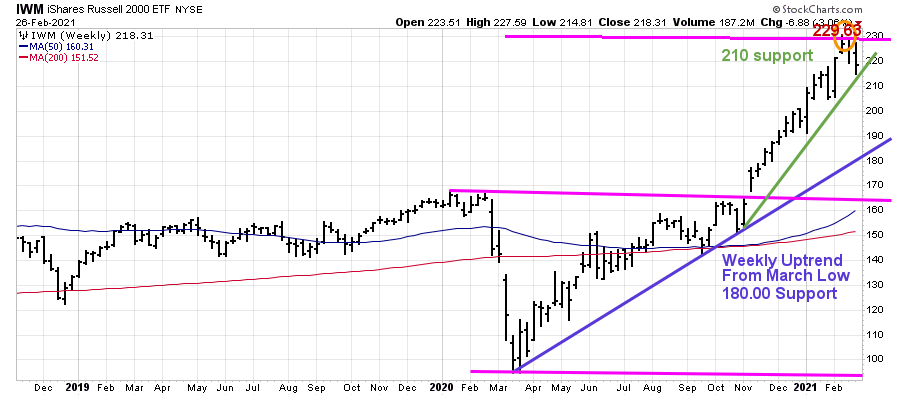
IWM peaked on 2/16/21 at 229.63 (orange circle), hitting its upper weekly channel objective. IWM has two significant up trendlines to track for the intermediate trend.
The weekly uptrend from November (green line) is the first support. The Russell 2000 (IWM) intermediate trend remains intact as long as it holds above the first support at 210.00, which currently aligns with short-term support based on the daily chart (Figure 1).
The other uptrend to watch is from the March lows, where there is support at 180.00 (purple line). IWM has had a powerful advance since the March lows after years of underperformance. A weekly close of IWM below 210.00 would increase the odds of a pullback to 180.00. A weekly close above 230.00 would give a new upside channel objective to 295.00.
Figure: 3 Weekly Invesco QQQ Trust Nasdaq (QQQ) Price (Top) and 12-26-9 MACD (Bottom)
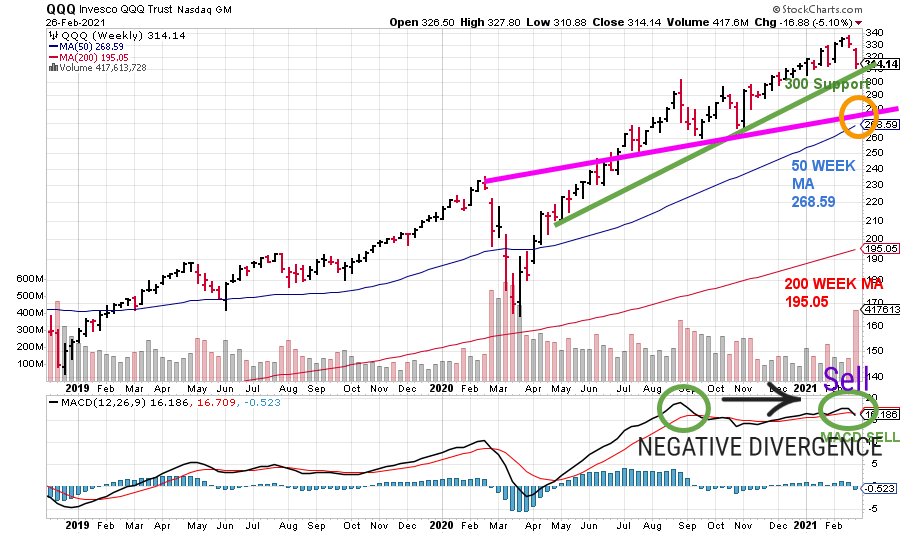
The top part chart shows the daily Invesco (QQQ)2, an exchange-traded fund based on the Nasdaq 100 Index with its 50-Week Moving Average and 200-Week Moving Average.
The weekly uptrend of QQQ from April 2020 (green line) is intact. However, the selling continues, the uptrend is in jeopardy of being broken. A weekly close below 300.00 could increase selling pressure to the 50-Week MA, which stands at 268.59 on 2/26/21, near another key area of support (pink line).
The bottom half of the chart is MACD (12, 26, 9), a measure of momentum. MACD is now on a sell after turning down with a bearish negative divergence (green circles). A negative divergence forms when price makes a higher high, and MACD forms a lower high. The lower high in the MACD implies less upside momentum, a warning sign of a potential shift in the intermediate trend and bears watching.
Summing Up:
A reversal to the downside occurred with all three major U.S. indices were down for the week. 10-year Treasury yields continue to rise, igniting rear among investors. Technology growth stocks fell sharply. Small-cap stocks, which have been leaders, joined in the decline, closing below their daily uptrend line for the first time since last November.
I am concerned about the weakness in intermediate momentum indicators that I follow that are starting to give warning signals that a more severe decline may occur. Although I am worried about the intermediate trend and increased risk, a reflex rally is possible because of the short-term oversold condition that I see on the hourly charts. For now, I am giving the benefit of the doubt to the bulls as I was encouraged by the Nasdaq being able to close positive last Friday and the 10-year Treasury yields falling from their intra-week high. The key numbers to watch to imply more selling and lower objectives are a weekly close below 210.00 for IWM and QQQ below 300.00.
1 The iShares Russell 2000 Index ETF (IWM) comprises companies with a market capitalization of between $300 million and $2 billion. The portfolio top 5 sector holdings as of 2/26/21 are Financials 21.17%, Health Care 20.44%, Technology 14.94%, Consumer Cyclicals 14.31%, and Industrials 13.21%, totaling 84.07% https://www.etf.com/IWM.
2The QQQ includes 100 of the largest domestic and international nonfinancial companies listed on the Nasdaq. As of 2/26/21, the top holdings are Apple (AAPL) 11.33%, Microsoft Corp (MSFT) 9.38%, Amazon.com Inc. (AMZN) 8.44%, Tesla Inc (TSLA) 4.43%, Alphabet Inc. Class C (GOOG) 3.60%, Facebook Inc. Class A (FB) 3.31%, and Alphabet Inc. Class A (GOOGL) 3.27%, totaling 43.76.
Source: https://www.etf.com/QQQ#overview
I would love to hear from you. If you have any questions or comments, click here.
If you liked this article, you would love my Free report, Grow and Sustain Your Wealth. Please get it here
Disclaimer: Although the information is made with a sincere effort for accuracy, it is not guaranteed that the information provided is a statement of fact. Nor can we guarantee the results of following any of the recommendations made herein. Readers are encouraged to meet with their own advisors to consider the suitability of investments for their own particular situations and for determination of their own risk levels. Past performance does not guarantee any future results.


Create more wealth in your life
with these simple strategies.
As an added bonus you will also
receive BG’s Updates and Ezine

Discover how to quickly create more well-being in your life with these simple strategies.
As an added bonus you will also
receive BG’s Updates and Ezine

As an added bonus you will receive BG’s Updates and Ezine

All work listed on BonnieGortler.com is licensed under a Creative Commons Attribution - Noncommercial - No Derivative Works 3.0 Unported License.


Free Report:
Grow and Sustain Your Wealth
Discover how to grow your money with these easy, simple steps.

