

10 Simple Tips for Financial Well-Being
07/01/2026
An encouraging week for stocks. All eleven S&P sectors rose for the week ending 3/12/21. Consumer Discretionary (XLY) and Real Estate (XLRE) lead the way after being the worst sector the previous week, up +6.34% and +5.94 %, respectively. Healthcare and Energy (XLE) were the weakest sectors, up +1.40% and 1.17%, respectively. The SPDR S&P 500 ETF Trust (SPY), in comparison, gained +2.72%.
S&P SPDR SECTOR ETFs SUMMARY
Week of 3/12/21
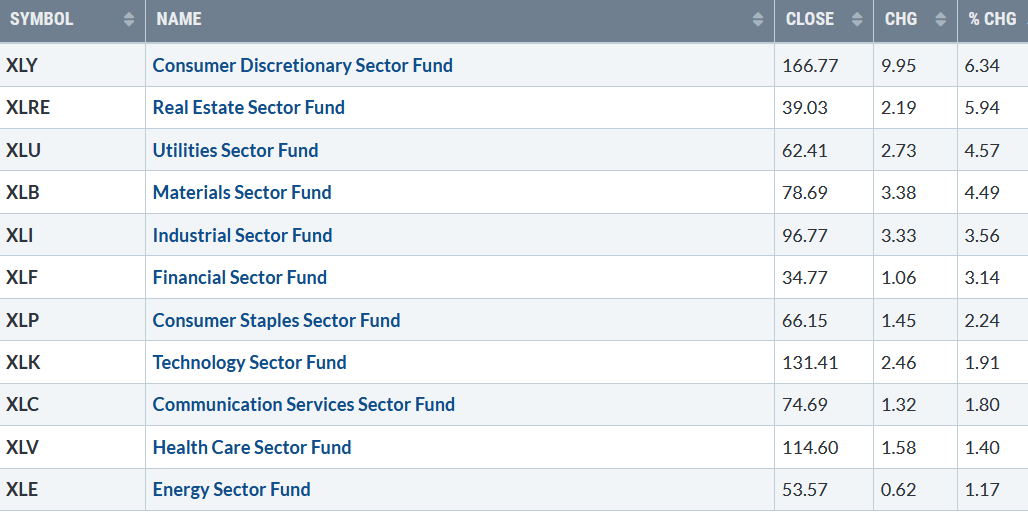
Source: Stockcharts.com
On Friday, 3/12, Dow, Russell 2000, and S& P 500 closed at record highs with Nasdaq down but closed near the high of the day. 10-Year Treasury yields closed at 1.635%, the highest level of 2021. The CBOE Volatility Index (VIX), fear-gauge (a contrary indicator), closed at 20.69, its lowest level since 2/12 at 19.97.
The Fear and Greed Index, another measure of investor sentiment (a contrary indicator), I watch, rose by 8 points last week, changing from a neutral reading of 51 to end the week at 59, now showing greed. As the averages move higher, it’s a positive sign that the index is not showing extreme greed.
CNN Fear and Greed Index

Source: CNN
Market internals improved last week. Weekly market breadth on the New York Stock Exchange Index was positive, with 2738 advances and 619 declines, and Nasdaq positive with 2048 advances and 1291 declines. For the week, the Dow gained +4.07%, up six days in a row, the S&P 500 was up +2.64%, and the Nasdaq gained +3.09%, avoiding its fourth straight weekly decline. Some growth stocks with high valuations that fell rebounded sharply.
Figure 1: Nasdaq New Lows
 Source: Stockcharts.com
After a peak reading of over 300 new lows on 3/4/21 with last week’s rally, new lows contracted sharply to under 30 as downside pressure subsided.
On 3/5, as mentioned in the Wealth update 03/05/21, it was indeed a positive sign a reversal occurred when the news lows on the Nasdaq didn’t expand. (see chart above). Also, the volume indicator that I follow, which was in a deeply oversold condition, turned up generating a buy confirming the selling would subside, and the decline had likely ended.
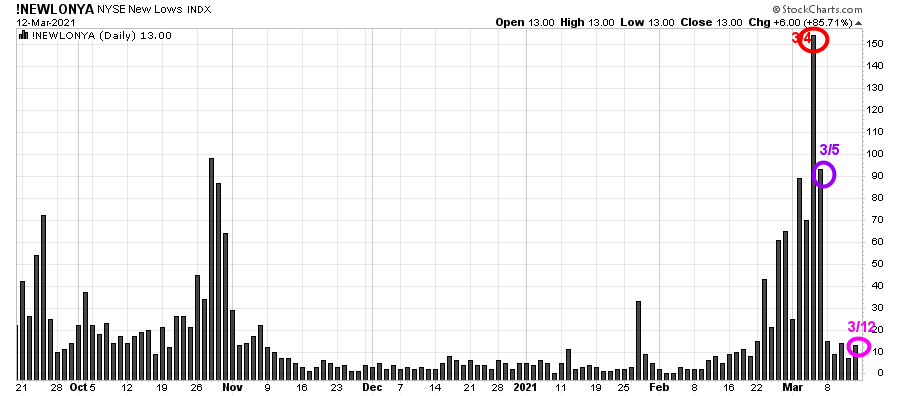
Figure 2: New York Stock Exchange New Lows
Source: Stockcharts.com
Another sign the weakness would end last week, and the advance would rally was the new lows on the New York Stock Exchange peaked just over 150 and immediately contracted instead of expanding. Watching the New lows on the New York Stock exchange is a helpful tool.
In my book Journey to Wealth, when new lows are above 150, the market is negative, higher risk, and selling is taking place. The recent new lows never reached a reading over 200, where there could be some panic selling. However, the new lows immediately contracted to fall below 25, implying the market is very strong and prices tend to rise. On 3/12, there were only 12 new lows (circled in pink), indicating the market is internally very strong and has a bullish bias with low risk.
“What you get by achieving your goals Is not as important as what you become by achieving your goals” -Henry David Thoreau
Where do we go from here? Watch Russell 2000 Index (IWM) And Nasdaq 100 (QQQ) for direction.
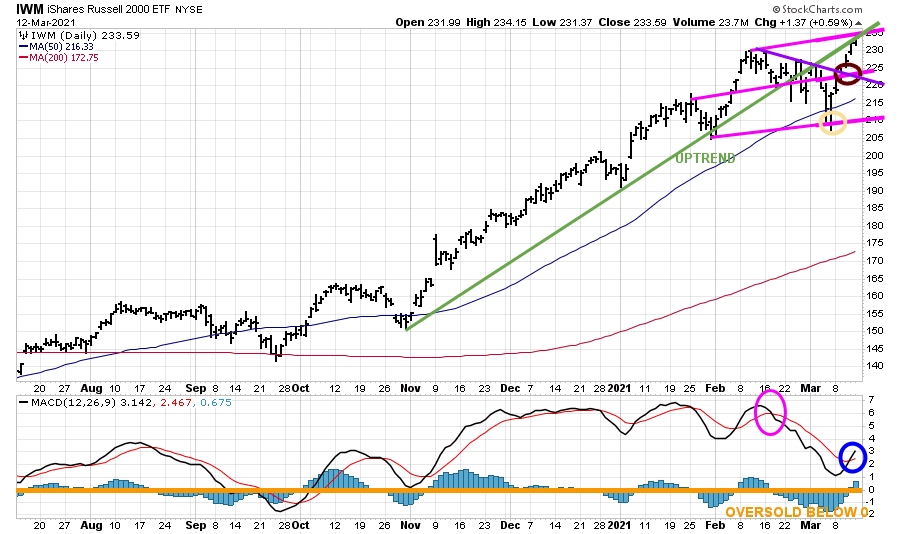
Figure 3: Daily iShares Russell 2000 (IWM) Price (Top) and 12-26-9 MACD (Bottom)
Source: Stockcharts.com
The top portion of the chart is the daily iShares Russell 2000 Index ETF (IWM) with a 50-Day Moving Average (blue line) and 200-Day Moving Average (red line) that traders watch and use to define trends.
The Russell 2000, the benchmark for small-cap stocks, shows relative strength vs. the major averages gaining 7.32% last week. After slightly penetrating the bottom of the channel at 209.00 and going through the 50-Day Moving Average (yellow circle), IWM resumed its advance.
IWM broke the daily downtrend (purple line) penetrating resistance at 220.00 mentioned last week in the Market Wealth update 030521. Buy stops hit (brown circle), and IWM had immediate follow-through towards the top of the channel at 235.00, with a high of 234.15 before closing at 233.59.
The bottom half of the chart is MACD (12, 26, 9), a measure of momentum. MACD generated a sell (pink circle), but on the decline did not get below 0, an oversold condition (orange line) where a proper reset and buy would occur before turning up (blue circle). Be alert to the slope of the rise in the future and a potential negative divergence that may form if IWM stalls.
IWM is now in a critical area. Notice how IWM stalled at the old uptrend line from November (in green). A close above 235.00 would imply another leg up to potentially 260.00. It’s worth noting the weekly chart has given a higher objective. See chart below. On the other hand, a close below 220.00 would imply a test of the March 4 low.
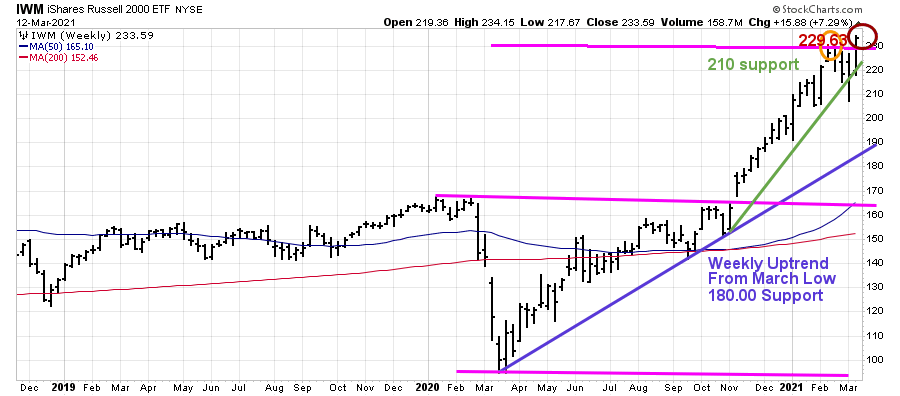
Figure 4: Weekly iShares Russell 2000 (IWM)
Source: Stockcharts.com
IWM (Figure 4) peaked on 2/16/21 at 229.63 (orange circle), hitting its upper weekly channel objective.
Last week the weekly uptrend from November (green line) was breached as sell stops occurred after IWM fell below support at 210.00 but closed above the up trendline at 217.71, a positive sign the rally would resume. IWM closed on 3/12 above the channel, a potential breakout implying significant gains are likely, a new upside channel objective to 295.00. It would ideal if IWM stays above 230.00 on any short-term retracement.
A weekly close below 207.21 on IWM (03/05/21 low) would negate the bullish outlook and increase the odds of a pullback to 180.00 (purple line).
Figure: 5 Weekly Invesco QQQ Trust Nasdaq (QQQ) Price (Top) and 12-26-9 MACD (Bottom)
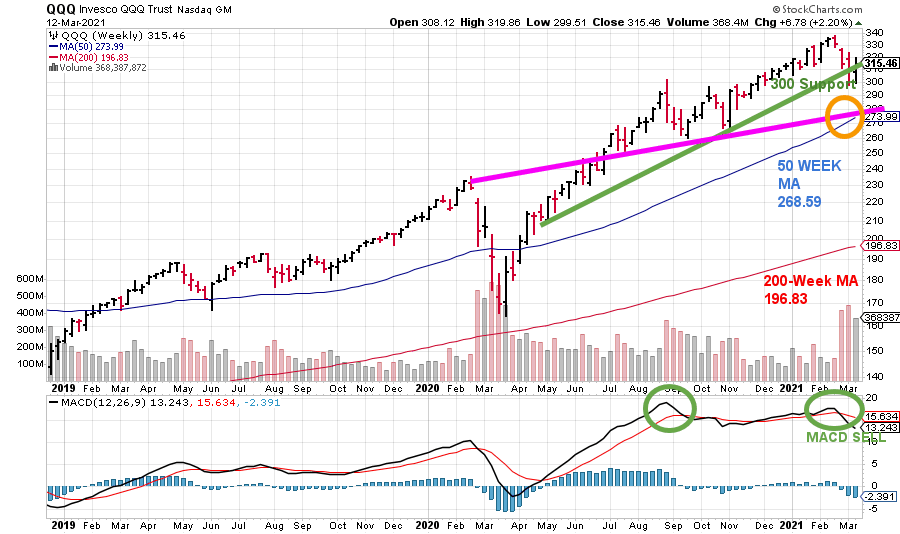
Source:Stockcharts.com
The top part of the chart shows the Weekly Invesco QQQ, an exchange-traded fund based on the Nasdaq 100 Index with its 50-Week Moving Average and 200-Week Moving Average.
The weekly uptrend of QQQ from April 2020 (green line) was slightly violated on the decline but closed above the critical 300.00 support level. A weekly close below 300.00 is likely to increase selling pressure to the 50-Week MA, which stands at 273.99, aligning with another key weekly support area (orange circle).
The bottom half of the chart is MACD (12, 26, 9, a measure of momentum. MACD remains on a sell (right green circle) after turning down with a bearish negative divergence. A negative divergence forms when price makes a higher high, and MACD forms a lower high. The lower high in the MACD implies less upside momentum and a change in the intermediate trend to down.
The good news is the decline earlier in the month made MACD oversold in the short-term, increasing the odds of another rally attempt towards the old highs (see Figure 6 below).
Figure: 6 Daily Invesco QQQ Trust Nasdaq (QQQ) Price (Top) and 12-26-9 MACD (Bottom)
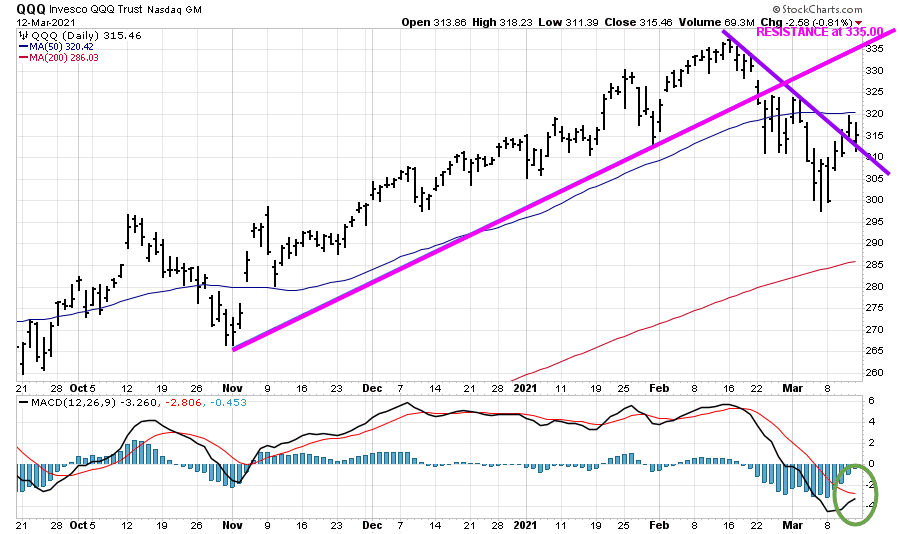
Source: Stockcharts.com
The top part of the chart shows the daily Invesco QQQ, an exchange-traded fund based on the Nasdaq 100 Index with its 50-Day Moving Average and 200-Day Moving Average.
The Daily uptrend of QQQ from November (pink line) was violated in February (green circle). This past week the downtrend (purple line) was broken, a positive sign. On 03/12, QQQ fell to test the down trend line and turned up closing at 315.46. A close above the 50-Day Moving Average of 320.42 would be bullish for the short term and likely trip the buy stops. Resistance is between 330.00 and 335.00.
The bottom half of the chart is MACD (12, 26, 9, a measure of momentum. MACD remains on a sell (green circle) below 0, in an oversold condition. Further gains in QQQ would generate a new MACD buy.
Summing Up:
Selling pressure subsided despite 10-year Treasury yields closing at their highest level in 2021. Investors stepped in to buy growth stocks at discounted prices igniting a broad rally where the S&P 500 and Dow ended at record highs. It’s a positive sign the week ended above key support and above key areas of resistance.
I continue to give the benefit of the doubt to the bulls. A close above the 50-Day Moving Average of 320.42 for the QQQ would be bullish in the near term. A close above 235.00 on (IWM) would imply further strength in small-cap stocks.
On the other hand, more selling and lower objectives are likely if there is a weekly close below 207.21 for IWM and below 300.00 for QQQ. Remember to manage your risk, and your wealth will grow.
I would love to hear from you. If you have any questions or comments, click here.
If you liked this article, you would love my Free report, Grow and Sustain Your Wealth. Please get it here

Disclaimer: Although the information is made with a sincere effort for accuracy, it is not guaranteed that the information provided is a statement of fact. Nor can we guarantee the results of following any of the recommendations made herein. Readers are encouraged to meet with their own advisors to consider the suitability of investments for their own particular situations and for determination of their own risk levels. Past performance does not guarantee any future results.


Create more wealth in your life
with these simple strategies.
As an added bonus you will also
receive BG’s Updates and Ezine

Discover how to quickly create more well-being in your life with these simple strategies.
As an added bonus you will also
receive BG’s Updates and Ezine

As an added bonus you will receive BG’s Updates and Ezine

All work listed on BonnieGortler.com is licensed under a Creative Commons Attribution - Noncommercial - No Derivative Works 3.0 Unported License.


Free Report:
Grow and Sustain Your Wealth
Discover how to grow your money with these easy, simple steps.

