

10 Simple Tips for Financial Well-Being
07/01/2026
Rising 10-Year Treasury yields sparked heavy selling pressure in Nasdaq stocks. However, the market finished a volatile week on a happy ending with an upside reversal in the major averages closing near their session highs on Friday. Eight of the eleven S&P sectors for the week ending 3/05/21 were higher. Energy (XLE) gained +9.97%, closing strongly up +3.74% on Friday. Real Estate (XLRE) and Consumer Discretionary (XLY) were the weakest sectors losing -1.34% and -2.69 %, respectively. The SPDR S&P 500 ETF Trust, in comparison, was up 0.86%.
S&P SPDR SECTOR ETFs SUMMARY
Week of 3/05/21
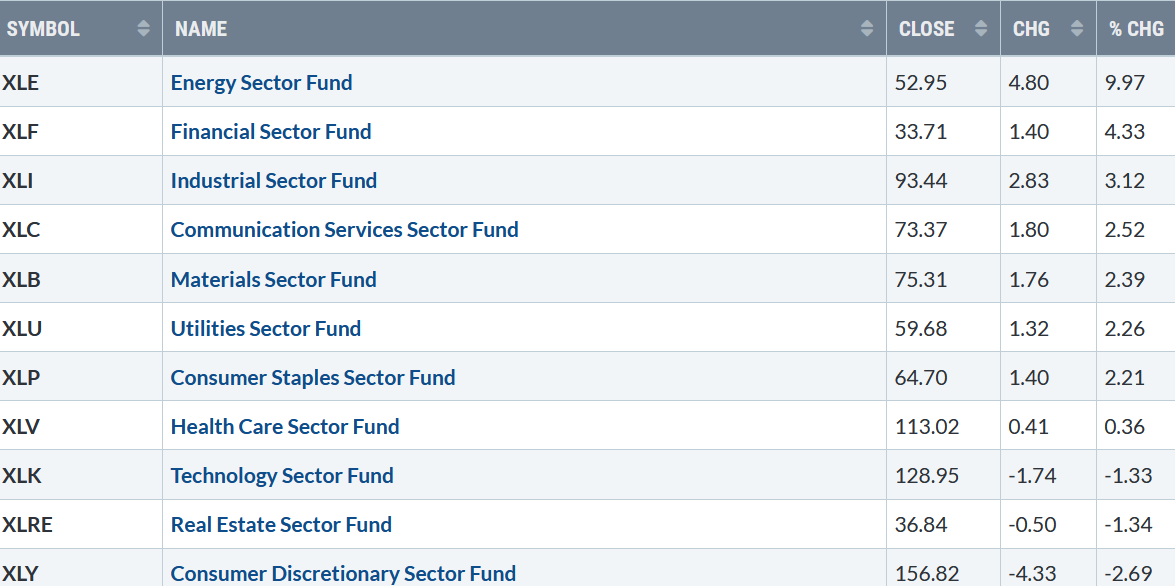
Source: Stockcharts.com
The major averages reversed to the upside ending a three-day losing streak. After a strong jobs report on Friday,10-Year Treasuries made a high of 1.626% in the morning, the highest level of 2021, before finally stabilizing and closing at 1.554. Before establishing new investments, it is prudent to watch the 10-year Treasury yields to see if they stabilize or rise above the intra-week high to manage your risk. Rising rates are likely to put further pressure on stocks.
On 3/4, when Treasury yields spiked, the CBOE Volatility Index (VIX), fear-gauge (a contrary indicator) rose to the highest level in five weeks, causing traders’ nervousness to sell stocks aggressively. A positive sign in the future is VIX fell -13.7%, closing at 24.66.
Another measure of investor sentiment is the Fear and Greed Index (a contrary indicator) rose only by 3 points last week, remaining at a neutral reading of 51. It’s worrisome that it’s not yet showing high levels of fear from where major bottoms occur.
CNN Fear and Greed Index
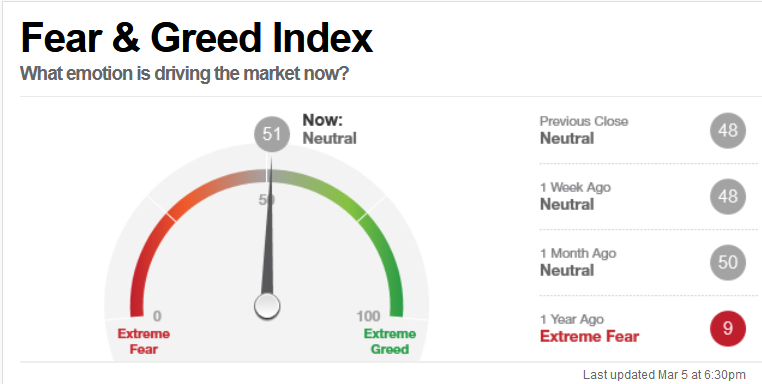
Source CNN.com
Last week market internals was mixed. Weekly market breadth on the New York Stock Exchange Index was positive, with 2048 advances and 1291 declines. However, the weekly market breadth on the Nasdaq was negative 1043 advances and 2284 declines.
For the week, the Dow gained +1.82%, S&P 500 was up +0.81, and the Nasdaq was the big loser, down -2.08%. The week closed on Friday with the major averages closing near session highs, higher for the first time in 4 trading sessions. The Dow had its best weekly performance since early February. Relative strength remains focused in Energy (XLE), Financials (XLF), Materials (XLB), and the Industrial (XLI) sectors.
On the other hand, an ugly week for Nasdaq, its third straight weekly decline. Growth stocks with high valuations that previously led the market higher pulled back sharply, with some stocks falling over -15.0% in one day and lower by 30% or more in the last three weeks. Nasdaq traded -12.5% below its all-time high on 2/16/21 before buyers stepped in.
Nasdaq New Lows
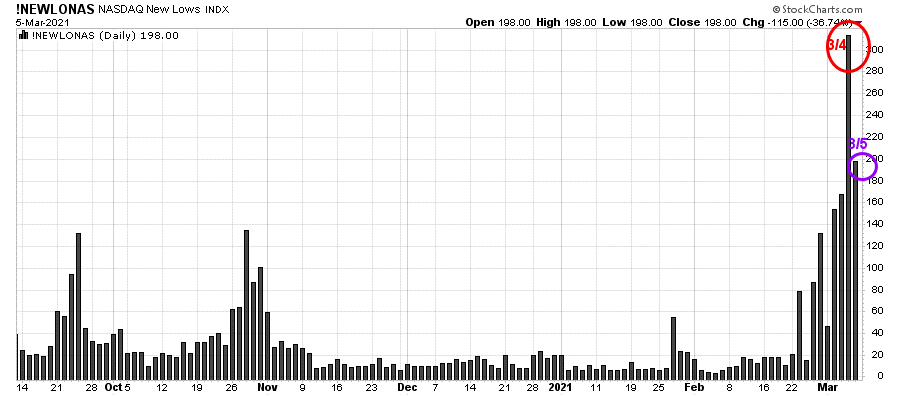
A positive sign the reversal to the upside could continue is, it was the first day in a week that new lows on the Nasdaq didn’t expand. (See chart above)
Also, a volume indicator that I follow on the Nasdaq is very oversold and shows improving momentum. Over the next several days, if there is net positive up to downside volume, a buy will occur, confirming the recent decline has likely ended.
“We don’t have to be smarter than the rest, we have to be more disciplined than the rest.” ~Warren Buffet
Where do we go from here? Keep an eye on the Russell 2000 Index (IWM) And Nasdaq 100 (QQQ)
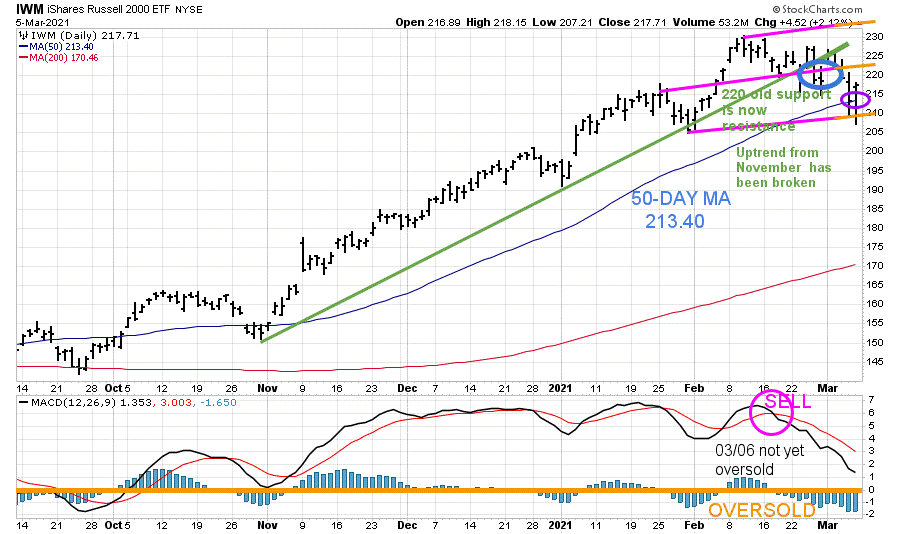
Figure 1: Daily iShares Russell 2000 (IWM) Price (Top) and 12-26-9 MACD (Bottom)

Source: Stockcharts.com
The Russell 2000, the benchmark for small-cap stocks, a leader of the advance, finished the week down only -0.40%. Russell 2000 (IWM) penetrated 209.00. The daily support area mentioned in last week’s market wealth update 022621, with a low of 207.21 but closed above the weekly channel support at 210.00 with Friday’s upside reversal to close above 217.71. (See Figure 1)
The top portion of the chart is the daily iShares Russell 2000 Index ETF (IWM) with a 50-Day Moving Average (blue line) and 200-Day Moving Average (red line) that traders watch and use to define trends.
On Friday 02/26/21, the IWM closed at 218.31 (blue circle) below its uptrend line for two days, for the first time since last November (green line), shifting the short-term trend to down.
IWM struggled to get through old support at 220.00, which is now acting as resistance. IWM fell below the 50-Day Moving Average (purple circle), only slightly penetrating the lower channel objective at 209.00, making an intraday low of 217.71 (pink/orange line). IWM then reversed sharply to close above both the 50-Day Moving Average and the lower channel.
The bottom half of the chart is MACD (12, 26, 9), a measure of momentum. MACD remains on a sell (pink circle), at its lowest reading since November. MACD is not yet oversold (orange line) and below 0, where a reset and safer entry would be.
If IWM closes below 207.21, last week’s low, expect the sell stops to be hit and potentially a more severe decline to occur. If IWM can show enough strength to close above 220.00, which is now resistance, look for the rally to resume and potentially test the old highs.
Figure 2: Weekly iShares Russell 2000 (IWM)
Source: Stockcharts.com
IWM (Figure 2) peaked on 2/16/21 at 229.63 (orange circle), hitting its upper weekly channel objective.
IWM has had a powerful advance since the March lows after years of underperformance. The weekly uptrend from November (green line) was breached as sell stops were hit below 210.00 support, but IWM closed above up the trendline at 217.71, which is bullish. A close below would imply weakness to the March lows’ uptrend, where there is support at 180.00 (purple line).
A weekly close below 207.21 on IWM (03/05/21 low), would increase the odds of a pullback to 180.00. A weekly close above 230.00 would give a new upside channel objective to 295.00.
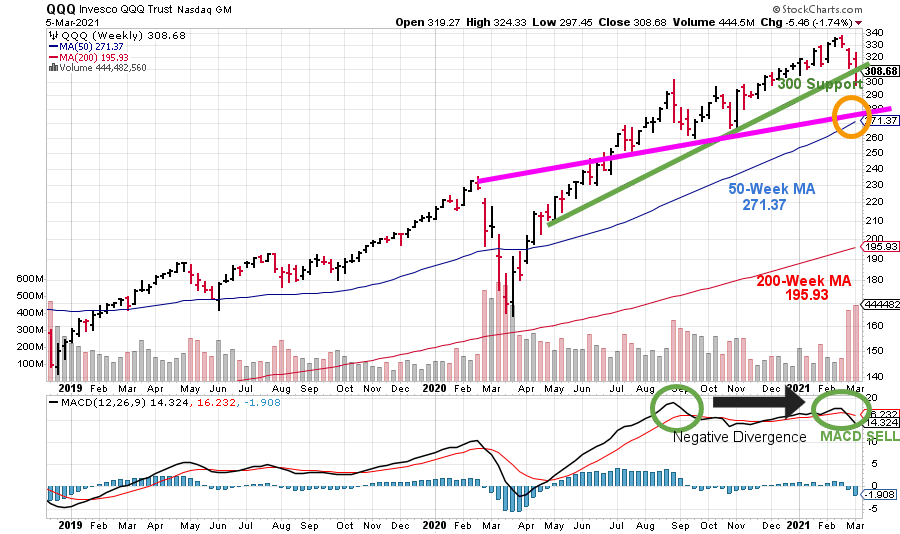
Figure: 3 Weekly Invesco QQQ Trust Nasdaq (QQQ) Price (Top) and 12-26-9 MACD (Bottom)
Source: Stockcharts.com
The top part of the chart shows the daily Invesco QQQ, an exchange-traded fund based on the Nasdaq 100 Index with its 50-Week Moving Average and 200-Week Moving Average.
The weekly uptrend of QQQ from April 2020 (green line) was slightly violated with last week’s decline but remained intact, closing at 308.68 above the critical 300.00 support level. A weekly close below 300.00 could increase selling pressure to the 50-Week MA, which stands at 271.57 on 3/2/21, near another key area of support (pink line).
The bottom half of the chart is MACD (12, 26, 9, a measure of momentum. MACD remains on a sell (right green circle) mentioned last week’s market wealth update 022621 after turning down with a bearish negative divergence. A negative divergence forms when price makes a higher high, and MACD forms a lower high. The lower high in the MACD implies less upside momentum, a warning sign of a potential shift in the intermediate trend and bears watching.

Summing Up:
10-year Treasury yields rose again, igniting fear among investors to dump stocks with high valuations. Technology stocks were crushed. However, with the decline, much of the overvaluation in the Nasdaq has been alleviated. If long-term interest rates stop rising and stabilize, a short-term relief rally could be imminent. It’s a positive sign the week ended with an upside reversal on the major averages on Friday, closing near their highs of the day and above key support levels. For now, I continue to give the benefit of the doubt to the bulls. The key numbers to watch to imply more selling and lower objectives are a weekly close below 207.21 for IWM and QQQ below 300.00. Remember, manage your risk, and your wealth will grow.
I would love to hear from you. If you have any questions or comments, contact me here
If you liked this article, you would love my Free report, Grow and Sustain Your Wealth. Please get it here

Disclaimer: Although the information is made with a sincere effort for accuracy, it is not guaranteed that the information provided is a statement of fact. Nor can we guarantee the results of following any of the recommendations made herein. Readers are encouraged to meet with their own advisors to consider the suitability of investments for their own particular situations and for determination of their own risk levels. Past performance does not guarantee any future results.


Create more wealth in your life
with these simple strategies.
As an added bonus you will also
receive BG’s Updates and Ezine

Discover how to quickly create more well-being in your life with these simple strategies.
As an added bonus you will also
receive BG’s Updates and Ezine

As an added bonus you will receive BG’s Updates and Ezine

All work listed on BonnieGortler.com is licensed under a Creative Commons Attribution - Noncommercial - No Derivative Works 3.0 Unported License.


Free Report:
Grow and Sustain Your Wealth
Discover how to grow your money with these easy, simple steps.

