

10 Simple Tips for Financial Well-Being
07/01/2026
Six of the eleven S&P sectors finished higher for the week ending 06/11/21, all stronger than the SPDR S&P 500 ETF Trust (SPY) +0.40%. Healthcare (XLV) and Real Estate (XLRE) were the leading sectors, +2.01%, and +1.97%. Materials (XLB) and Financials (XLF) were the weakest sectors, down -2.04% and -2.37%.
S&P SPDR Sector ETFs Performance Summary
Week Ending 6/11/21
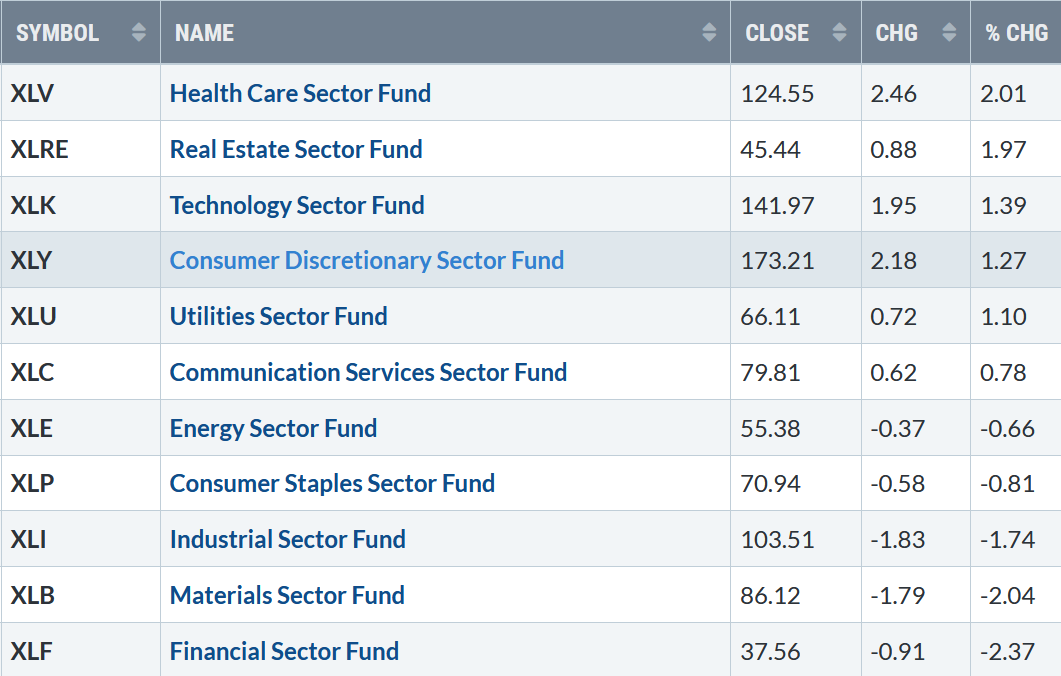
Source: Stockcharts.com
10-Year Treasury yields plunged last week, closing at 1.462%, falling below its recent trading range (pink circle), its lowest level since early March (See Figure 1) as inflation concerns waned.
Yields closing below 1.53% helped fuel growth stocks and hurt the financial sector. A further decline is likely to attract more buying into Nasdaq and some profit-taking in financials. Yields could fall to 1.27% over the next several months unless rates close above 1.635%, a warning sign that rates are likely to rise.
Figure 1: 10-Year Treasury Yields
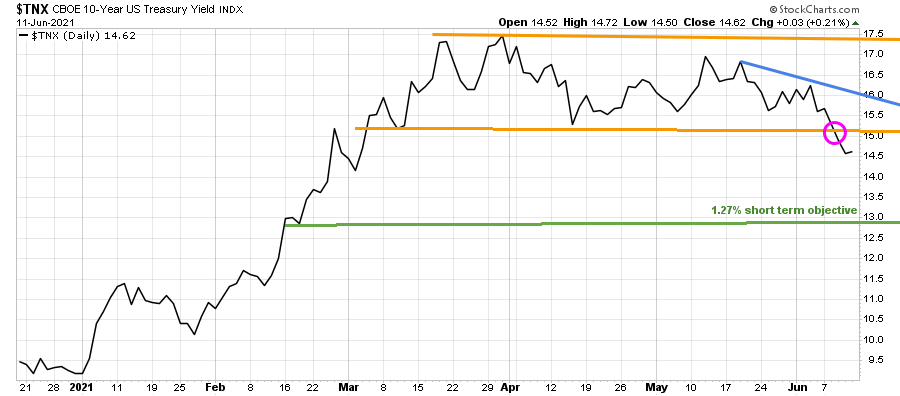
Source: Stockcharts.com
Healthcare, Real Estate, and Technology stocks were the leaders last week. The Dow lost -0.80%, S&P 500 up +0.41%, Nasdaq was up +1.85%, it’s fourth straight weekly gain. The Russell 2000 index was the star performer rising +2.16%.
Weekly market breadth was solid for the fourth week in a row. Both the Nasdaq and New York Stock Index (NYSE) had more stocks up than down. The New York Stock Exchange Index had 2240 advances and 1258 declines. Nasdaq had 3094 advances and 1453 declines. New lows on the NYSE remained under 20, implying low risk and more gains ahead.
Figure 2: Daily New York Stock Exchange (NYSE) New Lows
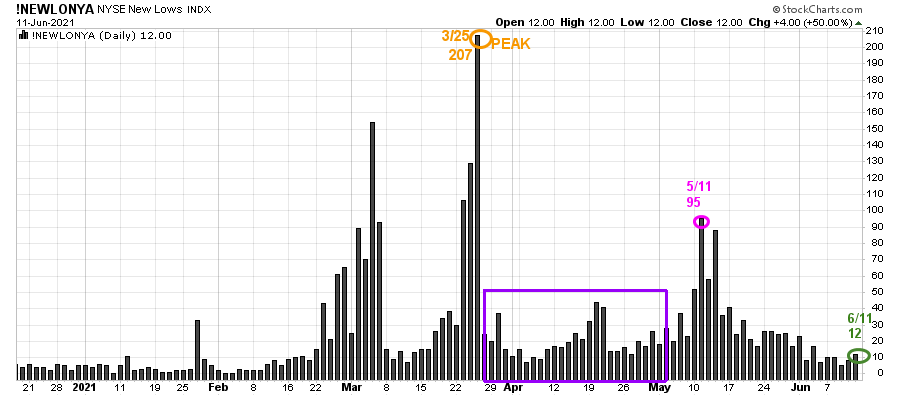 Source: Stockcharts.com
On 3/25, the NYSE New Lows peaked at 207 (orange circle) and immediately contracted (purple rectangle).
On 5/11, New lows on NYSE jumped to 95, their highest level since late March flashing a warning sign, but New Lows immediately dropped. Since 6/2, New Lows have been under 25, showing healthy underlying internal strength. New Lows closed at 12 (green circle) on 6/11.
Watching New lows on the New York Stock exchange is a simple technical tool that helps awareness about the immediate trend’s direction. In my book, Journey to Wealth, when the New Lows are below 25, the market is very strong (Very Low Risk and prices tend to rise). When New Lows are between 25 and 50, risk is low, and the odds of a further rally are likely.
If New Lows begin to expand and have a succession of days over 95 (the 5/11 high) will imply more risk and a shift in trend. On the other hand, if they remain low, the odds favor the advance will continue.
No price is too low for a bear or too high for a bull. – Unknown
ETFs to Monitor
Figure 3: Performance week of 6/4 – 06/11
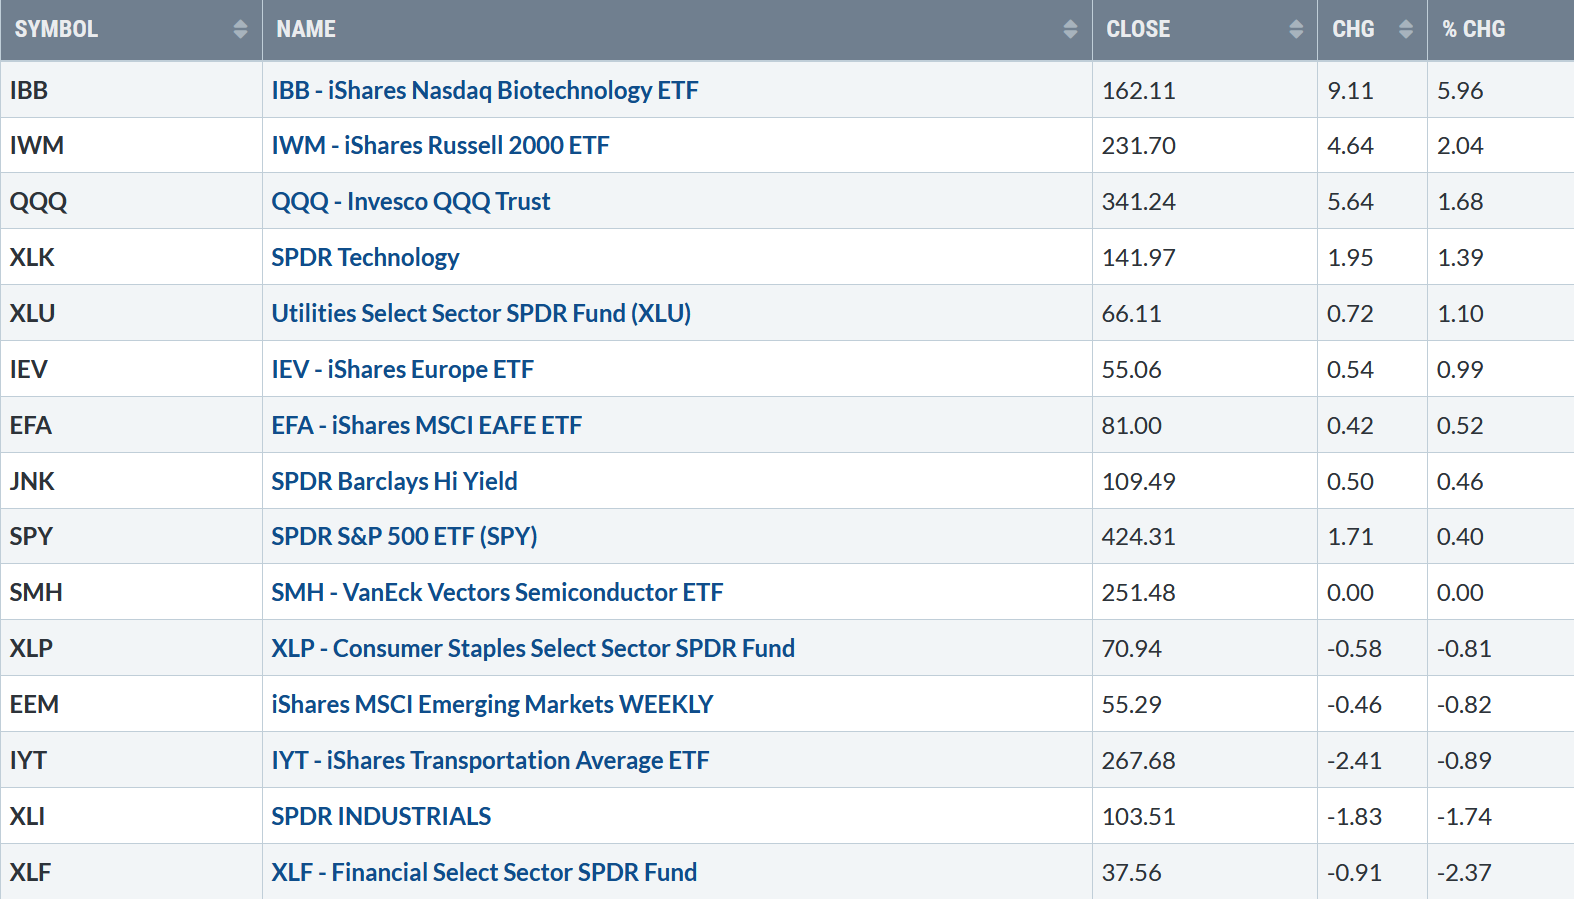
Source: Stockcharts.com
Positives
Negatives
Figure 4: LORD Abbett High Yield Fund
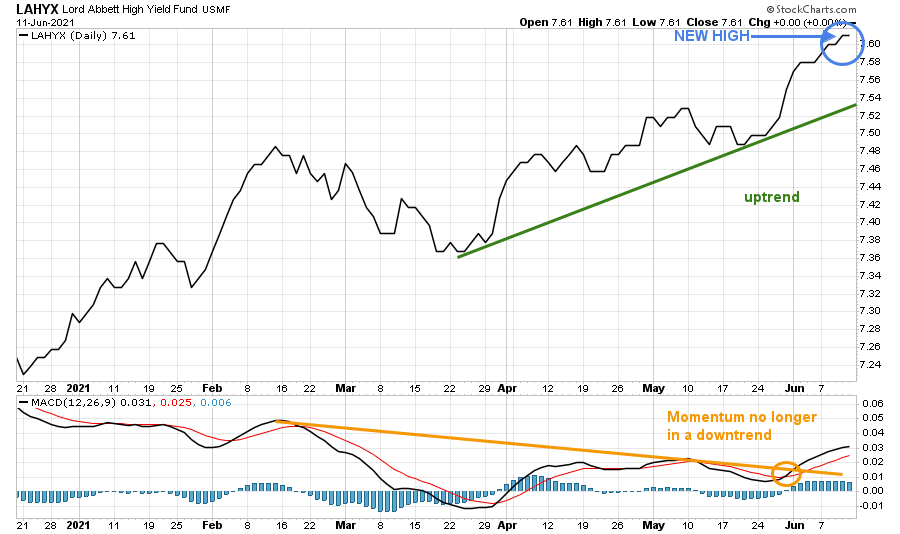 Source: Stockcharts.com
Figure 5: The Nasdaq Advance-Decline Line
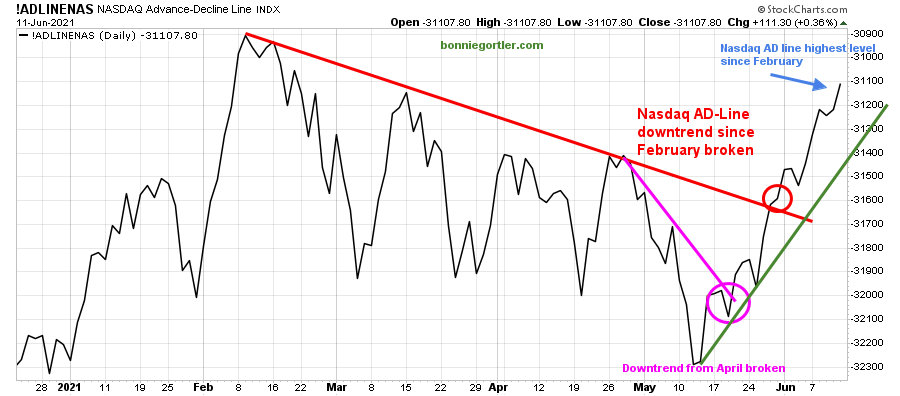
Source: Stockcharts.com
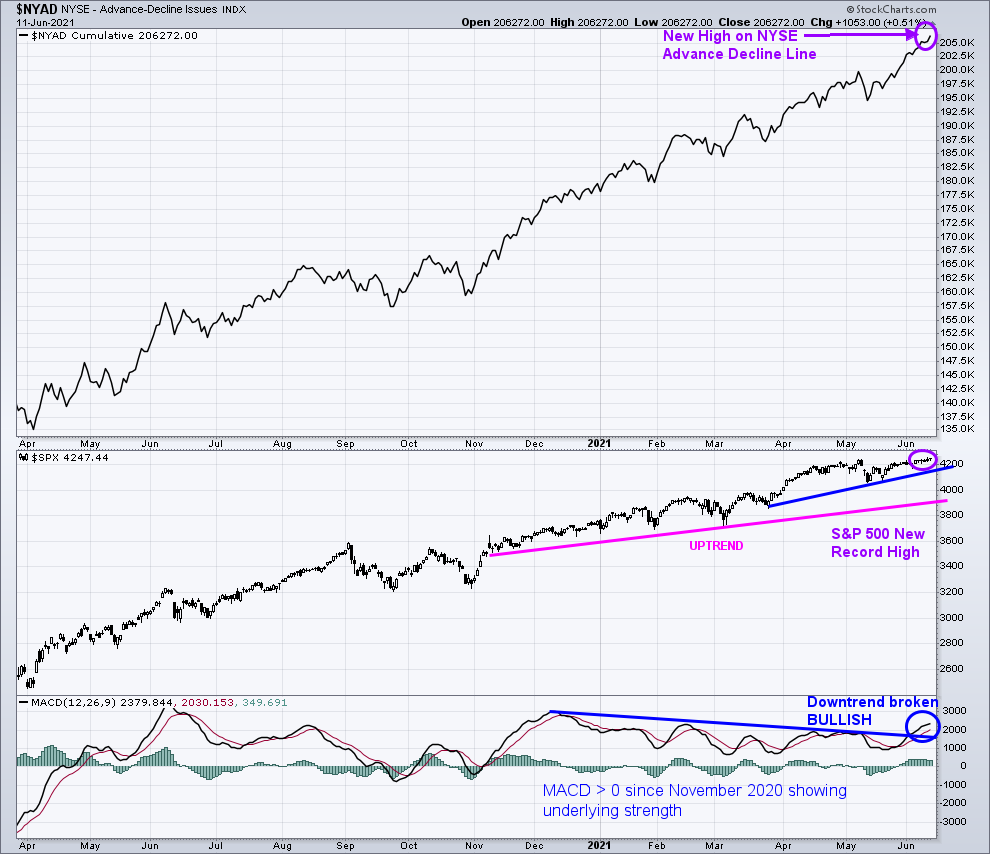
Figure 6: New York Stock Exchange Advance-Decline Line Top and S&P 500 Index Middle and MACD 12,26,9 Bottom
Source: Stockcharts.com
In the top portion of the chart (Figure: 6), The NYSE A/D line made a new high (purple arrow). Historically rarely does the market make a final peak when the cumulative advance-decline line makes a new high.
The advance/decline line (A/D) is one of my favorite technical indicators that measures market breadth. The A/D line shows how many stocks are participating in a stock market rally or decline. It represents a cumulative total of the number of stocks advancing versus the number of stocks declining. When the A/D Line rises, it means that more stocks are rising than declining (and vice versa).
The S&P 500 Index remains in an uptrend (blue line) from March (middle chart), closing at 4247.44, a record high (purple circle).
A close below the first support at 4100.00 would break the uptrend and warn of potential weakness. A close below 3723.34, the 3/4 low, would likely increase selling pressure beginning a more sustained decline.
The bottom chart is the S&P 500 and its 12,26,9 MACD, a measure of momentum. MACD in early June broke its downtrend since December 2020, implying more gains to follow. Notice how MACD remains >0 since November 2020, showing underlying strength.
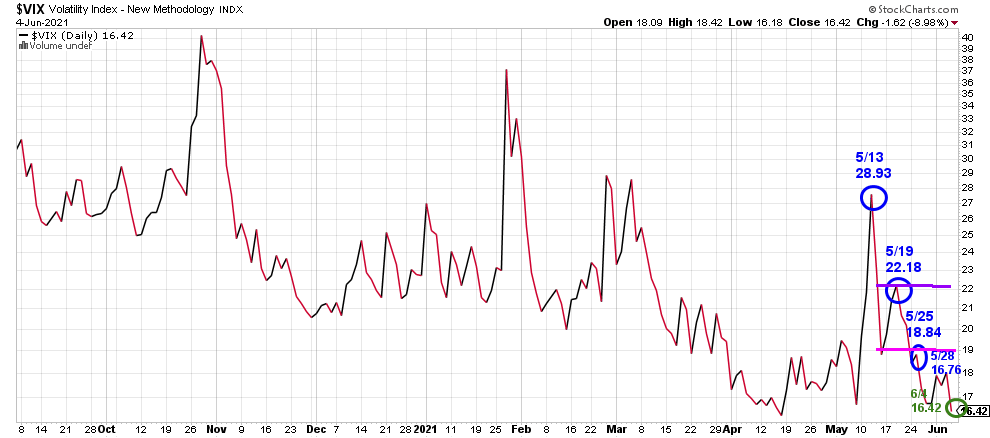
Figure 7: CBOE Volatility Index (VIX)
 Source: Stockcharts.com
As measured by The CBOE Volatility Index (VIX), volatility continues to fall after peaking on 5/13 at 28.93, closing at 15.65. A close above 16.76 would imply an increase in day-to-day volatility.
ETFs to Monitor 6/14 – 6/18
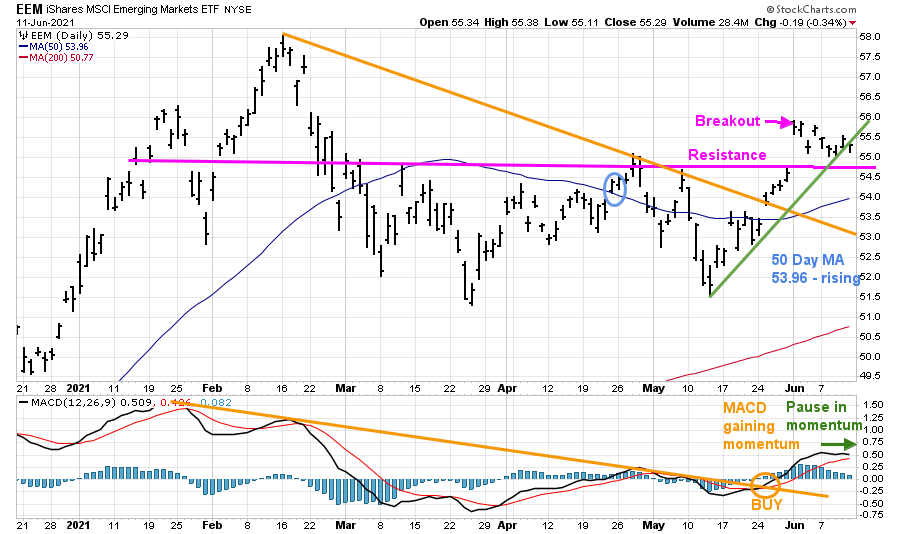
Figure 8: iShares MSCI Emerging Markets (EEM)
Source: Stockcharts.com
After EEM consolidated the past few months, on 6/1, EEM broke above resistance, a breakout. However, no follow-through yet. The short-term upside objective is 58.50. Support is at 54.50, followed by 54.00. A close below 54.00 would negate the upside objective.
MACD remains on a buy in the lower chart. However, momentum has stalled after hitting its highest level since last February. On the other hand, it’s positive that EEM 50-Day MA is now rising. Time will tell if EEM will accelerate higher or retest support.
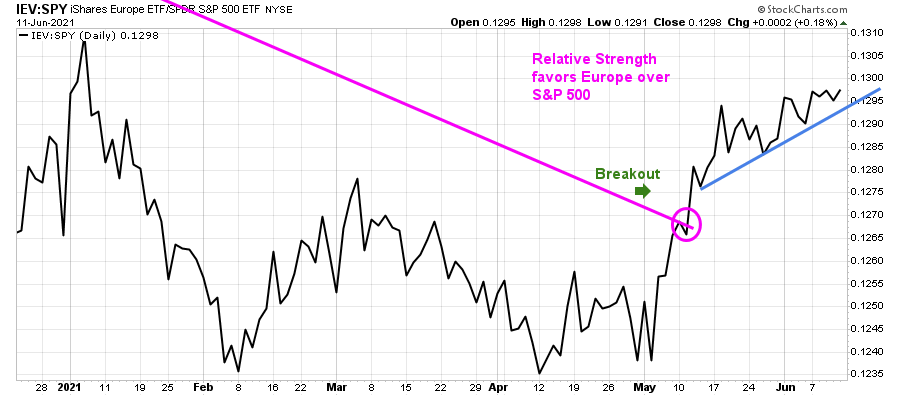
Figure 9: Daily iShares Europe/S&P 500 (IEV/SPY) Relative Strength Ratio
 Source: Stockcharts.com
Relative Strength continues to favor Europe (IEV) vs. S&P500 (SPY), which bodes well for the global markets in the short and intermediate-term.
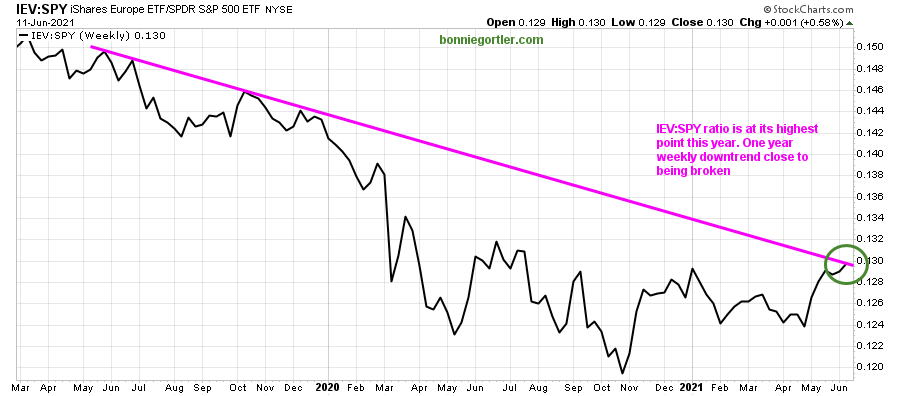
Figure 10: Weekly Ishares Europe/S&P 500 (IEV/SPY) Relative Strength Ratio
 Source: Stockcharts.com
The weekly IEV/SPY ratio is rising and at its highest point in 2021, close to breaking the one-year weekly downtrend from June. If the downtrend is broken, Europe will likely outperform the U.S. in the coming weeks to months.
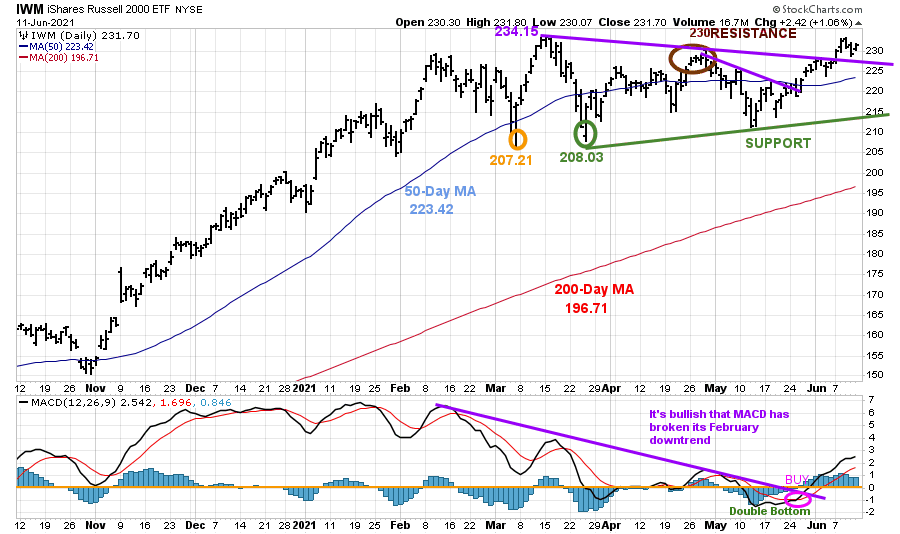
Figure 11: Daily iShares Russell 2000 (IWM) Price (Top) and 12-26-9 MACD (Bottom)
 Source: Stockcharts.com
The top portion of the chart is the daily iShares Russell 2000 Index ETF (IWM), the benchmark for small-cap stocks, with a 50-Day Moving Average (MA) (blue line) and 200-Day Moving Average (MA), that traders watch and use to define trends.
IWM made a low on 3/5 at 207.21 (orange circle), then peaked at 234.15. On 3/25, IWM successfully tested its low at 208.03 (green circle) and then stalled at 230.00, key resistance (brown circle).
A strong week for IWM, up +2.0%. IWM remains attractive after breaking its short-term downtrend from April (purple line), closing above its 50 Day MA and resistance at 230.00, implying at least a test of the old highs and potentially 250.00 upside target. On the other hand, If IWM turns down if IWM closes below 222.00, it would not bode well for the broad market.
The bottom half of the chart is MACD (12, 26, 9), a measure of momentum. MACD is on a buy and above its downtrend (purple line).
Now that IWM closed above resistance at 230.00, look for further gains in the near term. A close below the March low at 207.21 would negate my bullish outlook and imply a more serious decline.
Figure 12: Weekly iShares Russell 2000/S&P 500 (IWM/SPY) Relative Strength Ratio
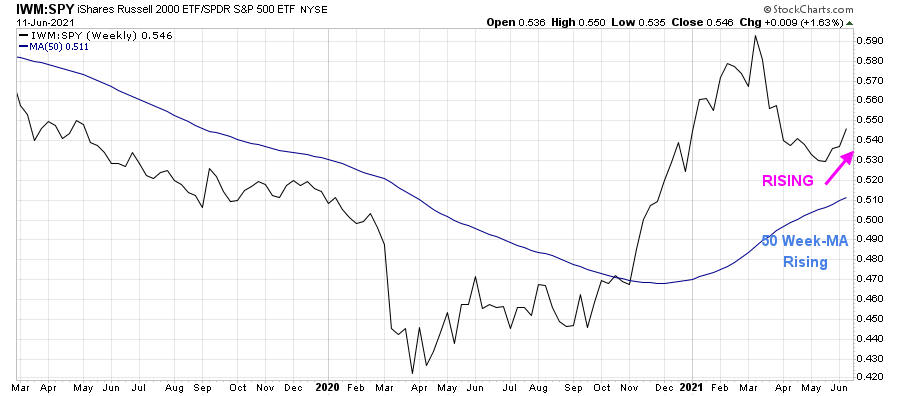 Source: Stockcharts.com
It’s bullish that the weekly IWM /SPY ratio has turned up and is now rising along with its 50-week Moving Average (MA). IWM is likely to outperform the S&P 500 in the coming weeks to months if this pattern continues.
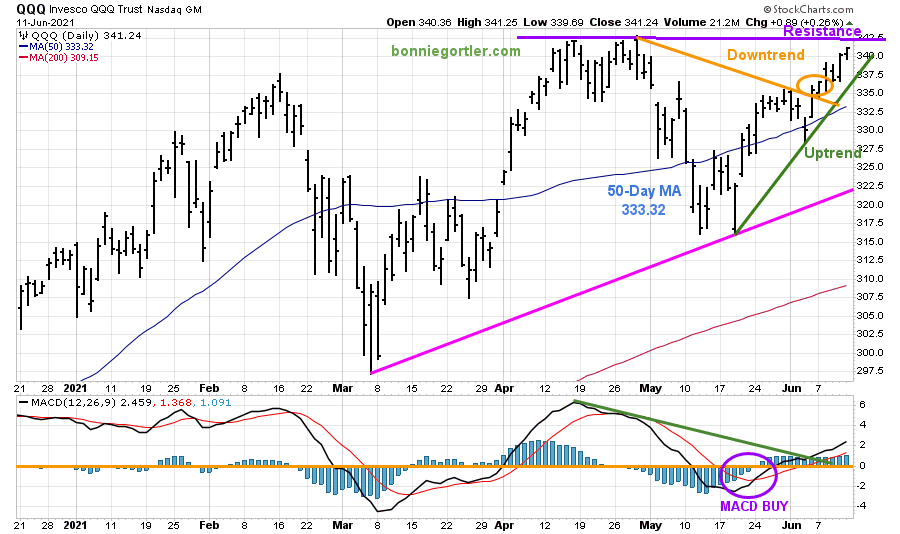
Figure 13: Daily Invesco QQQ Trust Nasdaq (QQQ) Price (Top) and 12-26-9 MACD bottom)
 Source: Stockcharts.com
The top part of the chart shows the daily Invesco QQQ, an exchange-traded fund based on the Nasdaq 100 Index with its 50-Day Moving Average and 200-Day Moving Average.
QQQ broke its May downtrend (orange circle) on 6/4 and is in the process of testing the 4/29 high of 342.80. Two closes above 342.80 would confirm further upside gains to 370.00.
Support is at 335.00 followed by 332.50. A close below 332.50 would negate the bullish pattern. A close below 320.00 would break the uptrend from March and imply a more serious decline is likely.
The bottom chart is MACD (12, 26, 9), a measure of momentum. MACD is on a buy. It’s positive that MACD is rising and starting to gain momentum.
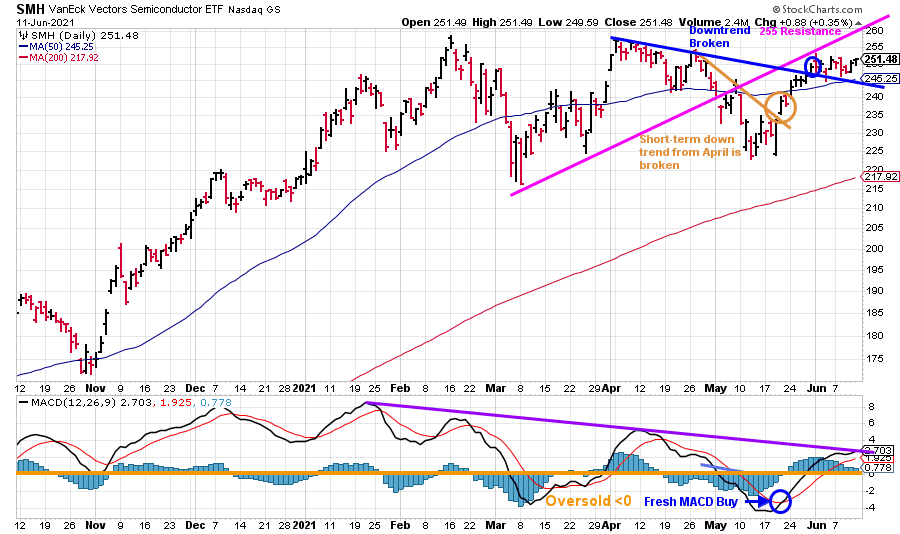
Figure 14: Daily Vaneck Vectors Semiconductor (SMH) Price (Top) and 12-26-9 MACD (Bottom)
 Source: Stockcharts.com
The top chart shows Semiconductors (SMH). Semiconductors (SMH) consolidated last week. Similar to QQQ, SMH broke its April downtrend (blue line), shifting the trend to up. SMH closed on 6/11 at 251.48 above its first resistance is at 250.00. Now another challenge to get through the next level of resistance at 255.00 followed by 260.00.
The lower chart is MACD, a measure of momentum. MACD remains on a buy. Watch for MACD to see if it can break the downtrend from January (purple line) to confirm continued strength in SMH, which would bode well for the broad market.
A close above 260.00 would imply a new leg up. Support is at 245.00 followed by 240.00. A close below 240.00 would be a warning sign the rally will stall and turn lower.
Summing Up:
The Russell 2000 (IWM) and Technology (QQQ) appear ready to break out to the upside and lead the overall market higher. Market breadth is favorable. Watch for Russell 2000 (IWM) and Invesco Trust Nasdaq (QQQ) to lead the market higher or if they weaken with Semiconductors (SMH) and Emerging Markets (EEM) this week. I am looking for another leg up. The tape remains positive. It is not a time to try and pick the top. The key closing numbers to watch for a trend change to negative is below 207.21 for IWM and below 320.00 for QQQ.
Remember to manage your risk, and your wealth will grow.
I would love to hear from you. If you have any questions or comments or would like to talk about the market, click here.
If you liked this article, you would love my Free report, Grow and Sustain Your Wealth. Please get it here.
Disclaimer: Although the information is made with a sincere effort for accuracy, it is not guaranteed that the information provided is a statement of fact. Nor can we guarantee the results of following any of the recommendations made herein. Readers are encouraged to meet with their own advisors to consider the suitability of investments for their own particular situations and for determination of their own risk levels. Past performance does not guarantee any future results.


Create more wealth in your life
with these simple strategies.
As an added bonus you will also
receive BG’s Updates and Ezine

Discover how to quickly create more well-being in your life with these simple strategies.
As an added bonus you will also
receive BG’s Updates and Ezine

As an added bonus you will receive BG’s Updates and Ezine

All work listed on BonnieGortler.com is licensed under a Creative Commons Attribution - Noncommercial - No Derivative Works 3.0 Unported License.


Free Report:
Grow and Sustain Your Wealth
Discover how to grow your money with these easy, simple steps.

