

10 Simple Tips for Financial Well-Being
07/01/2026
Buying shifted to selling. Only one of the eleven S&P sectors finished higher for the week ending 06/18/21. Six were weaker than the SPDR S&P 500 ETF Trust (SPY), down -1.89%. Technology (XLK) and Consumer Discretionary (XLY) were the leading sectors, +0.08% and -0.61%. Financials (XLF) and Materials (XLB) were the weakest sectors for the second week in a row, down -6.20% and -6.25%.
S&P SPDR Sector ETFs Performance Summary
Week Ending 6/18/21
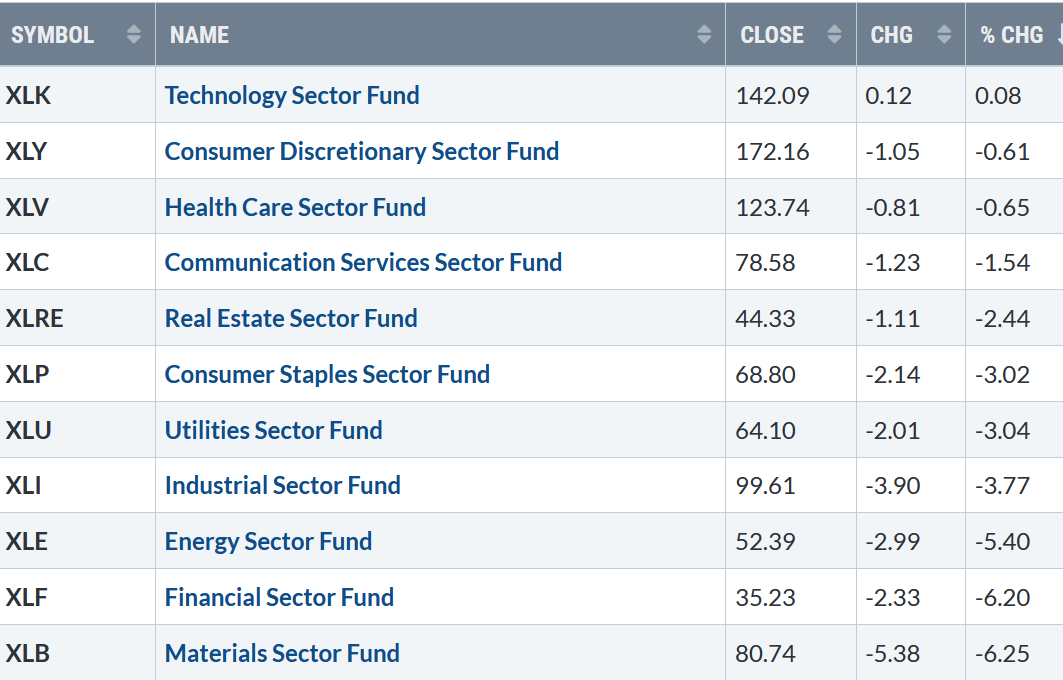
Source: Stockcharts.com
10-Year Treasury yields fell after a brief rise early in the week, closing at 1.45%, its lowest close since early March, hurting the financial sector. A further decline is likely to attract more buying into Nasdaq and more profit-taking in financials. Yields could fall to 1.27%, it’s lower channel objective (Figure 1 in green) over the next several weeks to months.
Figure 1: 10-Year Treasury Yields
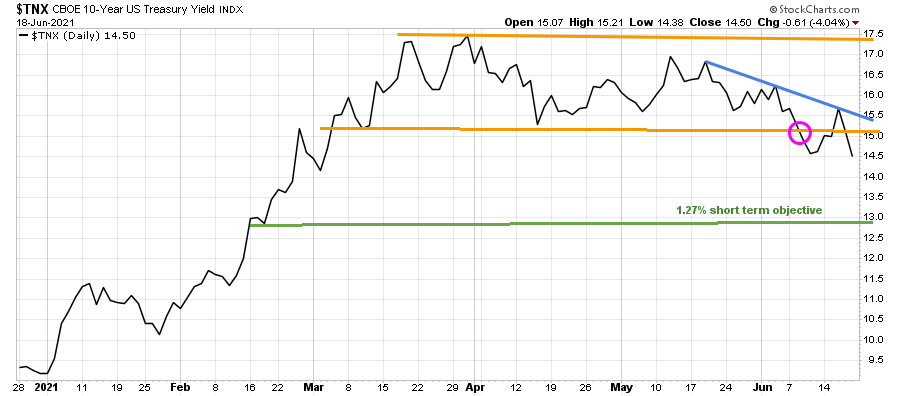
Source: Stockcharts.com
Volatility rose sharply last week. Selling intensified on Friday after the Federal Reserve meeting on 6/17. Investor’s fears of short-term rising interest rates combined with options, stock index options contracts, and stock index futures all expiring could have accelerated the decline.
The Dow closed Friday down -1.6%, lower, for the fifth day in a row. Growth-oriented Technology stocks outperformed Financials, Materials, and Energy which fell 2-3 times as much as the S&P 500.
The Dow lost -3.45%, its worst week since October 2020. The S&P 500 was down -1.91%, its worst week since February, and the Nasdaq was down -0.28%, breaking its 4-week winning streak. The Russell 2000 index fell -4.20%.
After four weeks in a row of more stocks up than down for both the Nasdaq and New York Stock Index (NYSE), weekly market breadth was negative. The New York Stock Exchange Index had 853 advances and 2634 declines. Nasdaq had 1395 advances and 3189 declines.
Figure 2: Daily New York Stock Exchange (NYSE) New Lows
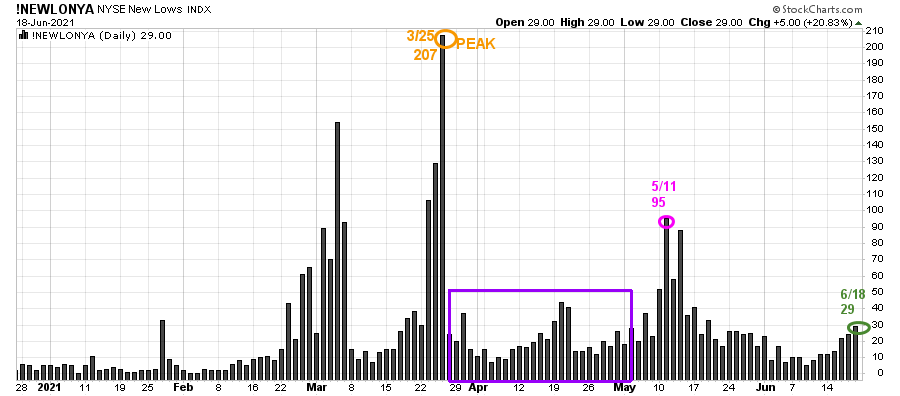
Source: Stockcharts.com
On 3/25, the NYSE New Lows peaked at 207 (orange circle) and immediately contracted (purple rectangle). On 5/11, New lows on NYSE jumped to 95, their highest level since late March flashing a warning sign, but New Lows immediately dropped. New Lows since 6/2 were under 25, showing healthy underlying internal strength.
New Lows on the NYSE on 6/18 (green circle) rose to 29, remaining in a low-risk zone where stock prices tend to rise.
Watching New lows on the New York Stock exchange is a simple technical tool that helps awareness about the immediate trend’s direction. In my book, Journey to Wealth, when the New Lows are below 25, the market is very strong (Very Low Risk and prices tend to rise). When New Lows are between 25 and 50, risk is low, and the odds of a further rally are likely.
If New Lows begin to expand and have a succession of days over 95 (the 5/11 high), this will imply more risk and a shift in trend. On the other hand, if they remain low, the odds favor the resumption of the rally.
The market is about money. Money flows in and the market goes up, money flows out and the market goes down.” – Jesse Livermore
ETFs to Monitor
Figure 3: Performance week of 6/11 – 06/118
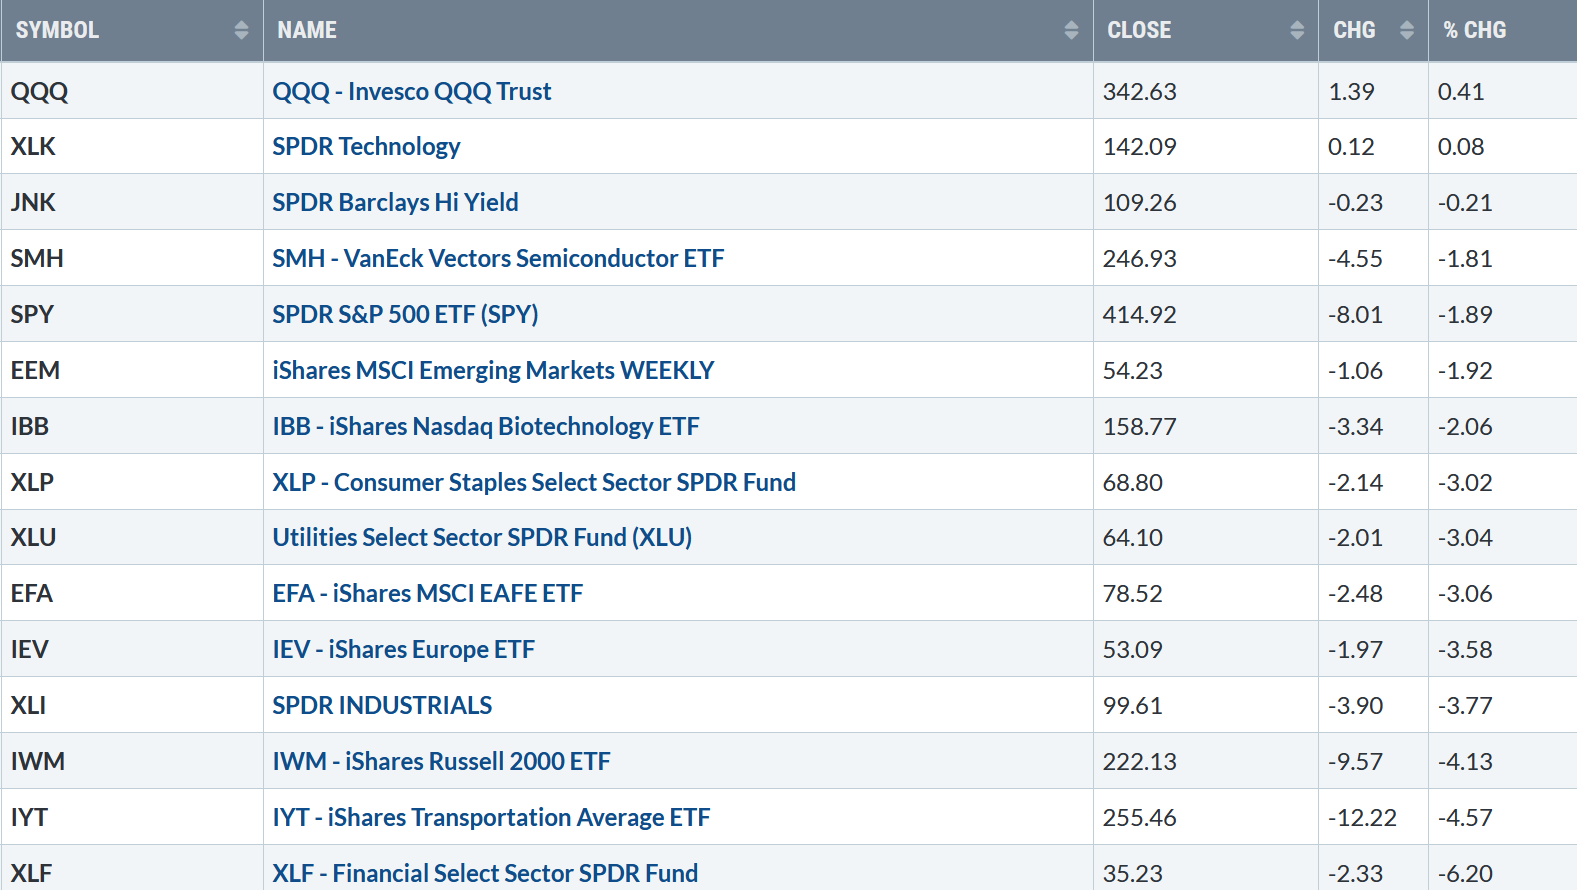
Source: Stockcharts.com
Positives
Negatives
Figure 4: LORD Abbett High Yield Fund
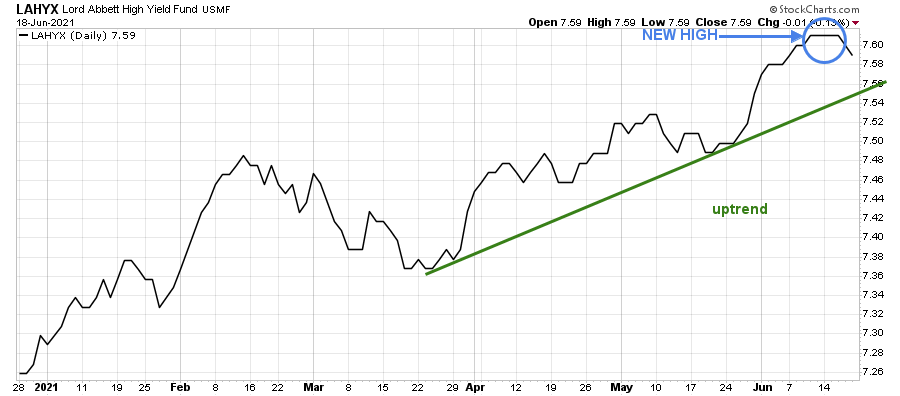
Source: Stockcharts.com
Figure 5: The Nasdaq Advance-Decline Line
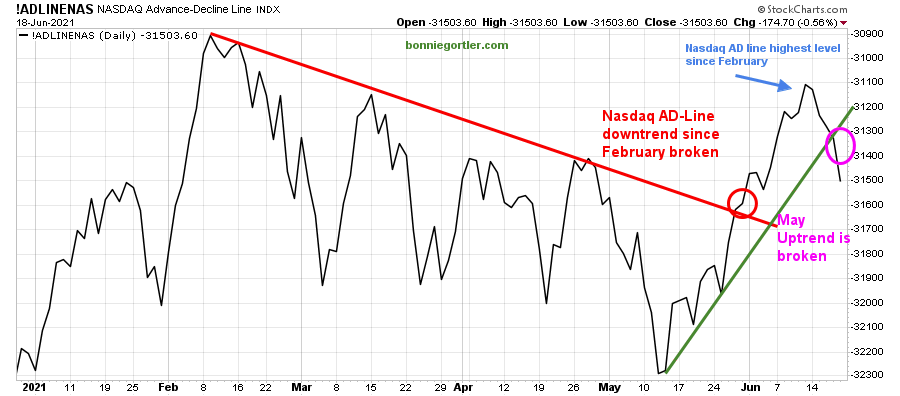
Source: Stockcharts.com
Figure 6: CNN Fear and Greed Index
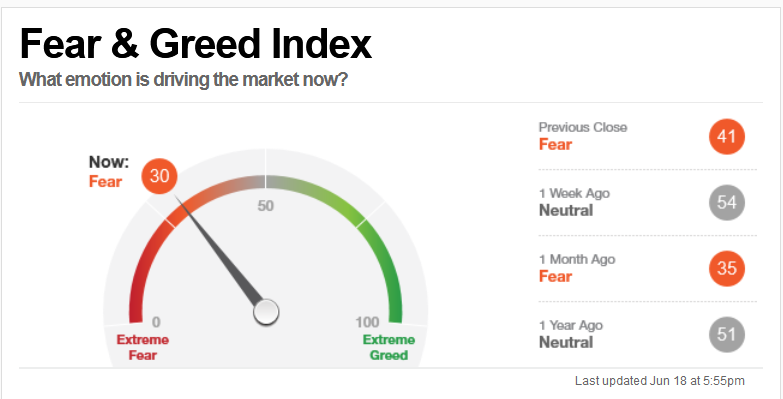 Source: CNN Business
Figure 7: New York Stock Exchange Advance-Decline Line Top and S&P 500 Index Bottom
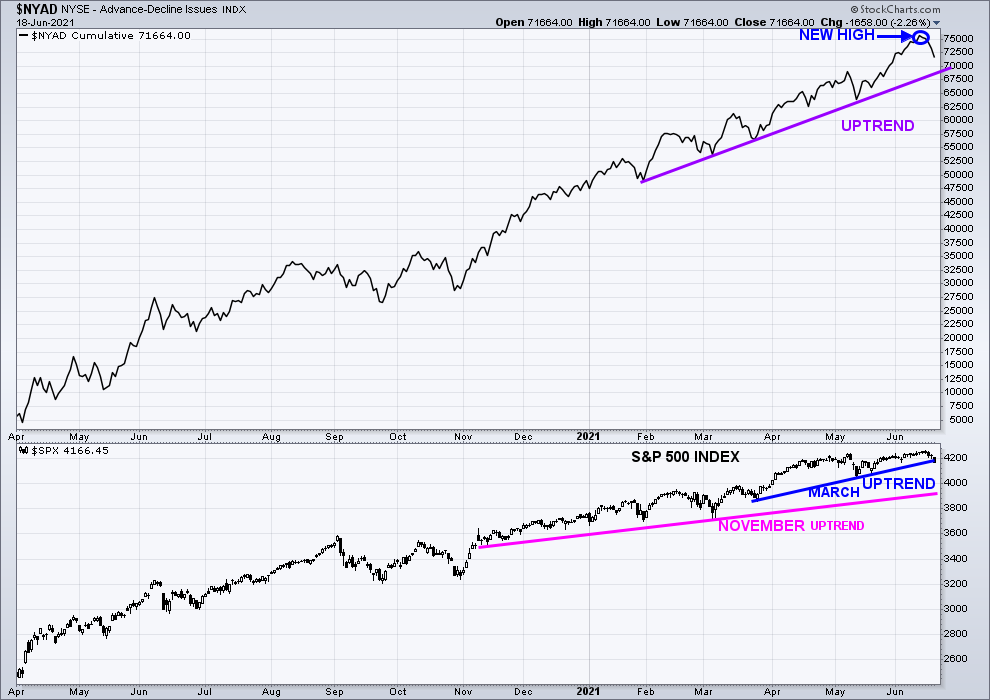
Source: Stockcharts.com
In the top portion of the chart (Figure: 6), The NYSE A/D line made a new high (blue arrow), confirming the S&P 500 high on 6/14. Historically rarely does the market make a final peak when the cumulative advance-decline line makes a new high.
The advance/decline line (A/D) is one of my favorite technical indicators that measures market breadth. The A/D line shows how many stocks are participating in a stock market rally or decline. It represents a cumulative total of the number of stocks advancing versus the number of stocks declining. When the A/D Line rises, it means that more stocks are rising than declining (and vice versa).
The lower chart is the S&P 500 Index remains in an uptrend (blue line) from March (bottom chart), closing at 4166.45. A close below 4100.00 would break the uptrend and warn of further weakness and potentially a decline of greater magnitude.
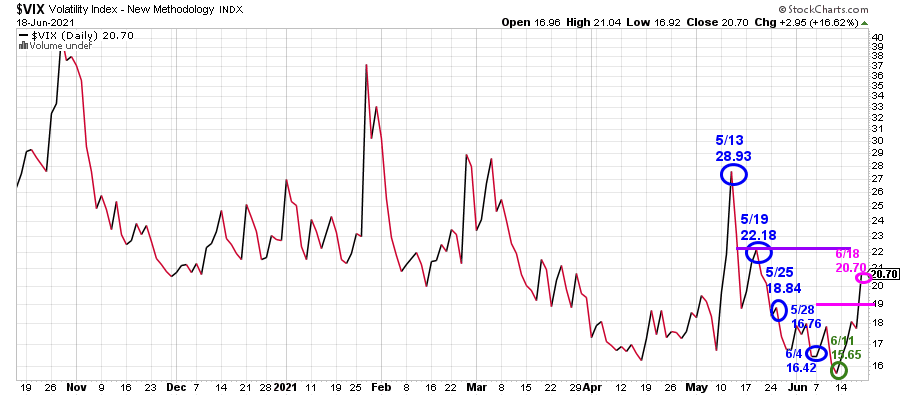
Figure 8: CBOE Volatility Index (VIX)
Source: Stockcharts.com
Daily volatility rose 32.3% for the week closing at 20.70. A close above 22.18, 5/19 close would imply an increase in day-to-day fluctuations and suggest that the decline will continue in the near term.
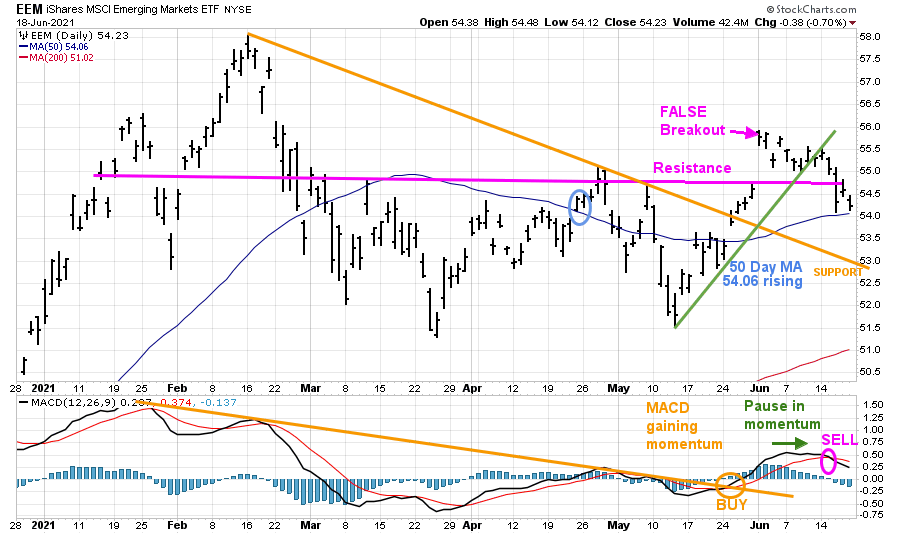
Figure 9: iShares MSCI Emerging Markets (EEM)
Source: Stockcharts.com
After EEM consolidated the past few months, on 6/1, EEM broke above resistance, a false breakout. EEM closed at 54.23, slightly above its 50-Day MA at 54.06, slightly above 54.00, keeping 58.50, the upside objective alive.
Support is at 54.00 followed by 53.00. Resistance is 54.50, followed by 55.00.
The lower chart is MACD, a measure of momentum. MACD is now on a sell. After hitting its highest level since last February, momentum stalled after EEM penetrated resistance. EEM is likely to go lower unless EEM closes above 55.00.
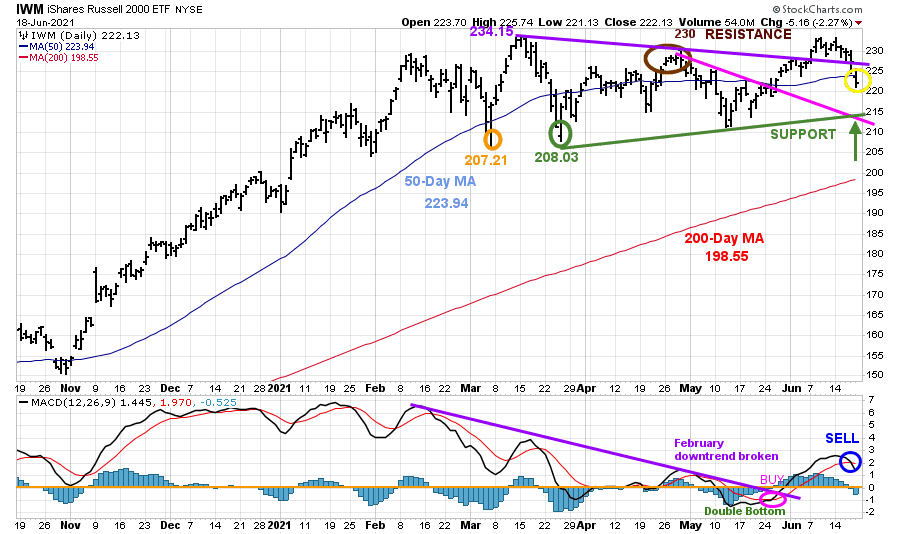
Figure 10: Daily iShares Russell 2000 (IWM) Price (Top) and 12-26-9 MACD (Bottom)
Source: Stockcharts.com
The top portion of the chart is the daily iShares Russell 2000 Index ETF (IWM), the benchmark for small-cap stocks, with a 50-Day Moving Average (MA) (blue line) and 200-Day Moving Average (MA), that traders watch and use to define trends.
IWM made a low on 3/5 at 207.21 (orange circle), then peaked at 234.15. On 3/25, IWM successfully tested its low at 208.03 (green circle) and then stalled at 230.00, key resistance (brown circle).
IWM was extremely weak, closing at 222.13, down -4.13%. IWM failed to gather any upside momentum after penetrating 230.00. As a result, IWM reversed lower, falling below its short-term downtrend from April (purple line), and below its 50 Day MA. If IWM continues to fall, it does not bode well for the broad market.
Key support is at 215.00. A close below the March low at 207.21 would imply a more serious decline.
The bottom half of the chart is MACD (12, 26, 9), a measure of momentum. MACD is now on a sell. More time is necessary for a safe reentry.
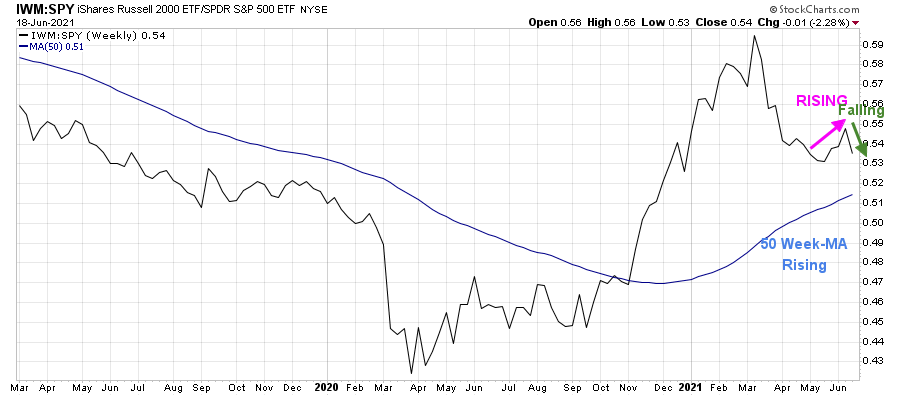
Figure 11: Weekly iShares Russell 2000/S&P 500 (IWM/SPY) Relative Strength Ratio
Source: Stockcharts.com
After turning up, the weekly IWM /SPY ratio has turned down. However, the 50-Week Moving Average (MA) is rising, giving hope to the bulls. If IWM can turn up and be stronger than the S&P 500 (SPY) this week, IWM will likely resume its advance and potentially outperform the S&P 500 in the coming weeks to months.
Figure 12: Daily Invesco QQQ Trust Nasdaq (QQQ) Price (Top) and 12-26-9 MACD bottom)
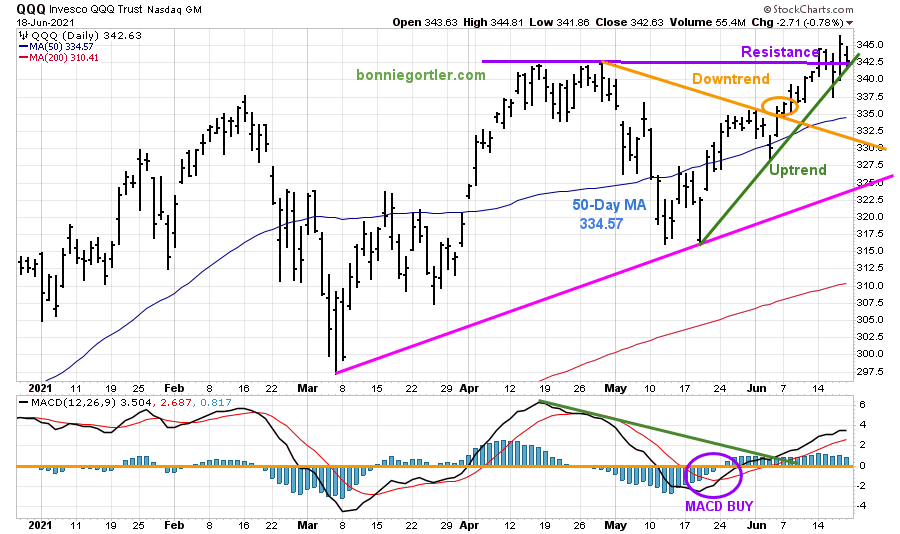
Source: Stockcharts.com
The top part of the chart shows the daily Invesco QQQ, an exchange-traded fund based on the Nasdaq 100 Index with its 50-Day Moving Average and 200-Day Moving Average.
After QQQ broke its May downtrend (orange circle) on 6/4, it gained strength, making a new high on 6/14. QQQ gained 0.41% last week, holding up better than the broader market. The upside object remains 370.00.
Support is at 335.00 followed by 331.00. A close below 331.00 would negate the short-term bullish pattern. A close below 322.50 would break the uptrend from March and imply a more serious decline is likely.
The bottom chart is MACD (12, 26, 9), a measure of momentum. MACD remains on a buy. However, MACD is no longer rising, which bears watching if it turns down and generates a sell.
Figure 13: Daily Vaneck Vectors Semiconductor (SMH) Price (Top) and 12-26-9 MACD (Bottom)
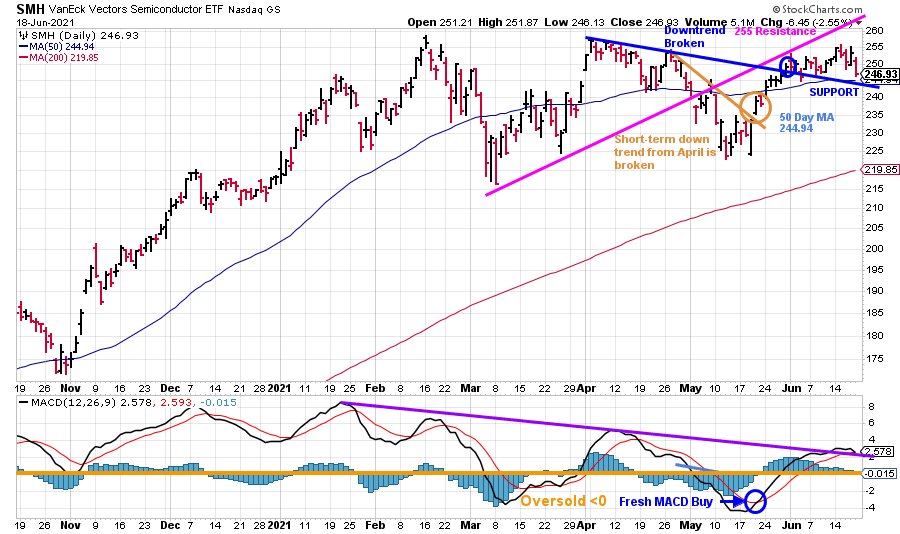
Source: Stockcharts.com
The top chart shows Semiconductors (SMH). Semiconductors (SMH) SMH closed on 6/18 at 246.93, down -1.8% last week, falling more than QQQ, not a favorable sign. However, it’s positive that SMH closed above support at 244.00 and remains above its April downtrend (blue line), the next support area at 240.00
Resistance is at 250.00 followed by 255.00
The lower chart is MACD, a measure of momentum. MACD is on a buy. However, any turn down in SMH will give a sell. Watch for MACD to see if it can hold above the downtrend from January (purple line), and turn up now, which would bode well for the broad market.
A close below 240.00 would be a warning sign of more weakness, while a close above 250.00 would likely imply a short-term advance.
Figure 14: ARKK Innovation ETF (ARK)
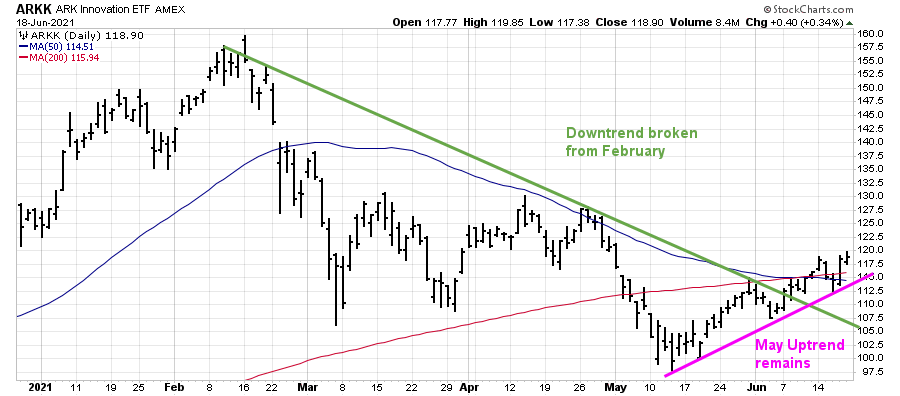
Source: Stockcharts.com
I like to watch the movement of ARKK Innovation to see the risk appetite of traders. ARKK has been in a downtrend since February. ARKK bottomed in early May and has been acting much better recently. If the uptrend from May can hold, then the recent decline could end quickly, and another leg up will soon begin.
Summing Up:
What a difference a week makes. The bullish tape shifted quickly to negative after the Federal Reserve meeting announced higher short-term rates earlier than expected. The Russell 2000 (IWM) failed to break out and instead moved sharply lower. Technology (QQQ) appeared ready to break out to the upside, didn’t follow through after making a new high but could not gain momentum. Strong sectors that have been favorable, especially financials, took a turn for the worst. Investors rotated out of value, and cyclical stocks moved sharply lower. Breakouts turned into breakdowns. Volatility increased sharply. Friday’s big down day was on heavy downside volume.
The major averages are short-term oversold and due for a bounce. Generally, after the NYSE AD-Line makes a new high, the first decline is not likely to be the final peak. If the averages stabilize early in the week, downside pressure could end sooner rather than later. Continue to give the benefit of the doubt to the bulls for now. However, review your portfolios and have an exit strategy in place if the decline continues to accelerate. The key closing numbers to watch for a major trend change are below 207.21 for IWM and below 322.50 for QQQ.
Remember to manage your risk, and your wealth will grow.
I would love to hear from you. If you have any questions or comments or would like to talk about the market, click here.
If you liked this article, you would love my Free report, Grow and Sustain Your Wealth. Please get it here.

Disclaimer: Although the information is made with a sincere effort for accuracy, it is not guaranteed that the information provided is a statement of fact. Nor can we guarantee the results of following any of the recommendations made herein. Readers are encouraged to meet with their own advisors to consider the suitability of investments for their own particular situations and for determination of their own risk levels. Past performance does not guarantee any future results.


Create more wealth in your life
with these simple strategies.
As an added bonus you will also
receive BG’s Updates and Ezine

Discover how to quickly create more well-being in your life with these simple strategies.
As an added bonus you will also
receive BG’s Updates and Ezine

As an added bonus you will receive BG’s Updates and Ezine

All work listed on BonnieGortler.com is licensed under a Creative Commons Attribution - Noncommercial - No Derivative Works 3.0 Unported License.


Free Report:
Grow and Sustain Your Wealth
Discover how to grow your money with these easy, simple steps.

