

10 Simple Tips for Financial Well-Being
07/01/2026
The major averages fell over 2% (the week ended March 8), their biggest weekly decline of 2019, after a weak jobs report fueling concerns that the global economy may be slowing down. The decline was brief. Stocks rallied getting back most of the previous week’s losses in only a few days, surprising the bears after five consecutive days of losses. Investors went bargain hunting and the bulls were thriving again.
Chart patterns were giving warning signals suggesting increased risk. Personally, I thought the decline would last longer than it did. The tape had turned negative, uptrends since the low in December were broken, market breadth deteriorated, new lows started to increase, small and mid-caps indices fell more than the major averages, transports fell 10 days in a row. Technology stocks started to falter breaking the Nasdaq 10-week winning streak.
However, the bull is alive and well. On March 8, the bull market in the S&P 500 reached 10 years. There is a real possibility another leg up may have started this week, but more confirmation is needed to see if the major averages will continue higher or stall and reverse lower. It’s too early to know for sure. Small and mid-cap stocks, semiconductors, transports, financials, and banks are worrisome because of weakening momentum patterns on daily charts. These sectors are weaker than the S&P 500 and lack leadership of late. This suggests caution by traders of not wanting to take on riskier assets. It’s a mixed picture that remains unclear. The big question, is the market due for a pullback, or some sort of pause after the huge gains since the December low? Time will tell. For now, don’t get too bullish or bearish. Have an open mind to all possibilities. The trend is your friend but be alert to a change of trend.
What to watch now for a sign of more gains or retracement ahead
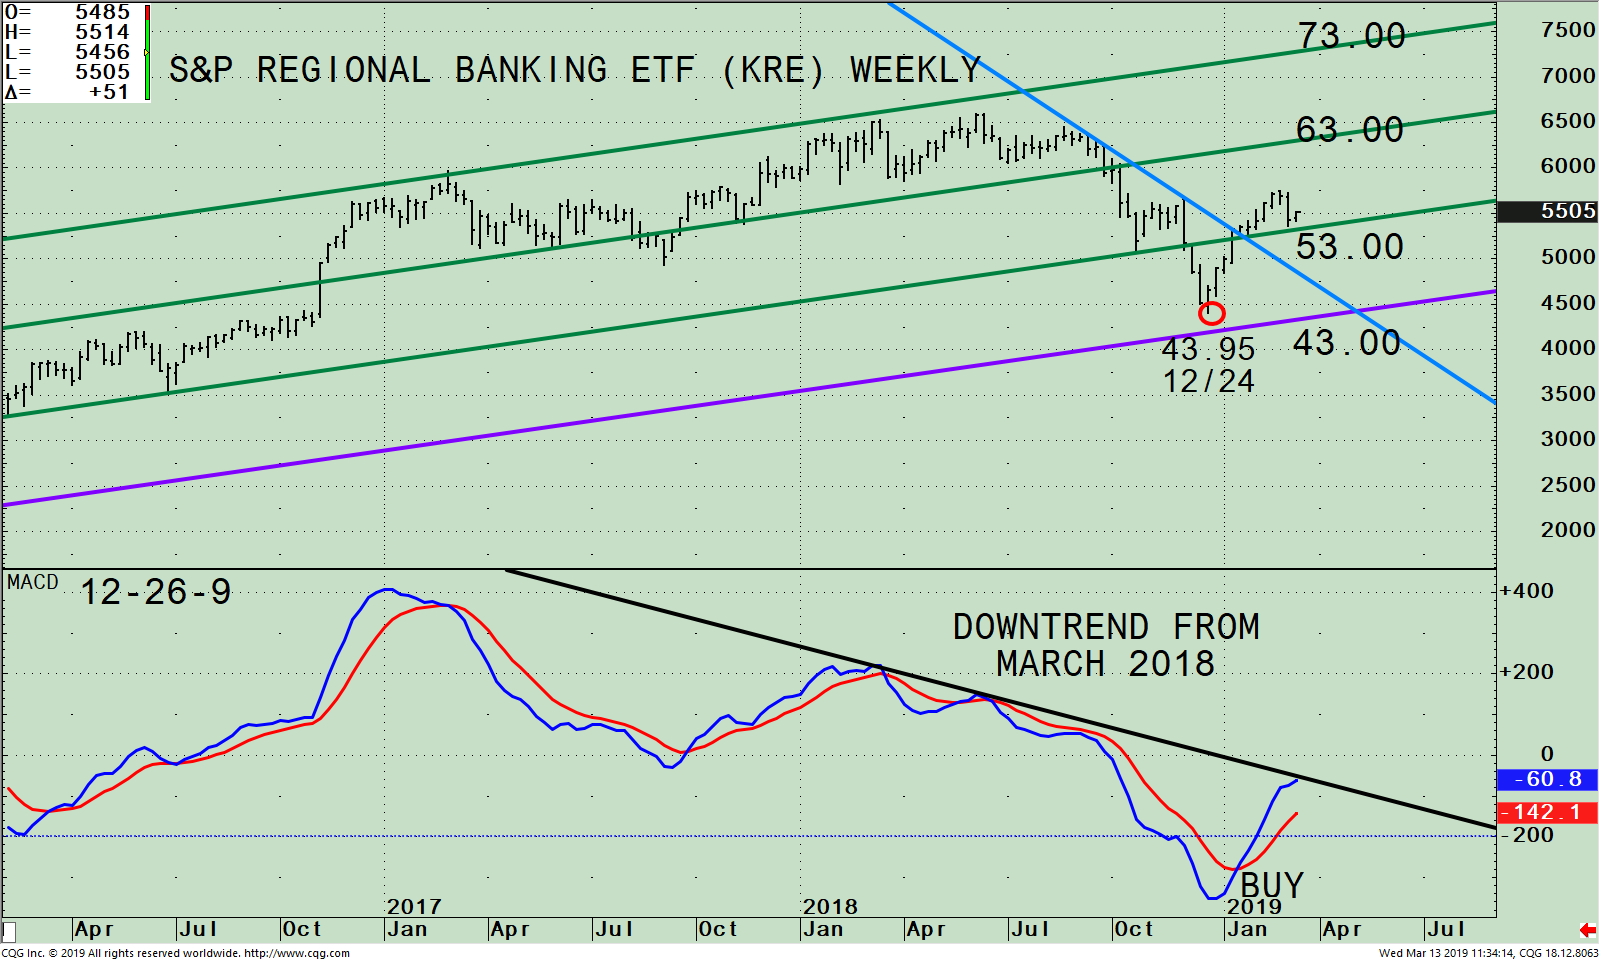
Figure: SPDR Regional Banking ETF (KRE) Weekly Price and Trend Channels (Top), and MACD 12-26-9 (Bottom)
The top part of the chart shows the weekly SPDR Regional Banking (KRE), with its significant trend channels (green and purple lines). KRE is an exchange-traded-fund (ETF) that began in 2006. KRE tracks an equally weighted index of common stocks including leading regional banks or thrifts (savings and loan associations). KRE can be a volatile ETF at times, even though it holds 125 stocks and its top ten holdings are less than 3%.[1]
I like to watch the strength of Regional Banks (KRE) for a clue when there is a potential trend change. When the KRE is strong, it tends to be a positive sign for the broad market. However, when KRE lags, it tends to be a warning sign that a potential short-term retracement may occur. KRE made a new high on 6/8/18, a few months before the S&P 500 high in September.
Banks remain out of favor as investors have shifted away from financials into other sectors. In March, the financial sector is not showing signs of strength or gaining leadership. KRE closed at 56.61 on 2/28 and is down -3.04% at 54.89 month to date while the S&P 500 (SPY) is up 1.19%.
KRE broke its downtrend in January (blue line). However, there doesn’t seem to be any excitement or interest among investors. KRE fell 6.9% from its 2/25 peak at 57.52 to bottom at 53.55 on 3/8, holding above the lower channel before staging an advance.
Support is at 53.00. A close below 53.00 would imply a move lower to potentially test the 12/24 low, which could have bearish implications for the broad market. A close above the 2/25 peak at 57.52 would imply further gains to potentially 63.00 and be considered positive for the broad market.
The lower portion of the chart is MACD (12, 26, 9), a technical indicator that measures momentum. MACD is on a buy, below 0 and rising. Near-term momentum has slowed since the KRE bottomed in December. It would be positive if MACD would continue to rise and break the March downtrend (black line), showing improvement in momentum and implies more gains in the coming weeks. If KRE would stall now, MACD is likely to turn lower giving warning signs of potential trouble ahead which could carry over to other sectors.
In Sum:
The next several days after options expiration is over (quadruple witching) will set the tone for the next several weeks. Our trading model remains on buy suggesting higher prices with contained risk. It’s very rare for the market to go up in this magnitude so quickly. However, the trend remains up with the bulls in control. When the KRE is a leader it tends to be positive for the overall market. If KRE rises and starts to outperform the S&P 500 (SPY) in the near term, this would suggest more gains and no retracement in the near term. This could cause massive buy programs forcing traders to cover their shorts that would extend the advance.
***As of 3/12/19, the top holdings of KRE are Bank OZK (OZK) 2.09%, SVB Financial Group (SIVB) 1.87%, Signature Bank (SNBY) 1.83%, SunTrust Bank (STI) 1.81% Synovus Financial Corp (SNV) 1.79%, CIT Group Inc (CIT) 1.79%, Comerica Inc (CMA) 1.78%, PacWest Bancorp (PACW) 1.77%, Zions Bancorporation NA (ZION) 1.76% and Fifth Third Bancorp (FITB) 1.76% totaling 18.25%. Source: https://etfdb.com/etf/KRE/
I would love to hear from you. Please call me at 516-829-6444 or email at bgortler@signalert.com to share your thoughts or ask me any questions you might have.
[1] As of 3/12/19, the top holdings of KRE are Bank OZK (OZK) 2.09%, SVB Financial Group (SIVB) 1.87%, Signature Bank (SNBY) 1.83%, SunTrust Bank (STI) 1.81% Synovus Financial Corp (SNV) 1.79%, CIT Group Inc (CIT) 1.79%, Comerica Inc (CMA) 1.78%, PacWest Bancorp (PACW) 1.77%, Zions Bancorporation NA (ZION) 1.76% and Fifth Third Bancorp (FITB) 1.76% totaling 18.25%. Source: https://etfdb.com/etf/KRE/
******Article published in Systems and Forecasts by Bonnie Gortler March 14, 2019
Disclaimer: Although the information is made with a sincere effort for accuracy, it is not guaranteed that the information provided is a statement of fact. Nor can we guarantee the results of following any of the recommendations made herein. Readers are encouraged to meet with their own advisors to consider the suitability of investments for their own particular situations and for determination of their own risk levels. Past performance does not guarantee any future results.
If you like this article you would love the free excerpt chapter of my book Journey to Wealth.
Get instant access here


Create more wealth in your life
with these simple strategies.
As an added bonus you will also
receive BG’s Updates and Ezine

Discover how to quickly create more well-being in your life with these simple strategies.
As an added bonus you will also
receive BG’s Updates and Ezine

As an added bonus you will receive BG’s Updates and Ezine

All work listed on BonnieGortler.com is licensed under a Creative Commons Attribution - Noncommercial - No Derivative Works 3.0 Unported License.


Free Report:
Grow and Sustain Your Wealth
Discover how to grow your money with these easy, simple steps.

